


Jasmin Nihalani
@jasminnihalani.bsky.social
https://jasmin-nihalani.github.io/
Data journalist for BBC (Indian languages)
Data journalist for BBC (Indian languages)
New ✨ A visual story that analyses how Bollywood (the Hindi film industry) has changed in the last 30 years.
From romance, to action and now to films high on political and historical themes.
Read here: jasmin-nihalani.github.io/bollywood-ro...
From romance, to action and now to films high on political and historical themes.
Read here: jasmin-nihalani.github.io/bollywood-ro...
August 16, 2025 at 11:52 AM
New ✨ A visual story that analyses how Bollywood (the Hindi film industry) has changed in the last 30 years.
From romance, to action and now to films high on political and historical themes.
Read here: jasmin-nihalani.github.io/bollywood-ro...
From romance, to action and now to films high on political and historical themes.
Read here: jasmin-nihalani.github.io/bollywood-ro...
Reposted by Jasmin Nihalani

A simulation to estimate when you will die, because you only live once flowingdata.com/projects/202...

When You Will Die
It is impossible to know when it is our last day, but we can guess with probabilities.
flowingdata.com
March 20, 2025 at 6:54 PM
A simulation to estimate when you will die, because you only live once flowingdata.com/projects/202...
Reposted by Jasmin Nihalani

Decades from now, the Covid-19 pandemic will be visible in the historical data of nearly anything measurable today. Here’s an incomplete collection of charts that capture that break — across the economy, health care, education, work, family life and more.

30 Charts That Show How Everything Changed in March 2020
It can be easy to forget, or look away from, the pain and disruption of the pandemic. The numbers will be there to remind us.
www.nytimes.com
March 10, 2025 at 7:24 AM
Decades from now, the Covid-19 pandemic will be visible in the historical data of nearly anything measurable today. Here’s an incomplete collection of charts that capture that break — across the economy, health care, education, work, family life and more.
Reposted by Jasmin Nihalani
Dishonest charts are coming from all directions, and they're only going to hit harder. Unless we push back. So, an interactive guide: Defense Against Dishonest Charts flowingdata.com/projects/dis...
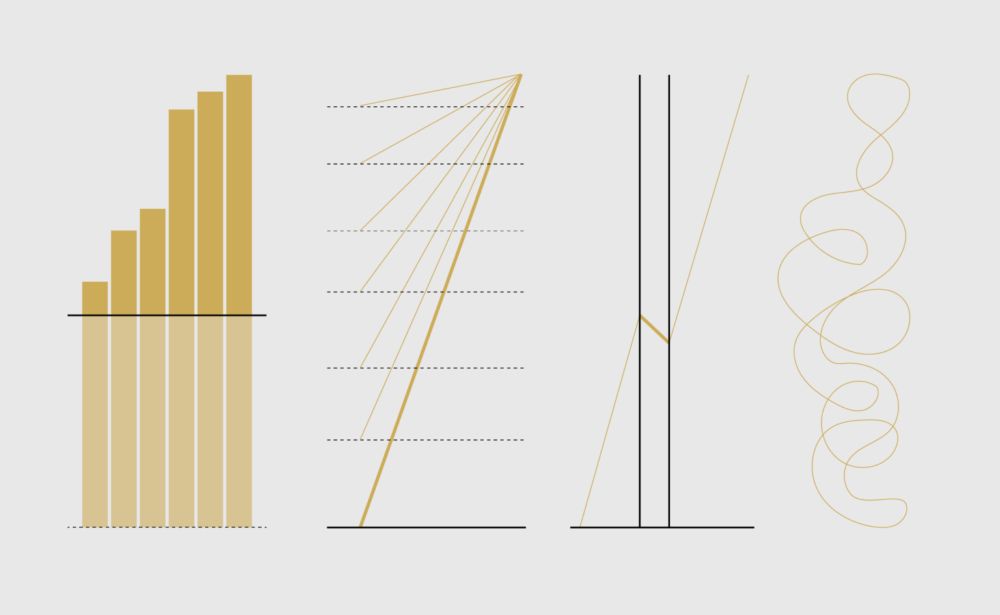
Defense Against Dishonest Charts
This is a guide to protect ourselves and to preserve what is good about turning data into visual things.
flowingdata.com
February 13, 2025 at 9:45 PM
Dishonest charts are coming from all directions, and they're only going to hit harder. Unless we push back. So, an interactive guide: Defense Against Dishonest Charts flowingdata.com/projects/dis...