


Jamon M - MLS and footy analysis
@jamonm.bsky.social
American Soccer Analysis: Co-creator g+ GameFlows and the Where Goals Come From project. he/him
Regular FSD readers (thank you!) might note something new: I've added grouping bars to my analysis toolkit.
Not just another chart, it's extremely configurable across the 2,000 metrics/stats I can track.
What group of metrics/stats would you like to see next? Here's xG Tier goals:
Not just another chart, it's extremely configurable across the 2,000 metrics/stats I can track.
What group of metrics/stats would you like to see next? Here's xG Tier goals:

November 22, 2025 at 1:22 AM
Regular FSD readers (thank you!) might note something new: I've added grouping bars to my analysis toolkit.
Not just another chart, it's extremely configurable across the 2,000 metrics/stats I can track.
What group of metrics/stats would you like to see next? Here's xG Tier goals:
Not just another chart, it's extremely configurable across the 2,000 metrics/stats I can track.
What group of metrics/stats would you like to see next? Here's xG Tier goals:
Kai Wagner got a bit of a boost by looking at all ball-winning actions, because he gets a high amount of successful tackles that win possession.
To be fair, ball-winning actions doesn't change teams by a lot on a per-game basis compared to recoveries alone, but I wanted to show it anyway.
5/
To be fair, ball-winning actions doesn't change teams by a lot on a per-game basis compared to recoveries alone, but I wanted to show it anyway.
5/

November 22, 2025 at 12:41 AM
Kai Wagner got a bit of a boost by looking at all ball-winning actions, because he gets a high amount of successful tackles that win possession.
To be fair, ball-winning actions doesn't change teams by a lot on a per-game basis compared to recoveries alone, but I wanted to show it anyway.
5/
To be fair, ball-winning actions doesn't change teams by a lot on a per-game basis compared to recoveries alone, but I wanted to show it anyway.
5/
Whoops, that went out before I was ready. Let's pick this back up.
Jeppe Tverskov from San Diego is the breakaway leader in recoveries.
Recoveries are not the only ways players win balls, however. There are also interceptions and tackles won (w/ the ball): ball-winning actions.
4/
Jeppe Tverskov from San Diego is the breakaway leader in recoveries.
Recoveries are not the only ways players win balls, however. There are also interceptions and tackles won (w/ the ball): ball-winning actions.
4/

November 22, 2025 at 12:36 AM
Whoops, that went out before I was ready. Let's pick this back up.
Jeppe Tverskov from San Diego is the breakaway leader in recoveries.
Recoveries are not the only ways players win balls, however. There are also interceptions and tackles won (w/ the ball): ball-winning actions.
4/
Jeppe Tverskov from San Diego is the breakaway leader in recoveries.
Recoveries are not the only ways players win balls, however. There are also interceptions and tackles won (w/ the ball): ball-winning actions.
4/
But which players are helping these teams create this differential? With my handy new player analysis, we can easily answer this question.
Here are the top 40 players in total recoveries for the season.
Here are the top 40 players in total recoveries for the season.

November 22, 2025 at 12:29 AM
But which players are helping these teams create this differential? With my handy new player analysis, we can easily answer this question.
Here are the top 40 players in total recoveries for the season.
Here are the top 40 players in total recoveries for the season.
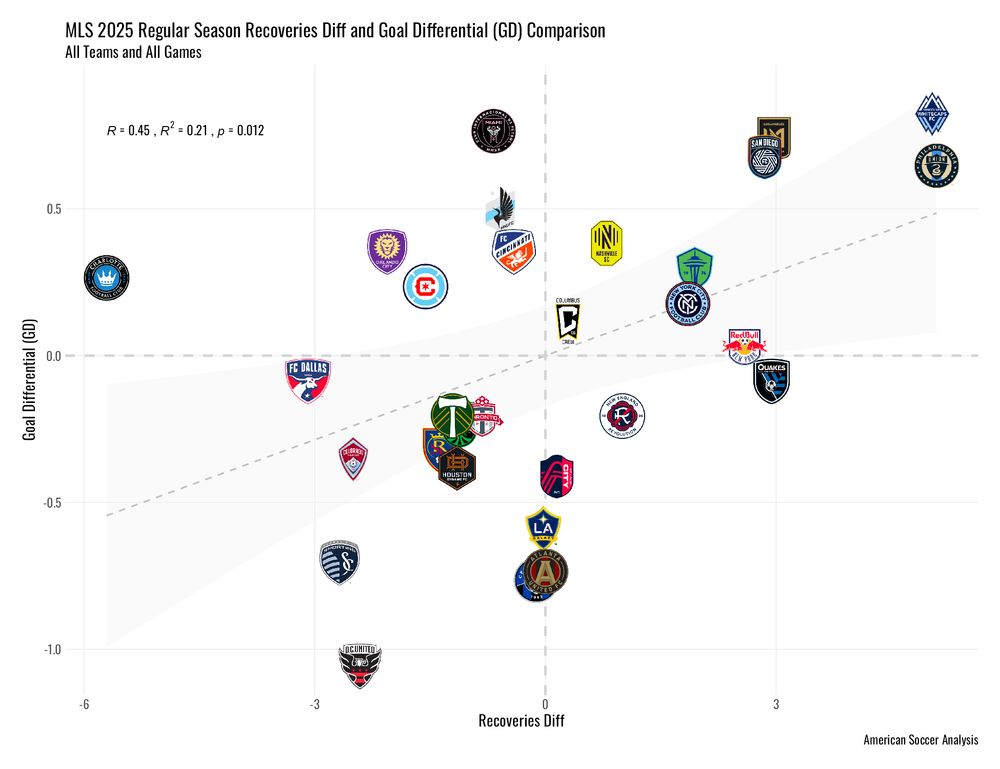
So we can see how the full season ended, here is a scatterplot of recoveries differential and goal differential.
As a bonus, here is the same but with expected goals differential (xGD). It's not surprising that it has a bit of a stronger effect with xGD.
2/
As a bonus, here is the same but with expected goals differential (xGD). It's not surprising that it has a bit of a stronger effect with xGD.
2/

November 22, 2025 at 12:29 AM
So we can see how the full season ended, here is a scatterplot of recoveries differential and goal differential.
As a bonus, here is the same but with expected goals differential (xGD). It's not surprising that it has a bit of a stronger effect with xGD.
2/
As a bonus, here is the same but with expected goals differential (xGD). It's not surprising that it has a bit of a stronger effect with xGD.
2/
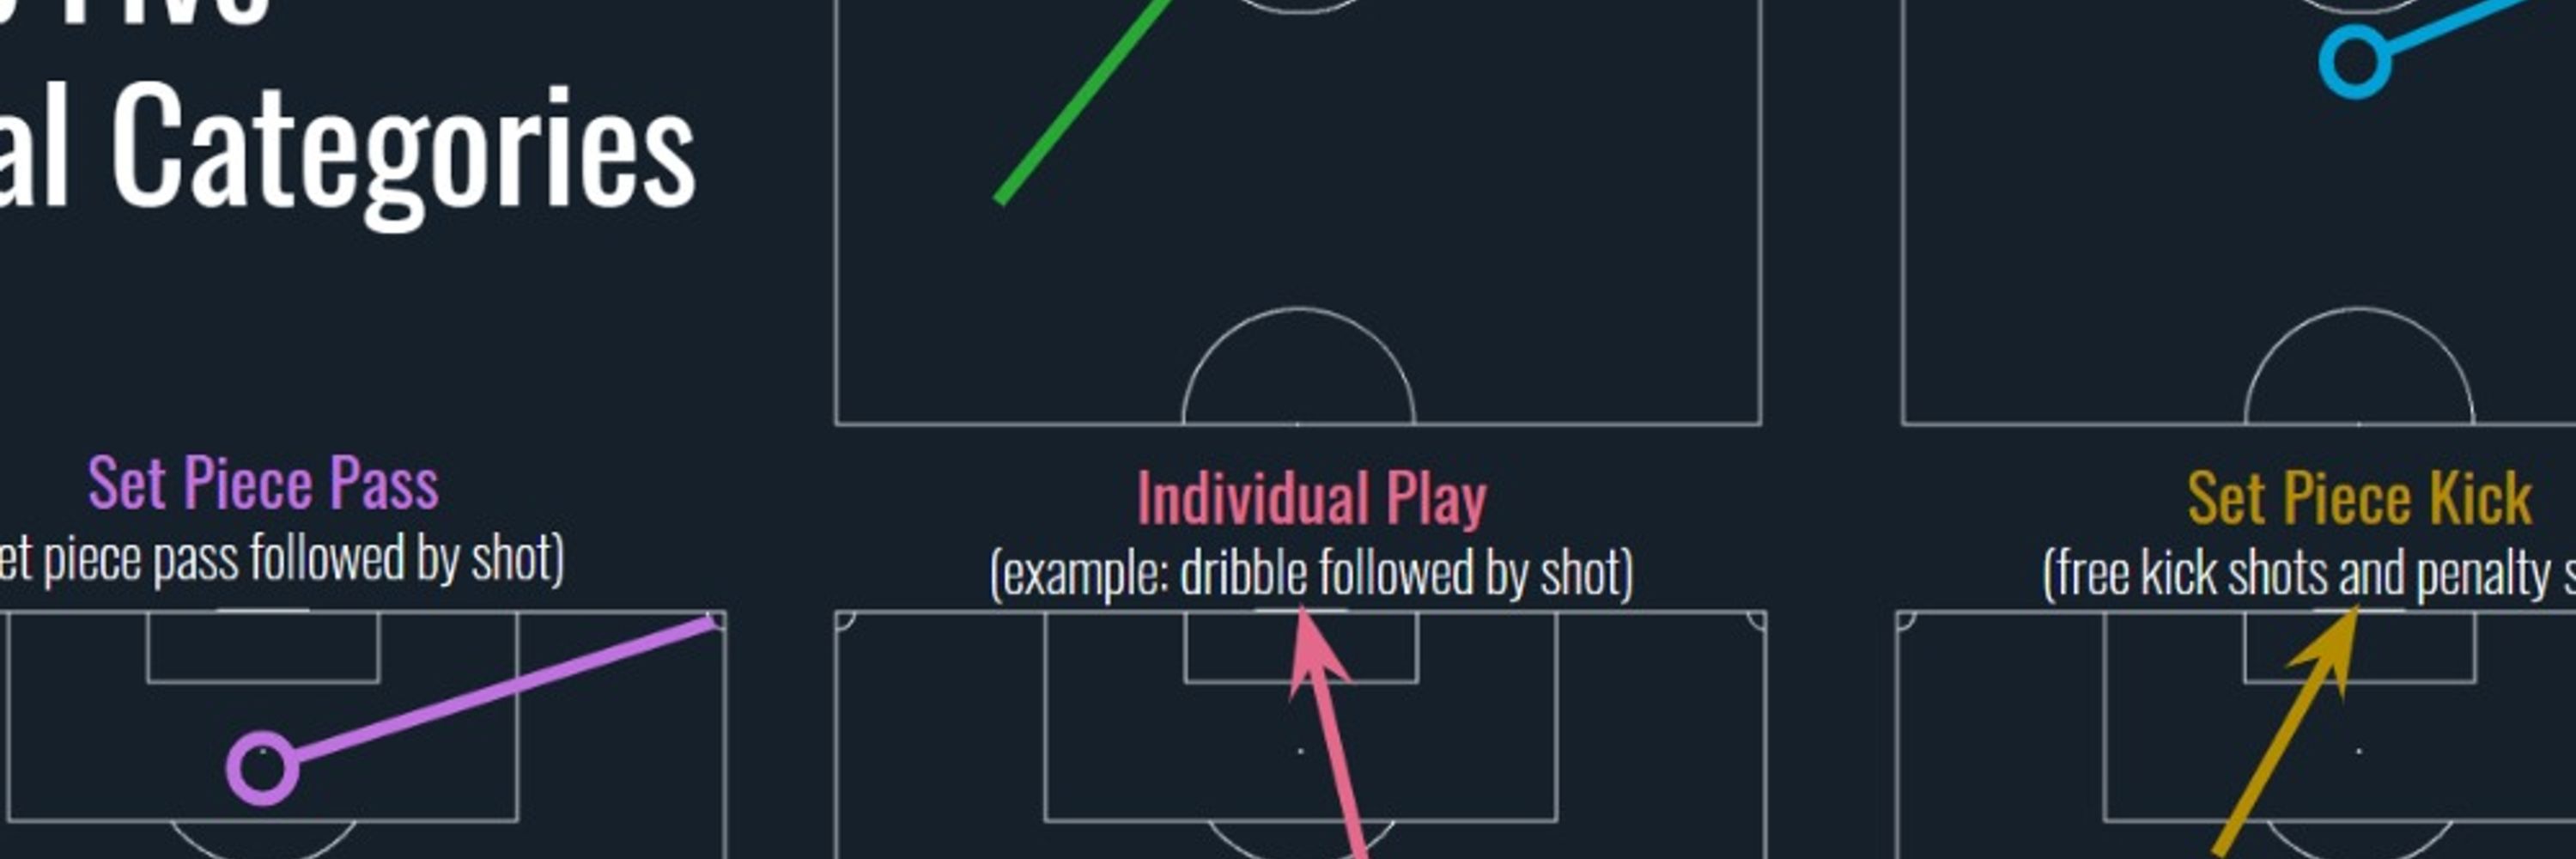
The objective is to identify passes not classified as through balls but create clear attacking space behind defenders. Event data poses challenges, which is why it's a "mostly accurate" method.
Looking at completed through balls + linebreaking passes gives us an interesting set of players:
/end
Looking at completed through balls + linebreaking passes gives us an interesting set of players:
/end

November 8, 2025 at 7:24 PM
The objective is to identify passes not classified as through balls but create clear attacking space behind defenders. Event data poses challenges, which is why it's a "mostly accurate" method.
Looking at completed through balls + linebreaking passes gives us an interesting set of players:
/end
Looking at completed through balls + linebreaking passes gives us an interesting set of players:
/end
One more category for today: linebreaking passes. As I've previously shared on Friday Stat Dump, I use my own calculation based on event data which captures ~80% of them.
I'm putting this out because the retiring Jordi Alba and Sergio Busquets are at the top of the list. Happy retirement, guys.
6/
I'm putting this out because the retiring Jordi Alba and Sergio Busquets are at the top of the list. Happy retirement, guys.
6/

November 8, 2025 at 4:44 PM
One more category for today: linebreaking passes. As I've previously shared on Friday Stat Dump, I use my own calculation based on event data which captures ~80% of them.
I'm putting this out because the retiring Jordi Alba and Sergio Busquets are at the top of the list. Happy retirement, guys.
6/
I'm putting this out because the retiring Jordi Alba and Sergio Busquets are at the top of the list. Happy retirement, guys.
6/
Not really a shot-generating category, but I think a very interesting category is "switches of play". The method here is that the pass has to cross the center of the pitch and be 60 yds or more.
The winner this season is a center back.
5/
The winner this season is a center back.
5/

November 8, 2025 at 4:44 PM
Not really a shot-generating category, but I think a very interesting category is "switches of play". The method here is that the pass has to cross the center of the pitch and be 60 yds or more.
The winner this season is a center back.
5/
The winner this season is a center back.
5/
For crosses, I didn't want to just use "completed" like the earlier two. In those cases, it's out of the hands of the passer a little if they lead to a shot or another pass.
But crosses are only valuable directly leading to a shot.
No surprise who the best crosser in the league is in 2025.
4/
But crosses are only valuable directly leading to a shot.
No surprise who the best crosser in the league is in 2025.
4/

November 8, 2025 at 4:44 PM
For crosses, I didn't want to just use "completed" like the earlier two. In those cases, it's out of the hands of the passer a little if they lead to a shot or another pass.
But crosses are only valuable directly leading to a shot.
No surprise who the best crosser in the league is in 2025.
4/
But crosses are only valuable directly leading to a shot.
No surprise who the best crosser in the league is in 2025.
4/
But I digress (it was worth a digression). My favorite pass in the right situations is the end-line cutback. Using the area beside the 6 yd box extended to the side of the 18 as a guideline, shots from cutbacks produce nearly the xG of shots from throughballs.
And we have a new Cutbacks King!
3/
And we have a new Cutbacks King!
3/

November 8, 2025 at 4:44 PM
But I digress (it was worth a digression). My favorite pass in the right situations is the end-line cutback. Using the area beside the 6 yd box extended to the side of the 18 as a guideline, shots from cutbacks produce nearly the xG of shots from throughballs.
And we have a new Cutbacks King!
3/
And we have a new Cutbacks King!
3/
Friday Stat Dump on Saturday: MLS leaders of various pass types.
(New: I've enhanced my chart generation with players!)
I put no stock in pass completion % which includes passes with no pressure. So let's look at chance-creating pass types.
First, the top 25(+ ties) with throughballs!
1/
(lol)
(New: I've enhanced my chart generation with players!)
I put no stock in pass completion % which includes passes with no pressure. So let's look at chance-creating pass types.
First, the top 25(+ ties) with throughballs!
1/
(lol)

November 8, 2025 at 4:44 PM
Friday Stat Dump on Saturday: MLS leaders of various pass types.
(New: I've enhanced my chart generation with players!)
I put no stock in pass completion % which includes passes with no pressure. So let's look at chance-creating pass types.
First, the top 25(+ ties) with throughballs!
1/
(lol)
(New: I've enhanced my chart generation with players!)
I put no stock in pass completion % which includes passes with no pressure. So let's look at chance-creating pass types.
First, the top 25(+ ties) with throughballs!
1/
(lol)
Tomorrow: Something new comes to Friday Stat Dump 👀
(on Saturday, again, yes)
(on Saturday, again, yes)

November 8, 2025 at 3:38 AM
Tomorrow: Something new comes to Friday Stat Dump 👀
(on Saturday, again, yes)
(on Saturday, again, yes)
I'd like to do a predictive test between big chances and Great xG goals, but...well...that test would be biased, as I've already said.
I personally like combining Great xG and Good xG totals. Here is MLS 2025 only with Great xG shots by itself and then combined with Good xG shots vs. Goals For.
5/
I personally like combining Great xG and Good xG totals. Here is MLS 2025 only with Great xG shots by itself and then combined with Good xG shots vs. Goals For.
5/


November 1, 2025 at 3:28 PM
I'd like to do a predictive test between big chances and Great xG goals, but...well...that test would be biased, as I've already said.
I personally like combining Great xG and Good xG totals. Here is MLS 2025 only with Great xG shots by itself and then combined with Good xG shots vs. Goals For.
5/
I personally like combining Great xG and Good xG totals. Here is MLS 2025 only with Great xG shots by itself and then combined with Good xG shots vs. Goals For.
5/
Great xG shots being in the range of 0.33 to 0.99 are an objective substitute for big chances. Since 2017, Great xG goals are only 1.2% higher than xG/shot. Much better than 7% and likely to improve from here.
On average, Great xG shots improve the average conversion rate by around 4x.
4/
On average, Great xG shots improve the average conversion rate by around 4x.
4/

November 1, 2025 at 3:28 PM
Great xG shots being in the range of 0.33 to 0.99 are an objective substitute for big chances. Since 2017, Great xG goals are only 1.2% higher than xG/shot. Much better than 7% and likely to improve from here.
On average, Great xG shots improve the average conversion rate by around 4x.
4/
On average, Great xG shots improve the average conversion rate by around 4x.
4/
Big chances are biased toward goals. Since 2017, in MLS the avg xG per shot is 0.07 higher on goals than saves, misses, and posts. That shows the bias.
Penalties are supposed to be big chances, but even some of them are missing the big chance flag.
This is one reason we created the xG Tiers.
3/
Penalties are supposed to be big chances, but even some of them are missing the big chance flag.
This is one reason we created the xG Tiers.
3/

November 1, 2025 at 3:28 PM
Big chances are biased toward goals. Since 2017, in MLS the avg xG per shot is 0.07 higher on goals than saves, misses, and posts. That shows the bias.
Penalties are supposed to be big chances, but even some of them are missing the big chance flag.
This is one reason we created the xG Tiers.
3/
Penalties are supposed to be big chances, but even some of them are missing the big chance flag.
This is one reason we created the xG Tiers.
3/
The average xG (ASA's xG model) of a big chance is 0.325. And that includes penalties xG.
Without penalties, it's 0.29 xG per big chance shot. Very good but not a sure thing.
But we've got a bigger problem: because big chances are subjective, they have an inherent bias. Can you spot it below?
2/
Without penalties, it's 0.29 xG per big chance shot. Very good but not a sure thing.
But we've got a bigger problem: because big chances are subjective, they have an inherent bias. Can you spot it below?
2/

November 1, 2025 at 3:28 PM
The average xG (ASA's xG model) of a big chance is 0.325. And that includes penalties xG.
Without penalties, it's 0.29 xG per big chance shot. Very good but not a sure thing.
But we've got a bigger problem: because big chances are subjective, they have an inherent bias. Can you spot it below?
2/
Without penalties, it's 0.29 xG per big chance shot. Very good but not a sure thing.
But we've got a bigger problem: because big chances are subjective, they have an inherent bias. Can you spot it below?
2/
Friday Stat Dump: Big Chances
I've been told big chances are subjective. Meaning, the analyst coding the game identifies a "big scoring chance" from their perspective. Two analysts could disagree.
Here are the big chances by MLS team in the 2025 season:
1/
I've been told big chances are subjective. Meaning, the analyst coding the game identifies a "big scoring chance" from their perspective. Two analysts could disagree.
Here are the big chances by MLS team in the 2025 season:
1/

November 1, 2025 at 3:28 PM
Friday Stat Dump: Big Chances
I've been told big chances are subjective. Meaning, the analyst coding the game identifies a "big scoring chance" from their perspective. Two analysts could disagree.
Here are the big chances by MLS team in the 2025 season:
1/
I've been told big chances are subjective. Meaning, the analyst coding the game identifies a "big scoring chance" from their perspective. Two analysts could disagree.
Here are the big chances by MLS team in the 2025 season:
1/
Now at the halfway mark of the season, 17 games in, our predictors are slightly less accurate. Interesting!
VAN, PHI, MIA, SD, and MIN are top 5. Eventual T-2, CIN, is 7th. So 4 of 5 still.
LAG, MTL, TOR, STL, and RSL are the bottom 5. Eventual bottom 5s SKC, ATL, and DCU are 6, 7 and 8.
6/
VAN, PHI, MIA, SD, and MIN are top 5. Eventual T-2, CIN, is 7th. So 4 of 5 still.
LAG, MTL, TOR, STL, and RSL are the bottom 5. Eventual bottom 5s SKC, ATL, and DCU are 6, 7 and 8.
6/
October 25, 2025 at 12:54 AM
Now at the halfway mark of the season, 17 games in, our predictors are slightly less accurate. Interesting!
VAN, PHI, MIA, SD, and MIN are top 5. Eventual T-2, CIN, is 7th. So 4 of 5 still.
LAG, MTL, TOR, STL, and RSL are the bottom 5. Eventual bottom 5s SKC, ATL, and DCU are 6, 7 and 8.
6/
VAN, PHI, MIA, SD, and MIN are top 5. Eventual T-2, CIN, is 7th. So 4 of 5 still.
LAG, MTL, TOR, STL, and RSL are the bottom 5. Eventual bottom 5s SKC, ATL, and DCU are 6, 7 and 8.
6/
At 10 games in, our predictors have learned more about each team.
VAN, PHI, CLB, MIA, and CIN are the top 5. They have predicted 4 of the final top 5.
LAG, MTL, TOR, SKC, and DCU are in the bottom 5. Only TOR will fall out (barely), and ATL is 6th lowest. That's another 4 of 5.
80%!
5/
VAN, PHI, CLB, MIA, and CIN are the top 5. They have predicted 4 of the final top 5.
LAG, MTL, TOR, SKC, and DCU are in the bottom 5. Only TOR will fall out (barely), and ATL is 6th lowest. That's another 4 of 5.
80%!
5/

October 25, 2025 at 12:54 AM
At 10 games in, our predictors have learned more about each team.
VAN, PHI, CLB, MIA, and CIN are the top 5. They have predicted 4 of the final top 5.
LAG, MTL, TOR, SKC, and DCU are in the bottom 5. Only TOR will fall out (barely), and ATL is 6th lowest. That's another 4 of 5.
80%!
5/
VAN, PHI, CLB, MIA, and CIN are the top 5. They have predicted 4 of the final top 5.
LAG, MTL, TOR, SKC, and DCU are in the bottom 5. Only TOR will fall out (barely), and ATL is 6th lowest. That's another 4 of 5.
80%!
5/
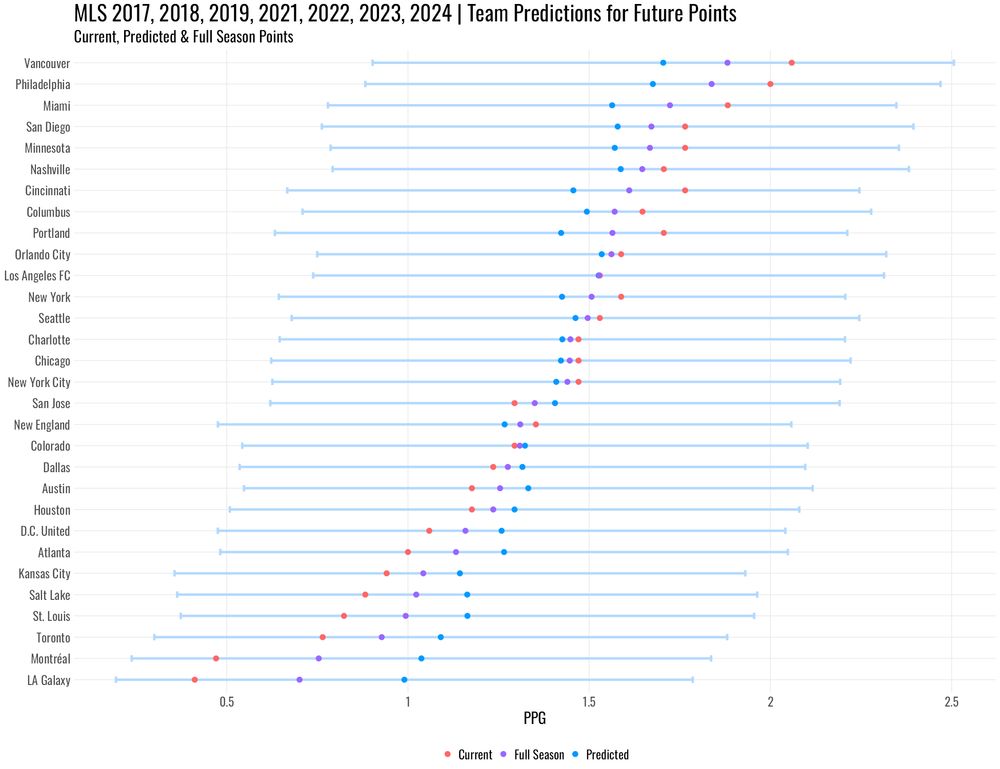
Here at 5 games in, based on 182 team seasons between 2017-2019 and 2021-2024, our predictors really liked VAN, PHI, MIA, NSH, and MIN. That's 3 of the top 5.
They didn't like MTL, TOR, SKC, LAG, and NER. 3 of the bottom 5 as well.
60% is not too bad!
Purple dot is the full season prediction.
4/
They didn't like MTL, TOR, SKC, LAG, and NER. 3 of the bottom 5 as well.
60% is not too bad!
Purple dot is the full season prediction.
4/

October 25, 2025 at 12:54 AM
Here at 5 games in, based on 182 team seasons between 2017-2019 and 2021-2024, our predictors really liked VAN, PHI, MIA, NSH, and MIN. That's 3 of the top 5.
They didn't like MTL, TOR, SKC, LAG, and NER. 3 of the bottom 5 as well.
60% is not too bad!
Purple dot is the full season prediction.
4/
They didn't like MTL, TOR, SKC, LAG, and NER. 3 of the bottom 5 as well.
60% is not too bad!
Purple dot is the full season prediction.
4/
Taking a look at the final points across the league, our top 5 are: PHI, CIN, MIA, SD, and VAN.
The bottom 5 are (reverse order from displayed): DC, MTL, SKC, ATL, and LAG.
There are a few ties in there. I'm showing as PPG for a reason you'll soon see.
2/
The bottom 5 are (reverse order from displayed): DC, MTL, SKC, ATL, and LAG.
There are a few ties in there. I'm showing as PPG for a reason you'll soon see.
2/

October 25, 2025 at 12:54 AM
Taking a look at the final points across the league, our top 5 are: PHI, CIN, MIA, SD, and VAN.
The bottom 5 are (reverse order from displayed): DC, MTL, SKC, ATL, and LAG.
There are a few ties in there. I'm showing as PPG for a reason you'll soon see.
2/
The bottom 5 are (reverse order from displayed): DC, MTL, SKC, ATL, and LAG.
There are a few ties in there. I'm showing as PPG for a reason you'll soon see.
2/
Weekly Stat Dump: Predicted Points
In the past few weeks, we have looked at xPoints, Expected Goal Differential (xGD), and g+ Offense Diff as potential predictors of points in MLS.
Keep in mind, we've already pointed out how weak predictions using R-squared are in a parity league like MLS.
1/
In the past few weeks, we have looked at xPoints, Expected Goal Differential (xGD), and g+ Offense Diff as potential predictors of points in MLS.
Keep in mind, we've already pointed out how weak predictions using R-squared are in a parity league like MLS.
1/

October 25, 2025 at 12:54 AM
Weekly Stat Dump: Predicted Points
In the past few weeks, we have looked at xPoints, Expected Goal Differential (xGD), and g+ Offense Diff as potential predictors of points in MLS.
Keep in mind, we've already pointed out how weak predictions using R-squared are in a parity league like MLS.
1/
In the past few weeks, we have looked at xPoints, Expected Goal Differential (xGD), and g+ Offense Diff as potential predictors of points in MLS.
Keep in mind, we've already pointed out how weak predictions using R-squared are in a parity league like MLS.
1/
With the help of throw-ins into the box, set piece xG was also higher than any full TAM Era season in MLS 2025.
But in 2025, progressive pass xG is over 7x higher and goals were 8x higher than set pieces.
Improve your set pieces, but progressive pass creativity is still where it's at in MLS.
/end
But in 2025, progressive pass xG is over 7x higher and goals were 8x higher than set pieces.
Improve your set pieces, but progressive pass creativity is still where it's at in MLS.
/end

October 21, 2025 at 3:20 PM
With the help of throw-ins into the box, set piece xG was also higher than any full TAM Era season in MLS 2025.
But in 2025, progressive pass xG is over 7x higher and goals were 8x higher than set pieces.
Improve your set pieces, but progressive pass creativity is still where it's at in MLS.
/end
But in 2025, progressive pass xG is over 7x higher and goals were 8x higher than set pieces.
Improve your set pieces, but progressive pass creativity is still where it's at in MLS.
/end
Short 🧵: One of the reasons I liked what @carloncarpenter.bsky.social and I wrote about with Where Goals Come From is its emphasis on the importance of chances from progressive passes.
For me, these types of goals are the best in the sport and, outside the unexpected banger, the most exciting.
1/
For me, these types of goals are the best in the sport and, outside the unexpected banger, the most exciting.
1/

October 21, 2025 at 3:20 PM
Short 🧵: One of the reasons I liked what @carloncarpenter.bsky.social and I wrote about with Where Goals Come From is its emphasis on the importance of chances from progressive passes.
For me, these types of goals are the best in the sport and, outside the unexpected banger, the most exciting.
1/
For me, these types of goals are the best in the sport and, outside the unexpected banger, the most exciting.
1/
But the actual strongest correlation with g+ Offense Diff in the MLS TAM Era is g+ Shooting. That might be surprising even to g+ fans.
That's where Philly, Nashville, and, of course, Inter Miami shine, with Vancouver showing just how well-rounded they are.
6/
That's where Philly, Nashville, and, of course, Inter Miami shine, with Vancouver showing just how well-rounded they are.
6/

October 18, 2025 at 2:26 PM
But the actual strongest correlation with g+ Offense Diff in the MLS TAM Era is g+ Shooting. That might be surprising even to g+ fans.
That's where Philly, Nashville, and, of course, Inter Miami shine, with Vancouver showing just how well-rounded they are.
6/
That's where Philly, Nashville, and, of course, Inter Miami shine, with Vancouver showing just how well-rounded they are.
6/