


James Mulqueeney
@jamesmulqueeney.bsky.social
Research fellow at the Smithsonian National Museum of Natural History. Former PhD student at University of Southampton and Natural History Museum, London.
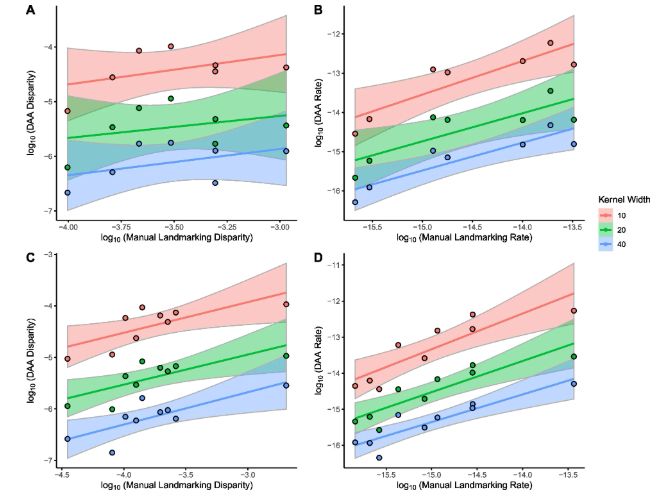
Finally, we compare the downstream estimates of morphological disparity, evolutionary rates and phylogenetic signal. Here, we find significant correlations between methods for almost all metrics.
April 27, 2025 at 12:15 PM
Finally, we compare the downstream estimates of morphological disparity, evolutionary rates and phylogenetic signal. Here, we find significant correlations between methods for almost all metrics.
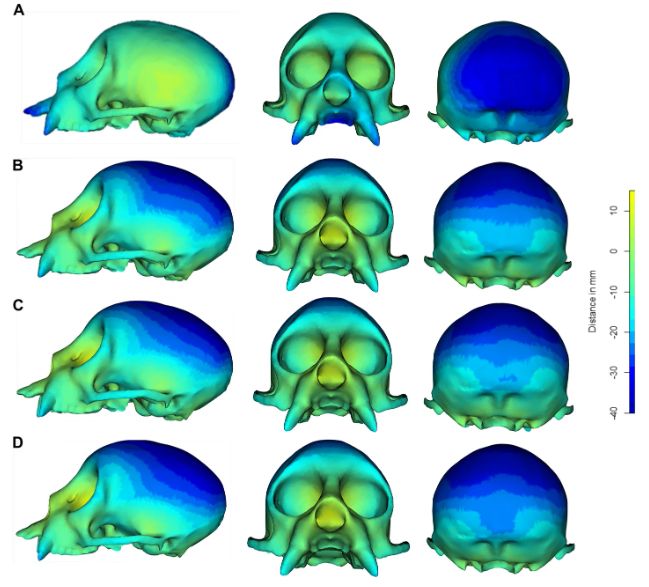
We then compare heatmaps of how shape is measured using each method. To do this we compare the shape of different crania with estimated mean shapes of each analysis (landmark top, DAA below). Here is shown for the specimen, Cacajao calvus.
April 27, 2025 at 12:14 PM
We then compare heatmaps of how shape is measured using each method. To do this we compare the shape of different crania with estimated mean shapes of each analysis (landmark top, DAA below). Here is shown for the specimen, Cacajao calvus.
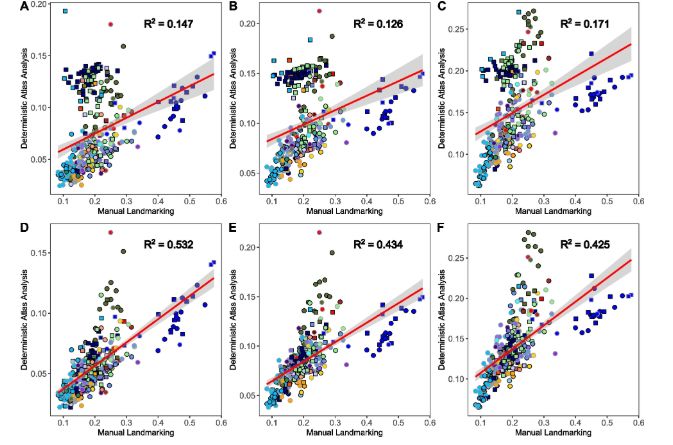
We then compare the correlation between the two methods using Euclidean distances, the Mantel test and the Procrustean randomisation test. We find the methods correlate and that using Poisson meshes significantly improves the correlation between methods.
April 27, 2025 at 12:13 PM
We then compare the correlation between the two methods using Euclidean distances, the Mantel test and the Procrustean randomisation test. We find the methods correlate and that using Poisson meshes significantly improves the correlation between methods.
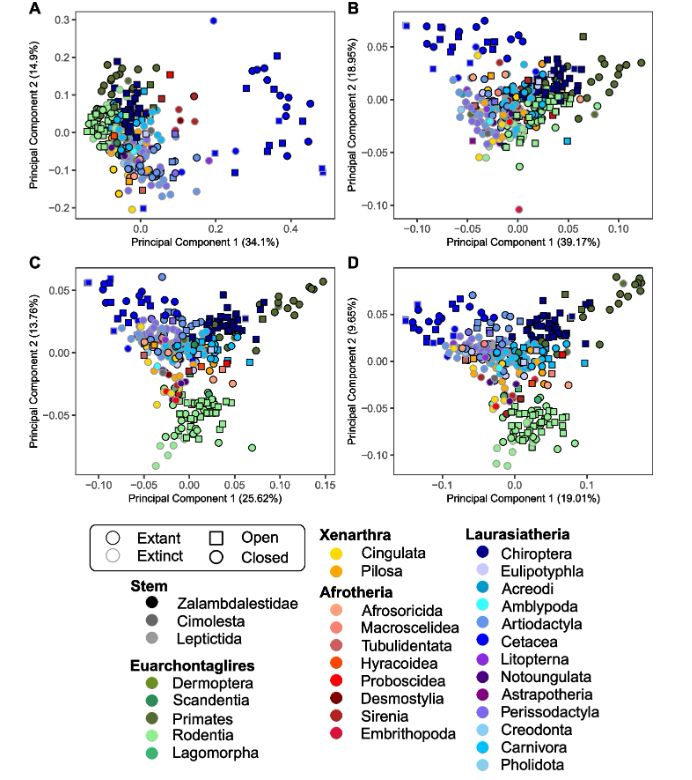
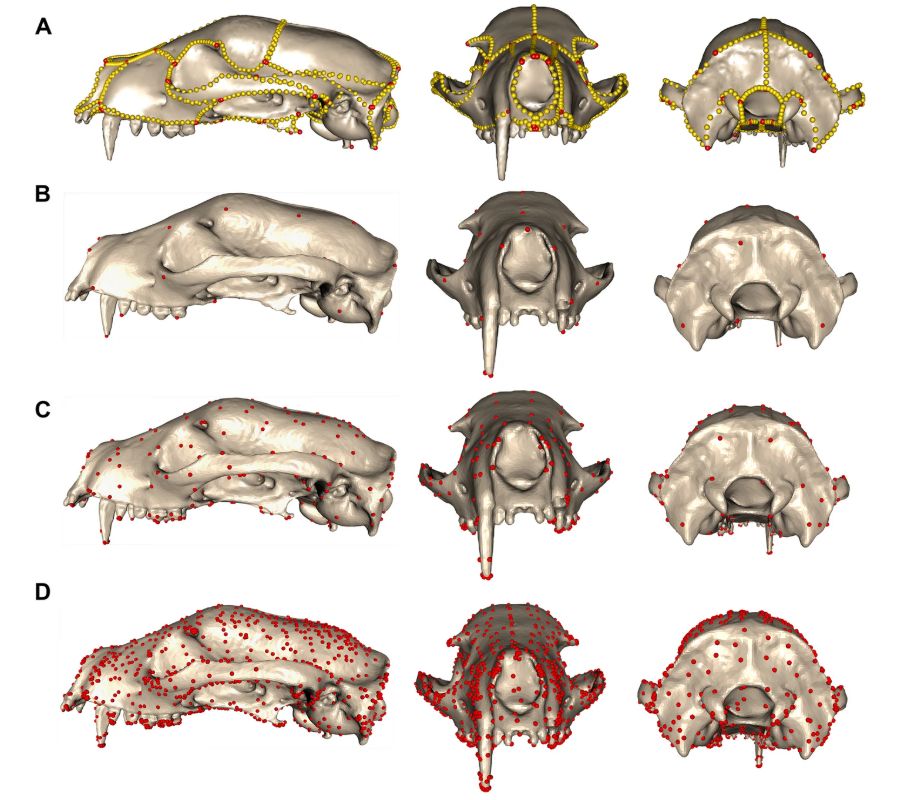
We then visually compare the results of the manual landmarking analysis (754 landmarks and semilandmarks; top left) with the landmark-free approach using 45, 270 and 1,782 control points (top right to bottom left). We notice differences mainly for Cetacea and Primates.
April 27, 2025 at 12:12 PM
We then visually compare the results of the manual landmarking analysis (754 landmarks and semilandmarks; top left) with the landmark-free approach using 45, 270 and 1,782 control points (top right to bottom left). We notice differences mainly for Cetacea and Primates.
Once overcoming modality issues, we apply the method to 322 placental mammal crania as seen in Goswami et al. 2022 (science.org/doi/full/10....). Here, we apply and test a range of kernel widths, which changes the number of control points used to compare shape (replacing landmarks).
April 27, 2025 at 12:11 PM
Once overcoming modality issues, we apply the method to 322 placental mammal crania as seen in Goswami et al. 2022 (science.org/doi/full/10....). Here, we apply and test a range of kernel widths, which changes the number of control points used to compare shape (replacing landmarks).
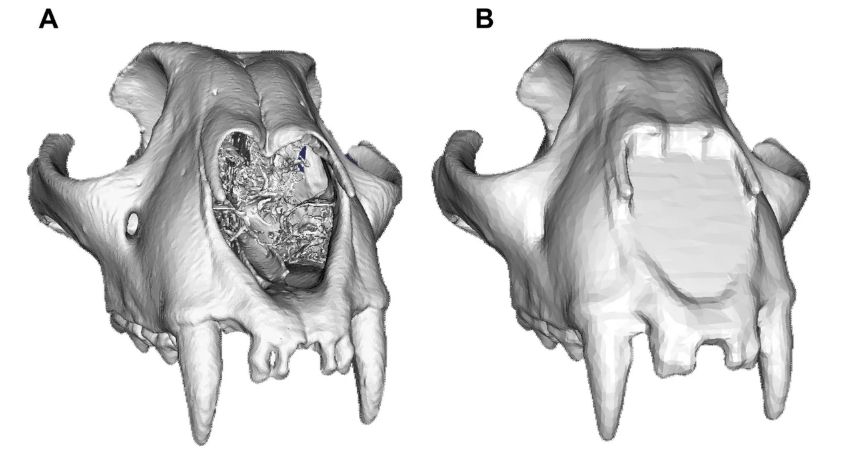
We focus on comparing an implementation of Large Deformation Diffeomorphic Metric Mapping (LDDMM) called a Deterministic Atlas Analysis (DAA) with manual landmarking techniques. We first notice that data modality affects the results, which we overcome by making Poisson meshes.
April 27, 2025 at 12:08 PM
We focus on comparing an implementation of Large Deformation Diffeomorphic Metric Mapping (LDDMM) called a Deterministic Atlas Analysis (DAA) with manual landmarking techniques. We first notice that data modality affects the results, which we overcome by making Poisson meshes.