


Jack Davison
@jack-davison.bsky.social
👋 senior consultant, environmental data analyst, #rstats developer
🔗 personal website: https://jack-davison.github.io/
🔗 personal website: https://jack-davison.github.io/
Looks great - though the dark green on light grey used for the roxygen2-style comments is really hard to read, which is a shame as that stuff is really vital to plumber2!

October 6, 2025 at 12:05 PM
Looks great - though the dark green on light grey used for the roxygen2-style comments is really hard to read, which is a shame as that stuff is really vital to plumber2!
Finally (for now!) number three is 2024/46 (iso codes). This was a quick one - just uses #ObservablePlot tree mark to create a flowchart of the three-letter iso codes. I think I'm now one week behind, so will hopefully turn my attention to 2024/47 (Bob's Burgers!) next!

November 24, 2024 at 9:56 PM
Finally (for now!) number three is 2024/46 (iso codes). This was a quick one - just uses #ObservablePlot tree mark to create a flowchart of the three-letter iso codes. I think I'm now one week behind, so will hopefully turn my attention to 2024/47 (Bob's Burgers!) next!
Number two is 2024/45 (democracy & dictatorship) - change the slider to see countries adopt (or abandon) democracy. This required using #leaflet in JavaScript, which I'd never done before (although I have experience with the #rstats wrapper). Also a lot of nested data/JSONs to create & filter.

November 24, 2024 at 9:56 PM
The first dashboard was 2024/44 (monster movies). Using #ObservablePlot and #arquero JS to filter data on the fly and compare data for different genres of monster movie. I've played around with both in #quarto before, so this was familiar territory.

November 24, 2024 at 9:56 PM
The first dashboard was 2024/44 (monster movies). Using #ObservablePlot and #arquero JS to filter data on the fly and compare data for different genres of monster movie. I've played around with both in #quarto before, so this was familiar territory.
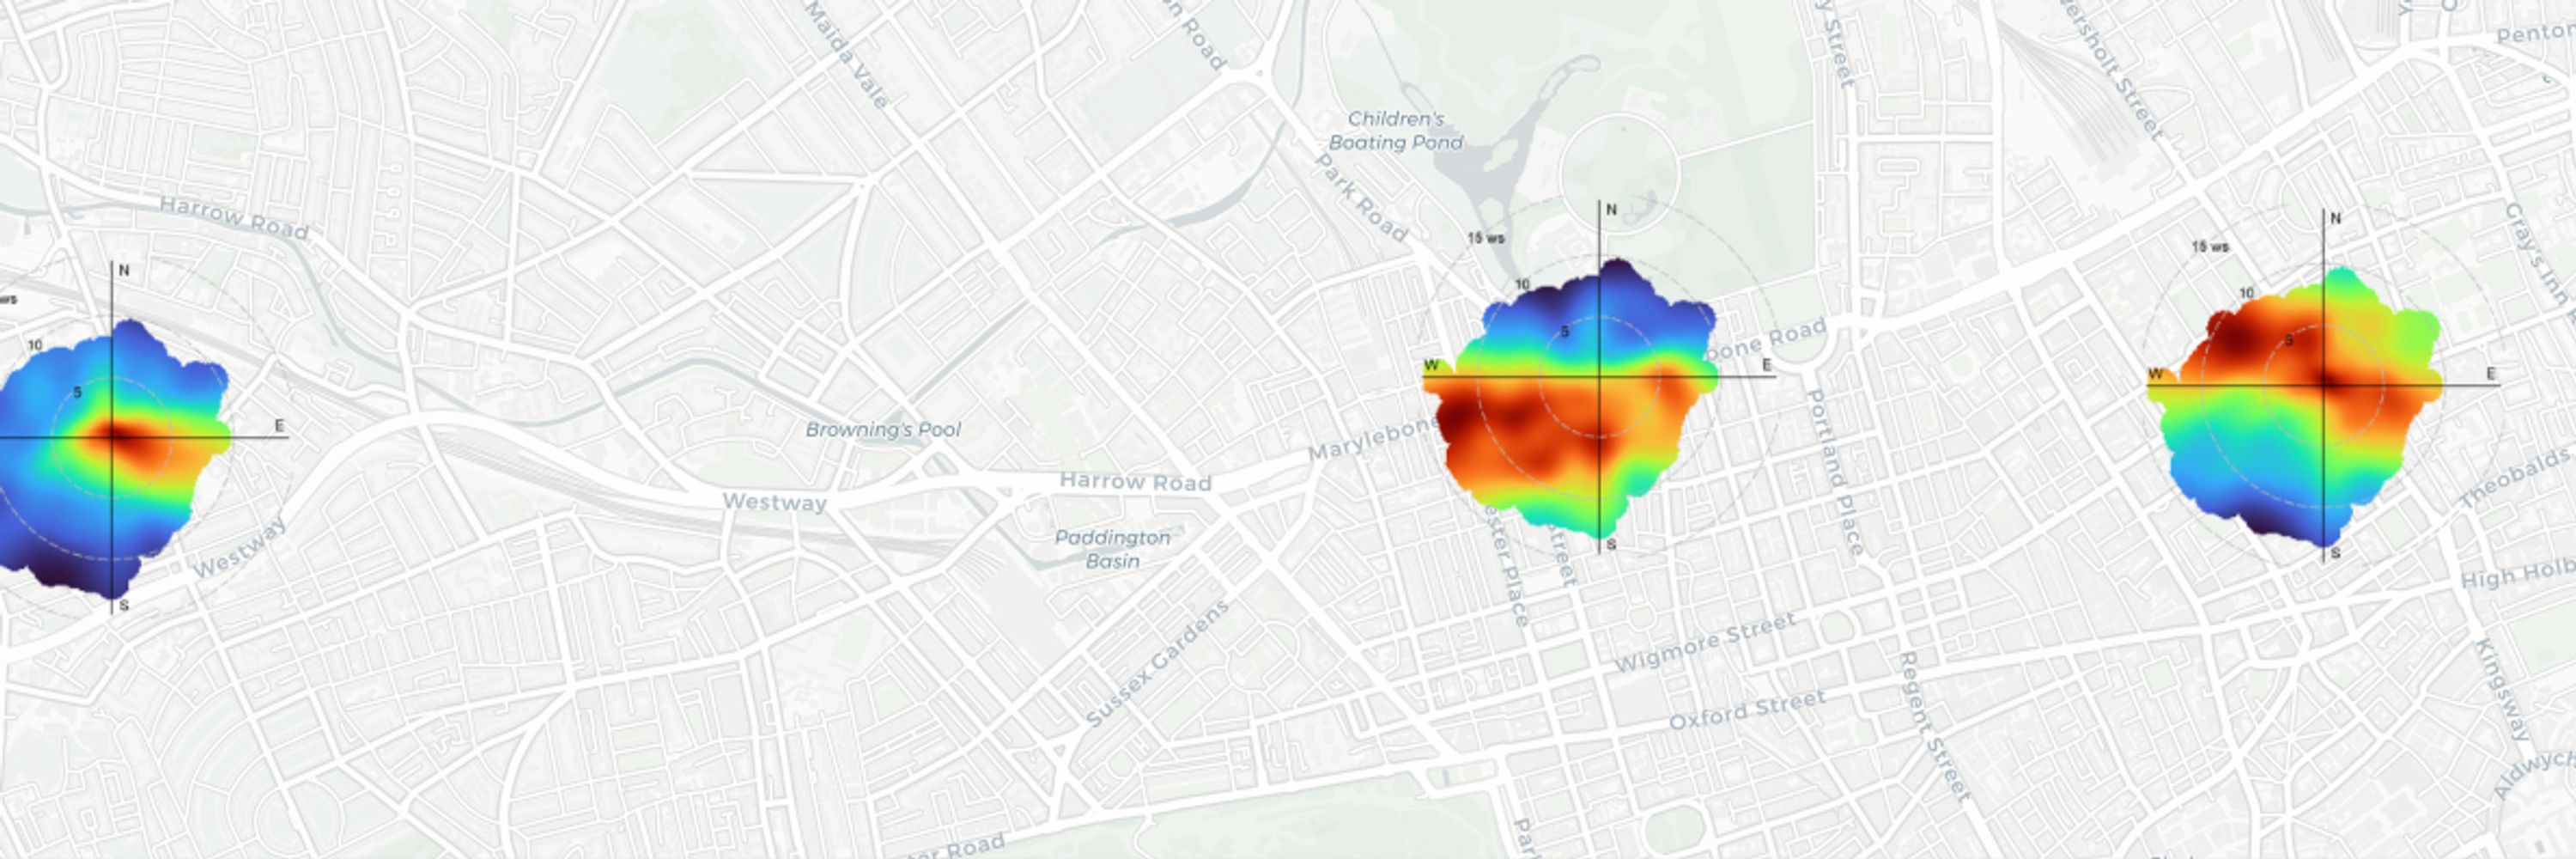
Just released v 0.9.1 of our #rstats 📦 {openairmaps}, which combines #openair with #leaflet for dynamic #airquality mapping. Lots of fixes, but main feature is allowing for "pairwise" stats in `polarMap()`. Read more about pairwise bivariate polar surfaces: bookdown.org/david_carsla...

November 19, 2024 at 1:05 PM
Just released v 0.9.1 of our #rstats 📦 {openairmaps}, which combines #openair with #leaflet for dynamic #airquality mapping. Lots of fixes, but main feature is allowing for "pairwise" stats in `polarMap()`. Read more about pairwise bivariate polar surfaces: bookdown.org/david_carsla...
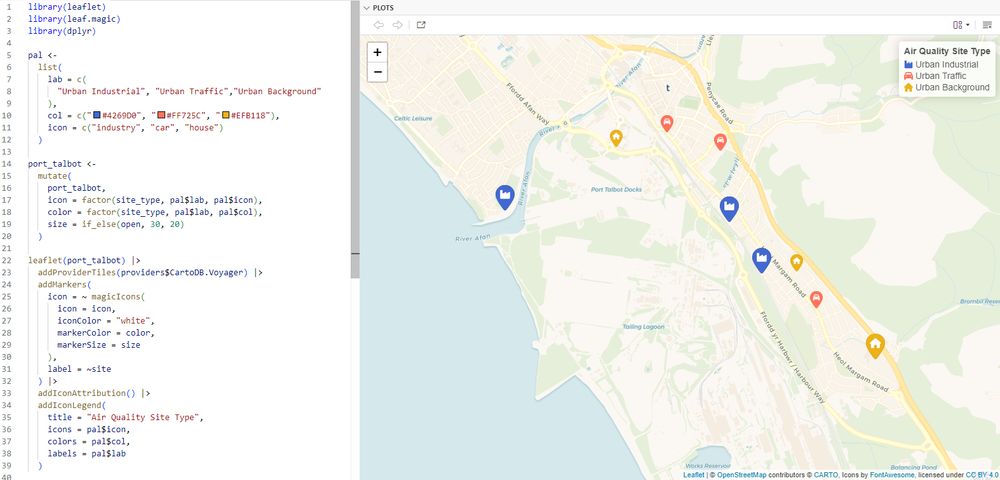
I wrote something #rstats a few months ago and never really plugged it. I love #leaflet, but awesomeMarkers is v limited - instead `leaf.magic::magicIcons` uses {magick} to construct icons on the fly. Totally customisable sizes/icons/colours/shapes. See more at: github.com/jack-davison...
November 15, 2024 at 10:10 AM
I wrote something #rstats a few months ago and never really plugged it. I love #leaflet, but awesomeMarkers is v limited - instead `leaf.magic::magicIcons` uses {magick} to construct icons on the fly. Totally customisable sizes/icons/colours/shapes. See more at: github.com/jack-davison...