


IneqComps
@ineqcomps.bsky.social
This account (by @goetzkluge.bsky.social) mainly is about inequality measures. A special focus is on the symmetrized Theil-T redundancy.


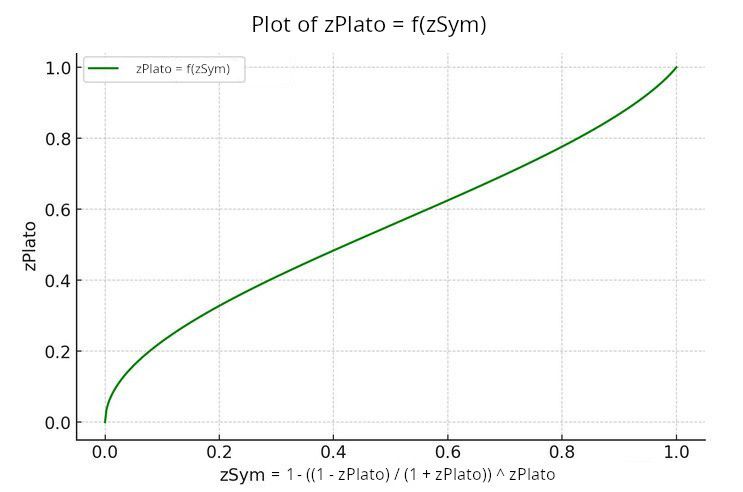
With zPlato you get an inequality measure which behaves quite similar to the Gini index. However, zPlato is much more sensitive to small groups of very poor people. That's not "woke" as it reflects a real risk: Already today's techologies provide horrible weapons to single frustrated individuals.
![zSym = 1 - exp(-rSym)
--------------------------
(log is the logarithm with the base e, the natural logarithm.)
Theil_T[(a,b)] + Theil_T[(b,a)]
= a * log (a / b) / aTotal + b * log (b / a) / bTotal
= a * (log a - log b) / aTotal + b * (log b - log a) / bTotal
= a * log a / aTotal - a * log b / aTotal + b * log b / bTotal - b * log a / bTotal
= log a * (a / aTotal - b / bTotal) - log b * (a / aTotal - b / bTotal)
= (log a - log b) * (a / aTotal - b / bTotal)
= log (a / b) * (a / aTotal - b / bTotal)
Theil_sym = rSym = 1/2 * sum( log (a / b) * (a / aTotal - b / bTotal))
Theil_sym = rSym = 1/2 * sum(abs(log (a / b) - k)**(σ=1) * abs(a / aTotal - b / bTotal))
k = log (aTotal / bTotal)
σ is a parameter which controls how "entropic" the indicator is. Default is σ = 1.
If σ = 0, the symmetrized Theil redundancy turns into the Hoover index ("Robin Hood index").
-----------------------------
Keywords: Theil index, Theil redundancy, Theil-T, Theil_sym, Theil_symCDF, inequality, inequity, entropy measures, inequality measures, inequality indicators, Gini index, Gini coefficient, Gini replacement, symmetric Theil redundancy, zSys, rSys, IneqComps](https://cdn.bsky.app/img/feed_thumbnail/plain/did:plc:mxbe4sjpwj7pk547n2w3aiki/bafkreic7dmimzwwqtlkjgsni2v56okplyggrnp473hmlhrncpmv6xvcg4e@jpeg)

September 9, 2025 at 11:08 AM
With zPlato you get an inequality measure which behaves quite similar to the Gini index. However, zPlato is much more sensitive to small groups of very poor people. That's not "woke" as it reflects a real risk: Already today's techologies provide horrible weapons to single frustrated individuals.
I just found a "The Plato Index", a measure of tax progressivity devised by Valpy FitzGerald, Oxford University and presented in 2006.
www.taxjustice.net/cms/upload/p...
I devised my Platon Inequality in 2004.
Valpy FitzGerald and I probably both think that Plato was a wise man.
www.taxjustice.net/cms/upload/p...
I devised my Platon Inequality in 2004.
Valpy FitzGerald and I probably both think that Plato was a wise man.

August 11, 2025 at 7:32 PM
I just found a "The Plato Index", a measure of tax progressivity devised by Valpy FitzGerald, Oxford University and presented in 2006.
www.taxjustice.net/cms/upload/p...
I devised my Platon Inequality in 2004.
Valpy FitzGerald and I probably both think that Plato was a wise man.
www.taxjustice.net/cms/upload/p...
I devised my Platon Inequality in 2004.
Valpy FitzGerald and I probably both think that Plato was a wise man.
August 6, 2025 at 3:46 AM
Next: The GOP will let Trump force the FED to hide the statistics of wealth distribution (like DFA: Distributional Financial Accounts, www.federalreserve.gov/releases/z1/...) in the U.S. provided since 1989.
#inequality #wealth #wealthdistribution #FED #JeromePowell #Powell
#inequality #wealth #wealthdistribution #FED #JeromePowell #Powell
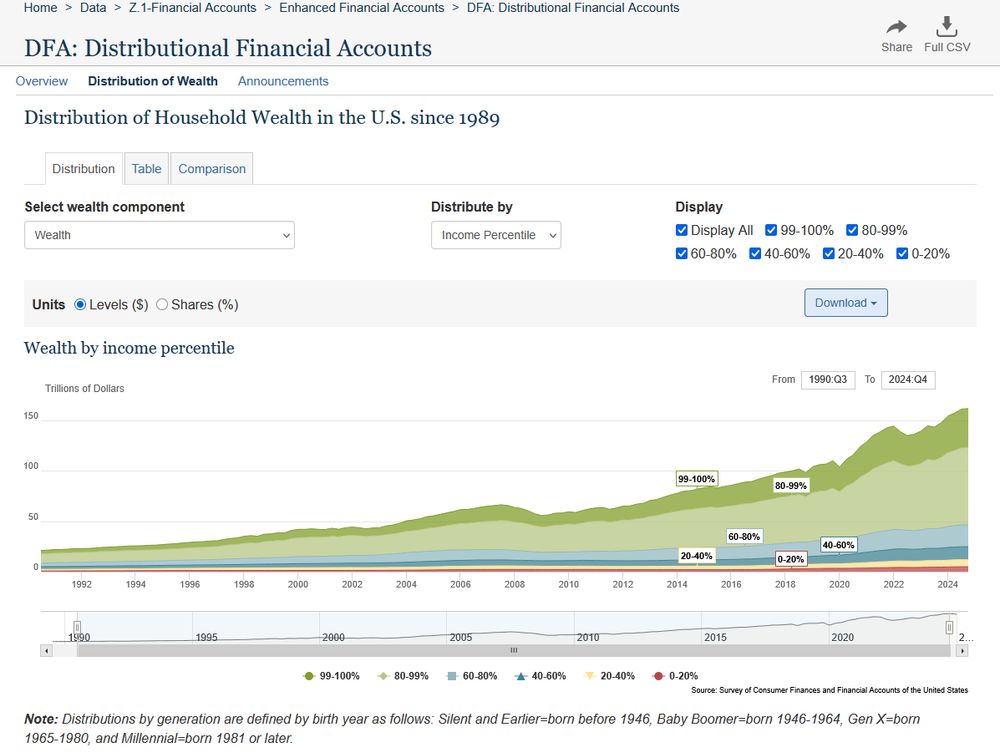
August 5, 2025 at 2:14 PM
Next: The GOP will let Trump force the FED to hide the statistics of wealth distribution (like DFA: Distributional Financial Accounts, www.federalreserve.gov/releases/z1/...) in the U.S. provided since 1989.
#inequality #wealth #wealthdistribution #FED #JeromePowell #Powell
#inequality #wealth #wealthdistribution #FED #JeromePowell #Powell
Yoram Amiel, “Thinking about Inequality”, 2011
![What is inequality? In recent years [before 2011] there has been an explosion of interest in the subject that has yielded a substantial body of formal tools and results for income-distribution analysis. But does the standard axiomatic structure coincide with public perceptions of inequality? Or is the economist's concept of inequality a thing apart, perpetuated through serial brainwashing in the way the subject is studied and taught? Amiel and Cowell examine the evidence from a large international questionnaire experiment using student respondents. Along with basic "cake-sharing" issues, related questions involving social-welfare rankings, the relationship between inequality and overall income growth and the meaning of poverty comparisons are considered.](https://cdn.bsky.app/img/feed_thumbnail/plain/did:plc:mxbe4sjpwj7pk547n2w3aiki/bafkreiatvn73mxem6rmyikekjzh4k3fott5iiraszejdmxl42dnbaumj6a@jpeg)
July 23, 2025 at 8:32 PM
Yoram Amiel, “Thinking about Inequality”, 2011
I think e.g. assemblies with extremely poor groups (with almost no resources) deserve extremely high inequality measures. The Gini coefficient fails to indicate the risks caused by small but furious groups.

July 21, 2025 at 9:53 PM
I think e.g. assemblies with extremely poor groups (with almost no resources) deserve extremely high inequality measures. The Gini coefficient fails to indicate the risks caused by small but furious groups.
![https://www.jstor.org/stable/43965822
J-divergence measurements of economic inequality
Nicholas Rohde
Journal of the Royal Statistical Society. Series A (Statistics in Society)
Vol. 179, No. 3 (JUNE 2016), pp. 847-870 (24 pages)
Published By: Oxford University Press
--------------------------------------------------
J. R. Statist. Soc. A (2016)
179, Part 3, pp. 847-870
J-divergence measurements of economic inequality
Nicholas Rohde
Griffith University, Gold Coast, Australia
[Received January 2014. Final revision September 2015]
Summary. The paper uses a symmetric entropy statistic to study income inequality. The index distrition in into mairarion reto ace disay men, and then rant tom original. This alowe
the measure to be interpreted as an average of n income-to-mean divergences such that the inequality estimate can be broken down into contributions across population subgroups. Various properties of the index are analysed and an application comparing the USA, Germany and Britain is provided. We focus on the sensitivity of inequality to the tails of the income distribution and show that the extreme right-hand tail accounts for a large and generally increasing proportion of total inequality. This result holds even if incomes are measured at the household level, averaged over a 5-year period and taken after government taxes and transfers.
Keywords: Distance; Divergence; Inequality; Information theory](https://cdn.bsky.app/img/feed_thumbnail/plain/did:plc:mxbe4sjpwj7pk547n2w3aiki/bafkreiadmctzslltbun4nwwmablwudznjc6gnk362a5ntd3zsry3rke2se@jpeg)
Support to the Gini index.

July 21, 2025 at 9:33 AM
Support to the Gini index.
I ❤️ the Wayback Machine: web.archive.org/web/20070610...

July 19, 2025 at 6:10 AM
I ❤️ the Wayback Machine: web.archive.org/web/20070610...
IneqComps is the name of a program which I originally wrote just as an exercise in Haskell. The program computes inequality measures used as indicators for the inequality of resource distributions. The measures are symmetric, therefore they also are about the distribution of people to resources.

July 15, 2025 at 5:36 PM
IneqComps is the name of a program which I originally wrote just as an exercise in Haskell. The program computes inequality measures used as indicators for the inequality of resource distributions. The measures are symmetric, therefore they also are about the distribution of people to resources.
From:
'Derivation of Theil’s Inequality Measure from Lorenz Curves'
Nicholas Rohde
School of Economics
The University of Queensland
Brisbane, Australia
March, 2007
Links in ALT-Text
'Derivation of Theil’s Inequality Measure from Lorenz Curves'
Nicholas Rohde
School of Economics
The University of Queensland
Brisbane, Australia
March, 2007
Links in ALT-Text
![See also: https://bsky.app/profile/ineqcomps.bsky.social/post/3ltzbrfpezs2z
-------------------------------------------------------------------
From: https://www.diw.de/sixcms/detail.php?id=57489
'Derivation of Theil’s Inequality Measure from Lorenz Curves'
Nicholas Rohde
School of Economics
The University of Queensland
Brisbane, Australia
March, 2007
If income data is given in the form of population shares and corresponding income shares, Theil’s T measure is easily calculated using the formula
(1) T=Σ(i=1 until n)[p_i*ln(p_i/q_i)]
The statistic uses the expected information content of the income distribution to measure the level of inequality. Theil’s measure may also be expressed as
(2) Y=ln(n)-S
where S is the Shannon entropy or information content of the distribution, which has a range from 0 to ln(n). Shannon entropy may be calculated for individual incomes or n income shares. For j individual incomes the information content may be calculated as
(3) S=Σ(k until j)[p_k*ln(1/p_k)]
where p_k is the income share of the kth individual.
p_i is the income share of group i
q_i is the population share of group i](https://cdn.bsky.app/img/feed_thumbnail/plain/did:plc:mxbe4sjpwj7pk547n2w3aiki/bafkreih2rzw23x56g5aj2swm4gctbz5emc5wzoood45ke2wakkyztsheby@jpeg)
July 15, 2025 at 4:43 PM
From:
'Derivation of Theil’s Inequality Measure from Lorenz Curves'
Nicholas Rohde
School of Economics
The University of Queensland
Brisbane, Australia
March, 2007
Links in ALT-Text
'Derivation of Theil’s Inequality Measure from Lorenz Curves'
Nicholas Rohde
School of Economics
The University of Queensland
Brisbane, Australia
March, 2007
Links in ALT-Text
![https://www.diw.de/sixcms/detail.php?id=57489
Derivation of Theil’s Inequality Measure from Lorenz Curves
Nicholas Rohde
School of Economics
The University of Queensland
Brisbane, Australia
March, 2007
Abstract
Theil’s T inequality measure is a commonly used tool for inequality measurement as it satisfies important axiomatic requirements such as the principle of transfers and decomposability. Derived from the concept of information theory, Theil’s measure represents a special case of the Generalised Entropy (GE) type measure. The main objective of this paper is to establish a relationship between Theil’s inequality measure and the Lorenz curve, thus providing a useful link between these two popular tools for studying inequality. The result established in this paper also provides a basis for studying generalised entropy measures for inequality measurement using Lorenz curves. Analytical expressions for Theil’s information theoretic measures are derived for three popular specifications of Lorenz curves [used to compute the Gini index]. Empirical estimates of Theil’s measures for these Lorenz curves are also presented for a number of cases.
JEL Classification: C10, D63, I32
Key words: Theil’s T statistic, Lorenz curves, inequality measurement
Acknowledgements: I would like to thank Prasada Rao for his assistance in writing this article.](https://cdn.bsky.app/img/feed_thumbnail/plain/did:plc:mxbe4sjpwj7pk547n2w3aiki/bafkreichb7yqlwklgkvrm76mc3etecsr3hpiwp4ctypgzomhiycb4rhwce@jpeg)
July 15, 2025 at 4:04 PM
I am experimenting with an inequality measure which could help to find an optimum (minimum of the blue curves or maximum of their negative values -rAccept and zAccept) for the inequality resource flow distribution (e.g. income distribution).
![T = rSym = (Theil_T[(a,b)] + Theil_T[(b,a)]) / 2
H = zHoover = Hoover inequality ("Robin Hood index")
Software (source code in Haskell: TheilHooverPlatoGini.hs) to compute theses measures:
in https://drive.proton.me/urls/FBYNTG45P4#RafOE8CV1KPf](https://cdn.bsky.app/img/feed_thumbnail/plain/did:plc:mxbe4sjpwj7pk547n2w3aiki/bafkreib6ykqn7736b33jbt3bigyik5mpzopvmpcmlaexjym4np7g2ygfxm@jpeg)
July 15, 2025 at 10:46 AM
I am experimenting with an inequality measure which could help to find an optimum (minimum of the blue curves or maximum of their negative values -rAccept and zAccept) for the inequality resource flow distribution (e.g. income distribution).
White Evangelicals seem to be quite flexible.
How they changed their views until 2016.
(Source: Public Religion Research Institute
Credit: Danielle Kurtzleben/NPR)
How they changed their views until 2016.
(Source: Public Religion Research Institute
Credit: Danielle Kurtzleben/NPR)

July 15, 2025 at 10:18 AM
White Evangelicals seem to be quite flexible.
How they changed their views until 2016.
(Source: Public Religion Research Institute
Credit: Danielle Kurtzleben/NPR)
How they changed their views until 2016.
(Source: Public Religion Research Institute
Credit: Danielle Kurtzleben/NPR)
Those AI generated images...
Tot by AI:
Tot by AI:
July 14, 2025 at 3:59 PM
Those AI generated images...
Tot by AI:
Tot by AI:
"Income Equality in The Nordic Countries: Myths, Facts, and Lessons"
Magne Mogstad, Kjell G. Salvanes, and Gaute Torsvik
NBER Working Paper No. 33444
February 2025
JEL No. J3, J5, O0
www.nber.org/system/files...
Magne Mogstad, Kjell G. Salvanes, and Gaute Torsvik
NBER Working Paper No. 33444
February 2025
JEL No. J3, J5, O0
www.nber.org/system/files...

July 14, 2025 at 3:35 PM
"Income Equality in The Nordic Countries: Myths, Facts, and Lessons"
Magne Mogstad, Kjell G. Salvanes, and Gaute Torsvik
NBER Working Paper No. 33444
February 2025
JEL No. J3, J5, O0
www.nber.org/system/files...
Magne Mogstad, Kjell G. Salvanes, and Gaute Torsvik
NBER Working Paper No. 33444
February 2025
JEL No. J3, J5, O0
www.nber.org/system/files...
Two experimental inequality measures:
- zPlato
- rAccept and zAccept
The acceptance measure surely is disputable.
#ResearchProposal #TheilIndex #TheilRedundancy #HooverInequality #HooverIndex #RobinHoodIndex #Gini #GiniIndex #GiniCoefficient #PlatoInequality #inequality
See also ALT-text
- zPlato
- rAccept and zAccept
The acceptance measure surely is disputable.
#ResearchProposal #TheilIndex #TheilRedundancy #HooverInequality #HooverIndex #RobinHoodIndex #Gini #GiniIndex #GiniCoefficient #PlatoInequality #inequality
See also ALT-text
![T = rSym = (Theil_T[(a,b)] + Theil_T[(a,b)]) / 2
H = zHoover = Hoover inequality ("Robin Hood index")
Software to compute theses measures:
in https://drive.proton.me/urls/FBYNTG45P4#RafOE8CV1KPf
The original source: TheilHooverPlatoGini.hs (Haskell code).
I additionally generated TheilHooverPlatoGini.py and TheilHooverPlatoGini.lua using ChatGPT.](https://cdn.bsky.app/img/feed_thumbnail/plain/did:plc:mxbe4sjpwj7pk547n2w3aiki/bafkreicoratowddgdcam3uhyh3nqxeydoa5nk4owe5tnf4n4xy2e6girse@jpeg)

July 13, 2025 at 7:39 PM
Two experimental inequality measures:
- zPlato
- rAccept and zAccept
The acceptance measure surely is disputable.
#ResearchProposal #TheilIndex #TheilRedundancy #HooverInequality #HooverIndex #RobinHoodIndex #Gini #GiniIndex #GiniCoefficient #PlatoInequality #inequality
See also ALT-text
- zPlato
- rAccept and zAccept
The acceptance measure surely is disputable.
#ResearchProposal #TheilIndex #TheilRedundancy #HooverInequality #HooverIndex #RobinHoodIndex #Gini #GiniIndex #GiniCoefficient #PlatoInequality #inequality
See also ALT-text
The Theil-T inequality can give you an idea about peoples' desire to redistribute resources. It's inversion can give you an idea about peoples' desire to redistribute themselves to resources, e.g. to move from poor environments to rich environments.
Both happens.
Both happens.
![> --(Save this Haskell file with a .lhs extension.)
> type Percentile = (Double, Double)
> type AllPercentiles = [Percentile]
> type Theil = Double
> type ASum = Double
> type BSum = Double
That described what kind of numbers are used in the code (starting with ">") used below.
Now let's talk about redistribution:
For redistribution of resources, you can redistribute resources to people, but also people to resources.
Below is a Haskell function that computes the symmetrized Theil redundancy.
> theilSym :: AllPercentiles -> Theil
> theilSym allPercentiles = 0.5 * sum [log (a / b) * ((a / (aTotal allPercentiles)) - (b / (bTotal allPercentiles))) | (a, b) <- allPercentiles]
The expression log (a / b) * ((a / (aTotal allPercentiles)) - (b / (bTotal allPercentiles)))
is equal to a * log (a / b) / (aTotal allPercentiles) + b * log (b / a) / (bTotal allPercentiles)
That function is fed with a table allPercentiles [(a,b)], where a in each group (a,b)
usually stands for the group resource (e.g income, wealth etc. of the group)
and b in each group (a,b) usually stands for the group size (e.g. amount of people in the group).
The original Theil_T:
> theilTmobileResources :: AllPercentiles -> Theil
> theilTmobileResources allPercentiles =
> log ((bTotal allPercentiles)/(aTotal allPercentiles)) -- max entropy
> - sum [ a * log (b / a) | (a, b) <- allPercentiles] / (aTotal allPercentiles) -- observed entropy
The original Theil_T inverted:
> theilTmobilePeople :: AllPercentiles -> Theil
> theilTmobilePeople allPercentiles =
> log ((aTotal allPercentiles)/(bTotal allPercentiles)) -- max entropy
> - sum [ b * log (a / b) | (a, b) <- allPercentiles] / (bTotal allPercentiles) -- observed entropy
Helper functions:
> aTotal :: AllPercentiles -> ASum
> aTotal allPercentiles = sum [a | (a, _) <- allPercentiles]
> bTotal :: AllPercentiles -> BSum
> bTotal allPercentiles = sum [b | (_, b) <- allPercentiles]](https://cdn.bsky.app/img/feed_thumbnail/plain/did:plc:mxbe4sjpwj7pk547n2w3aiki/bafkreickb5gxex2fi6nfo6zyvpbal6je4mnqmjvwj7ncjw5hlev7324dwe@jpeg)
![Let's do something with that code:
> main :: IO ()
> main = do
> let percentiles = [(50000,25),(40000,475),(9000,270),(1000,230)]
> print $ "A: Theil Sym: " ++ show (theilSym percentiles)
> print $ "B: Theil T, mobile resources: " ++ show (theilTmobileResources percentiles)
> print $ "C: Theil T, mobile people: " ++ show (theilTmobilePeople percentiles)
> print $ "D: Average of B and C: " ++ show (((theilTmobilePeople percentiles) + (theilTmobileResources percentiles))/2)
Result
.\redistribution.exe
"A: Theil Sym: 1.161710269336159"
"B: Theil T, mobile resources: 1.2988959858669098"
"C: Theil T, mobile people: 1.0245245528054077"
"D: Average of B and C: 1.1617102693361587"](https://cdn.bsky.app/img/feed_thumbnail/plain/did:plc:mxbe4sjpwj7pk547n2w3aiki/bafkreidwgtjfnowdf7ftcds6hivwjb64pmb6ut6kth4lfhgulej27cnhe4@jpeg)
July 12, 2025 at 5:10 PM
The Theil-T inequality can give you an idea about peoples' desire to redistribute resources. It's inversion can give you an idea about peoples' desire to redistribute themselves to resources, e.g. to move from poor environments to rich environments.
Both happens.
Both happens.
About the Theil-T inequality and its inversion:
![I forgot the logarithms of the sums of a and of b in the formulas
for the Theil_T. They represent a maximum entropy in those terms.
redundancy
= maximum entropy - observed entropy
Theil_T[(a,b)]
= ln(bTotal/aTotal) - sum(a*ln(b/a))/aTotal
Theil_T[(b,a)]
= ln(aTotal/bTotal) - sum(b*ln(a/b))/bTotal
Luckily, if you add the formulas, then the forgotten part disappears:
ln(aTotal/bTotal) + ln(bTotal/aTotal) = 0](https://cdn.bsky.app/img/feed_thumbnail/plain/did:plc:mxbe4sjpwj7pk547n2w3aiki/bafkreickwmm5mwpexe7wvehlr7qj3vzsiok5kapmjstk6dyplfdquiavqu@jpeg)
July 12, 2025 at 4:36 PM
About the Theil-T inequality and its inversion:
Income in the United States: 2023
Current Population Reports
Issued September 2024
P60-282
By Gloria Guzman and Melissa Kollar
www2.census.gov/library/publ..., page 5:
Current Population Reports
Issued September 2024
P60-282
By Gloria Guzman and Melissa Kollar
www2.census.gov/library/publ..., page 5:

July 9, 2025 at 12:23 PM
Income in the United States: 2023
Current Population Reports
Issued September 2024
P60-282
By Gloria Guzman and Melissa Kollar
www2.census.gov/library/publ..., page 5:
Current Population Reports
Issued September 2024
P60-282
By Gloria Guzman and Melissa Kollar
www2.census.gov/library/publ..., page 5:
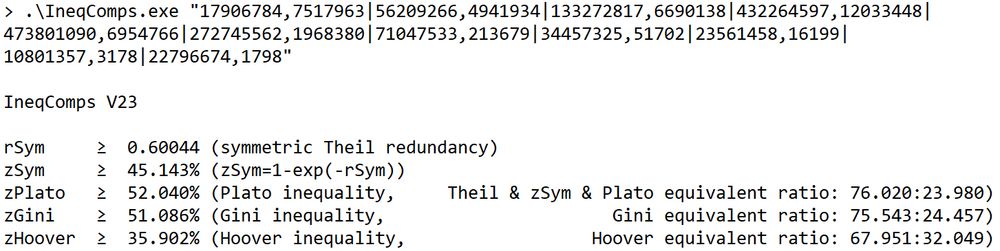
With zPlato you can present an inequality indicator in a ratio format.
Example: In the case below zPlato of an assembly with 11 groups is 52%. There is an assembly with just two groups where in the 1st group 76% of people own 24% of all ressources, while in the 2nd group 24% of people own 76 %.
Example: In the case below zPlato of an assembly with 11 groups is 52%. There is an assembly with just two groups where in the 1st group 76% of people own 24% of all ressources, while in the 2nd group 24% of people own 76 %.
July 9, 2025 at 11:59 AM
With zPlato you can present an inequality indicator in a ratio format.
Example: In the case below zPlato of an assembly with 11 groups is 52%. There is an assembly with just two groups where in the 1st group 76% of people own 24% of all ressources, while in the 2nd group 24% of people own 76 %.
Example: In the case below zPlato of an assembly with 11 groups is 52%. There is an assembly with just two groups where in the 1st group 76% of people own 24% of all ressources, while in the 2nd group 24% of people own 76 %.
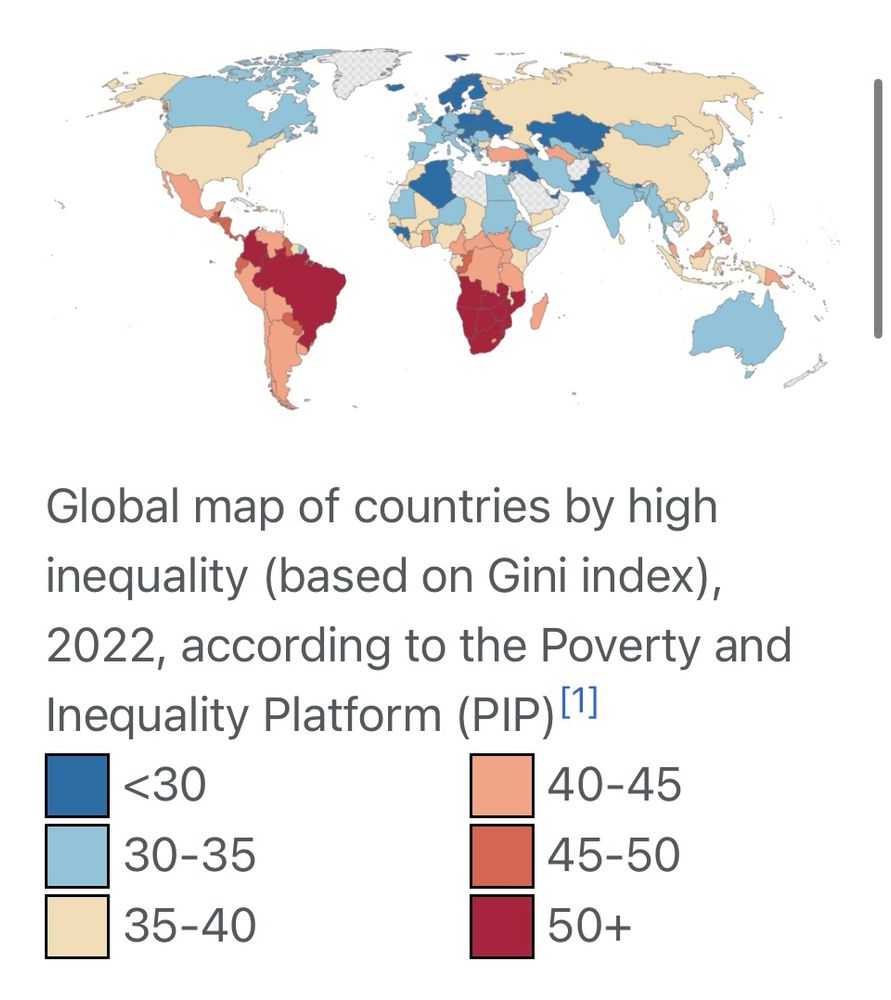
This means that you can't compare the Gini indices from different countries.
Does anybody know where to get the raw data (income distriboutions) based on which the Gini indices had been computed? I am curious how the ranking looks like if a Theil redundancy is used instead of the Gini index.
Does anybody know where to get the raw data (income distriboutions) based on which the Gini indices had been computed? I am curious how the ranking looks like if a Theil redundancy is used instead of the Gini index.

July 9, 2025 at 10:43 AM
This means that you can't compare the Gini indices from different countries.
Does anybody know where to get the raw data (income distriboutions) based on which the Gini indices had been computed? I am curious how the ranking looks like if a Theil redundancy is used instead of the Gini index.
Does anybody know where to get the raw data (income distriboutions) based on which the Gini indices had been computed? I am curious how the ranking looks like if a Theil redundancy is used instead of the Gini index.