


Iain A Malcolm
@iainamalcolm.bsky.social
Hydrologist, fisheries scientist, mountain biker, hiker. Science lead at SG Marine Directorate. Hon. Prof. at University of Aberdeen. Instream hydroecology, salmonids, fish assessment, river temperature, water quality. Personal Account. All views my own.
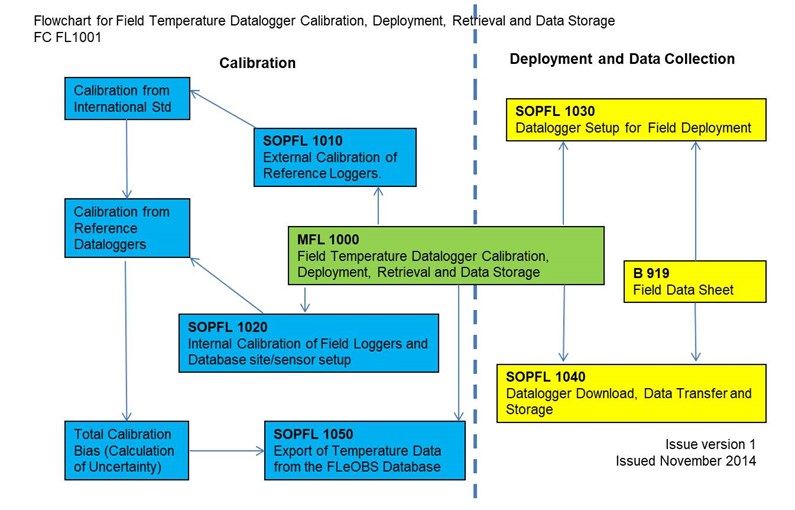
7. Logger calibration & QC are critical for the reliable assessment of river temperature trends. Failure to calibrate loggers can lead to spatio-temporal biases. These principles were core to the establishment of the Scotland River Temperature Monitoring Network #SRTMN www.gov.scot/publications...
July 19, 2025 at 4:34 PM
7. Logger calibration & QC are critical for the reliable assessment of river temperature trends. Failure to calibrate loggers can lead to spatio-temporal biases. These principles were core to the establishment of the Scotland River Temperature Monitoring Network #SRTMN www.gov.scot/publications...
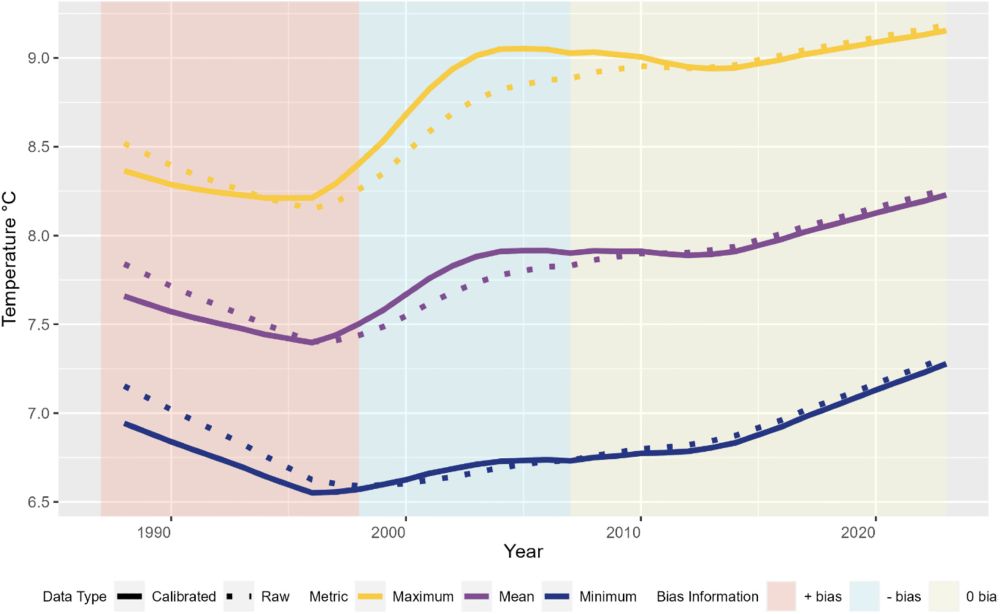
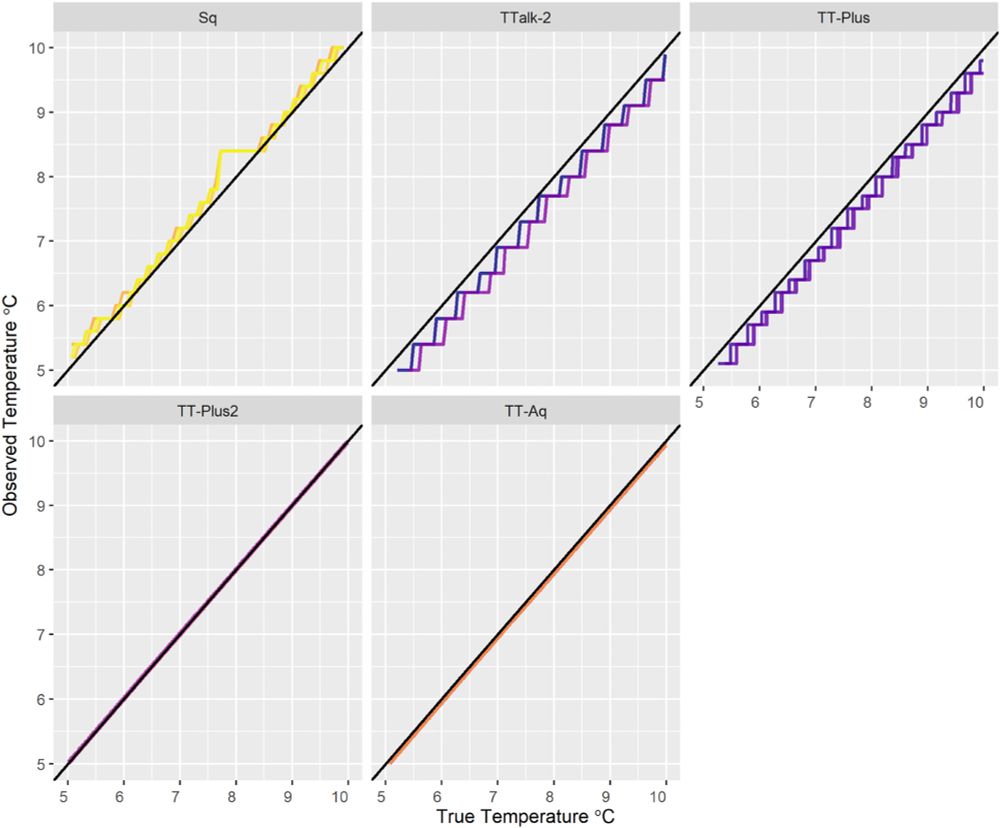
6. In the Girnock Burn, loggers deployed before March 1998 were positively biased while those deployed ca. 1998 to 2007 were negatively biased. The combined effect of these two biases is to moderate the observed temperature trends over the period ca. 1988–2010 relative to the true trend.
July 19, 2025 at 4:34 PM
6. In the Girnock Burn, loggers deployed before March 1998 were positively biased while those deployed ca. 1998 to 2007 were negatively biased. The combined effect of these two biases is to moderate the observed temperature trends over the period ca. 1988–2010 relative to the true trend.
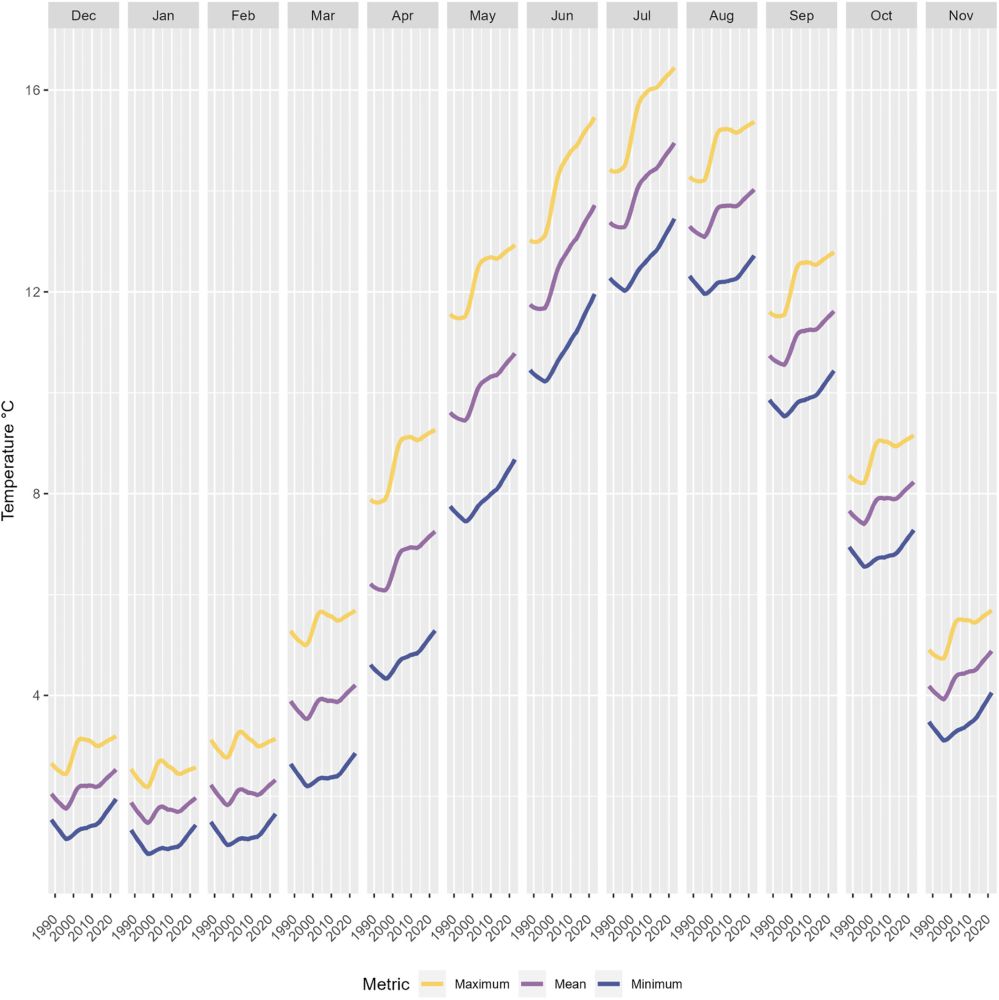
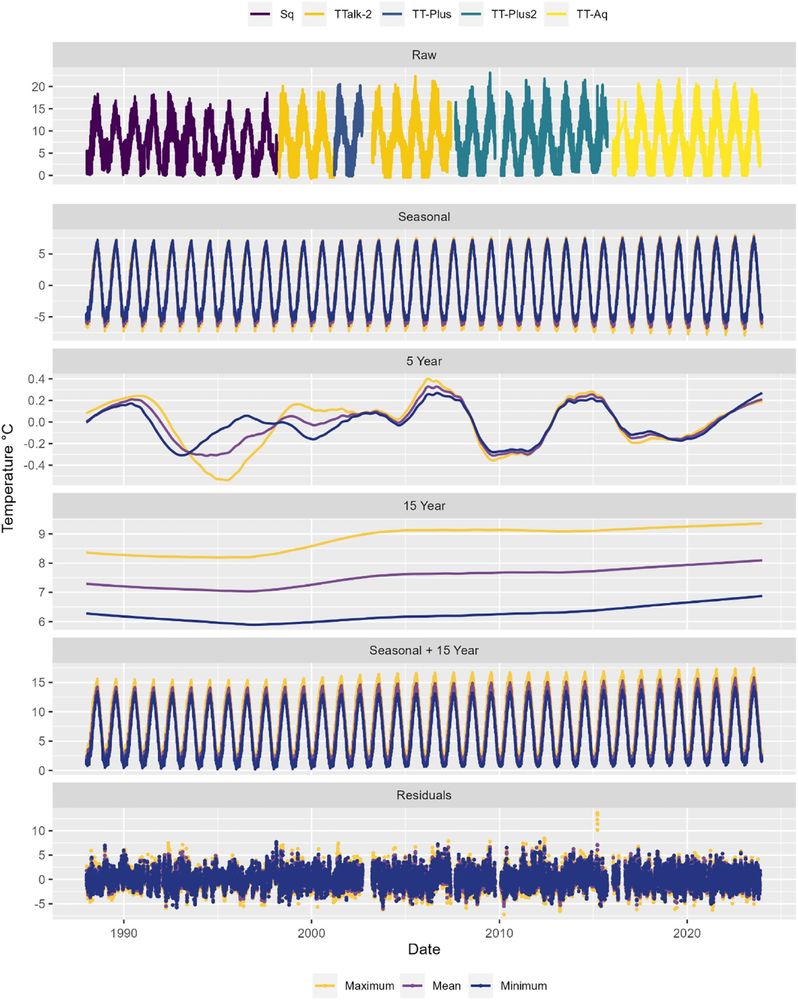
5. Using the bias corrected time-series it was shown that winter temperatures (December–February) were largely stable. Temperatures in other months increased non-linearly. Increases were greatest in summer (June–August) & for daily maximum temperatures, followed by daily mean and minimum.
July 19, 2025 at 4:34 PM
5. Using the bias corrected time-series it was shown that winter temperatures (December–February) were largely stable. Temperatures in other months increased non-linearly. Increases were greatest in summer (June–August) & for daily maximum temperatures, followed by daily mean and minimum.
4. We analysed trends in daily mean, max & min river temperature in the #Girnock Burn, the longest continuous sub-daily river temperature dataset in Scotland. Seasonal-Trend decomposition using Loess was undertaken on 1. raw & 2. bias corrected time-series to assess consequences for reported trends.
July 19, 2025 at 4:34 PM
4. We analysed trends in daily mean, max & min river temperature in the #Girnock Burn, the longest continuous sub-daily river temperature dataset in Scotland. Seasonal-Trend decomposition using Loess was undertaken on 1. raw & 2. bias corrected time-series to assess consequences for reported trends.
3. There are few long-term sub-daily river temperature time-series. These are often comprised of multiple logger/sensor combinations. Technological developments have increased memory, sampling frequency, reporting resolution, and precision of data. However, these changes can also introduce biases
July 19, 2025 at 4:34 PM
3. There are few long-term sub-daily river temperature time-series. These are often comprised of multiple logger/sensor combinations. Technological developments have increased memory, sampling frequency, reporting resolution, and precision of data. However, these changes can also introduce biases
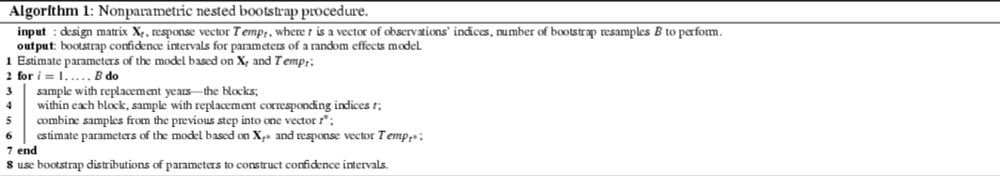
2. Spatio-temporal biases can be introduced through changes in deployment location (micro-site) and methods (e.g. with or without shielding), or in the case of spot sample time-series through changes in the time or frequency of sampling. doi.org/10.1007/s102...
Estimation of river and stream temperature trends under haphazard sampling - Statistical Methods & Applications
Long-term temporal trends in water temperature in rivers and streams are typically estimated under the assumption of evenly-spaced space-time measurements. However, sampling times and dates associated...
doi.org
July 19, 2025 at 4:34 PM
2. Spatio-temporal biases can be introduced through changes in deployment location (micro-site) and methods (e.g. with or without shielding), or in the case of spot sample time-series through changes in the time or frequency of sampling. doi.org/10.1007/s102...
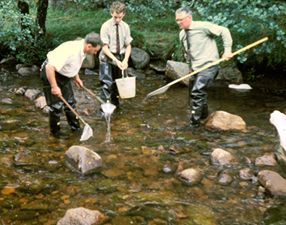
13. EF data can provide accurate, catch independent estimates of abundance in rivers, provided they are collected & analysed using appropriate methods. By sampling multiple sites, assessment is possible at any scale. When combined with data on pressures this underpins evidence based management.
June 13, 2025 at 12:06 PM
13. EF data can provide accurate, catch independent estimates of abundance in rivers, provided they are collected & analysed using appropriate methods. By sampling multiple sites, assessment is possible at any scale. When combined with data on pressures this underpins evidence based management.
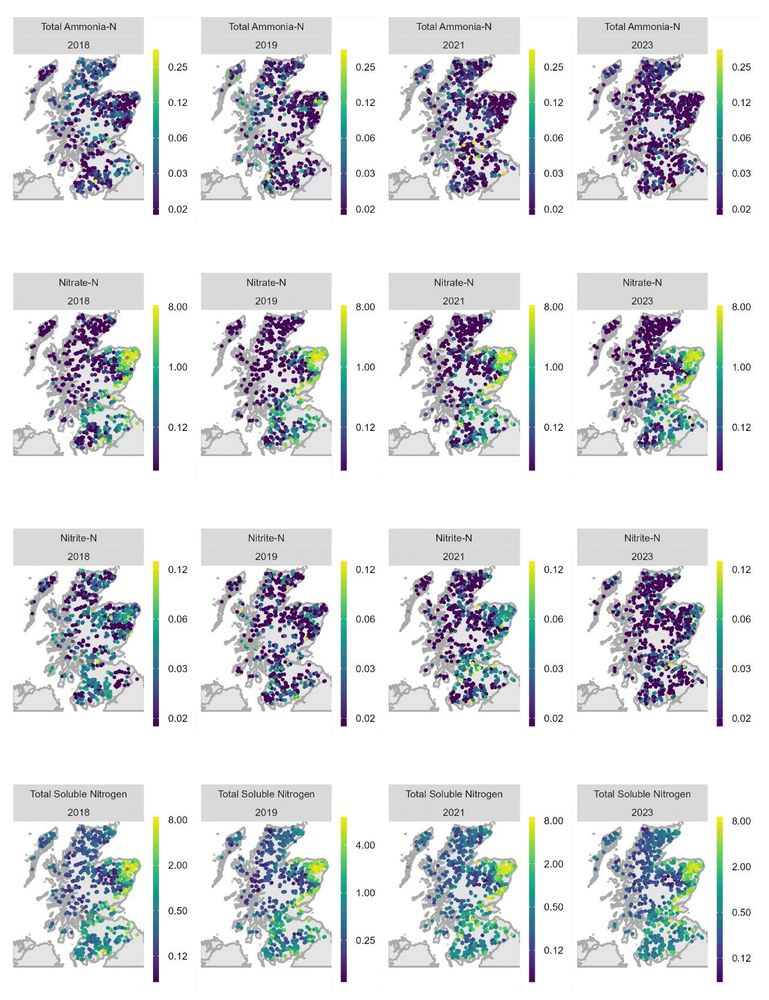
12. NEPS surveys provide an opportunity to characterise environmental pressures at the time of survey, including water quality and introgression. This information can be used to understand the critical thresholds and effect sizes and target management.
June 13, 2025 at 12:06 PM
12. NEPS surveys provide an opportunity to characterise environmental pressures at the time of survey, including water quality and introgression. This information can be used to understand the critical thresholds and effect sizes and target management.
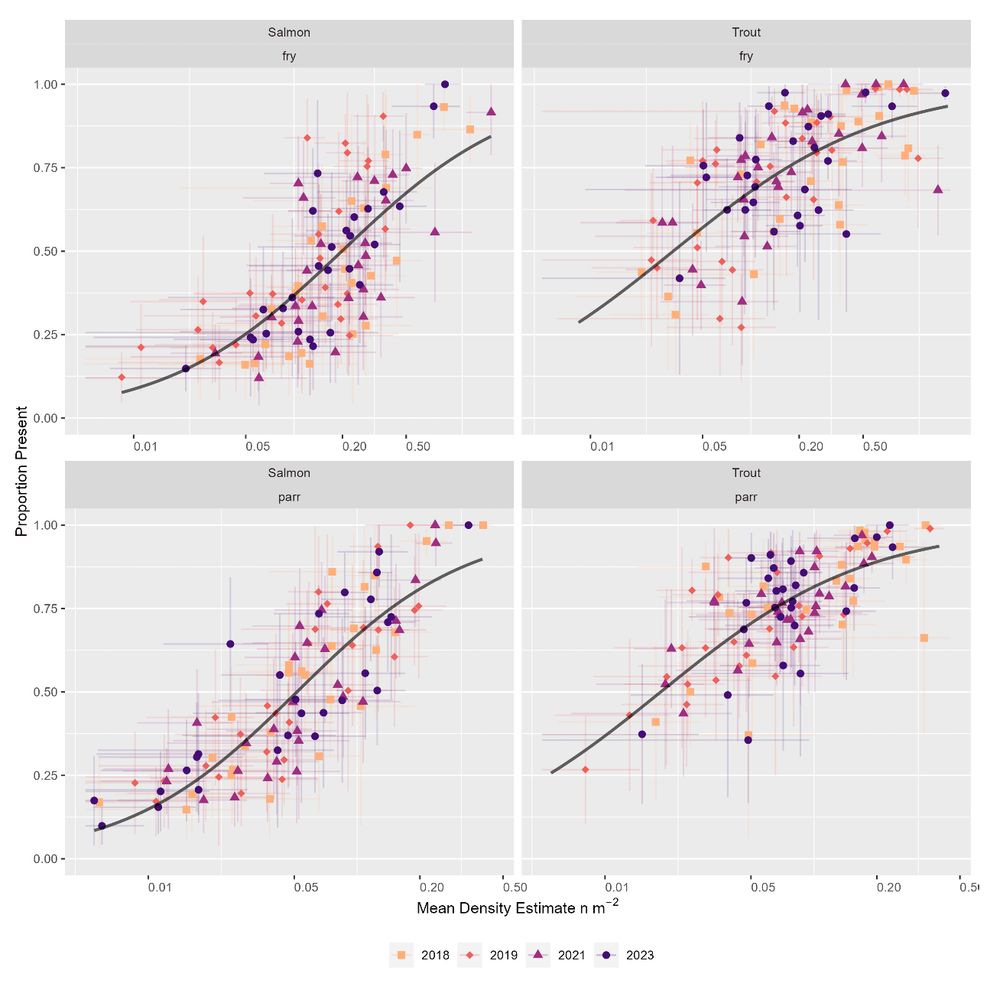
11. At low population densities, assessment becomes more challenging as the proportion of sites where fish are present decreases & relative inter-site variability in density increases. Occupancy provides another potential metric of population health if a suitable benchmark could be produced.
June 13, 2025 at 12:06 PM
11. At low population densities, assessment becomes more challenging as the proportion of sites where fish are present decreases & relative inter-site variability in density increases. Occupancy provides another potential metric of population health if a suitable benchmark could be produced.
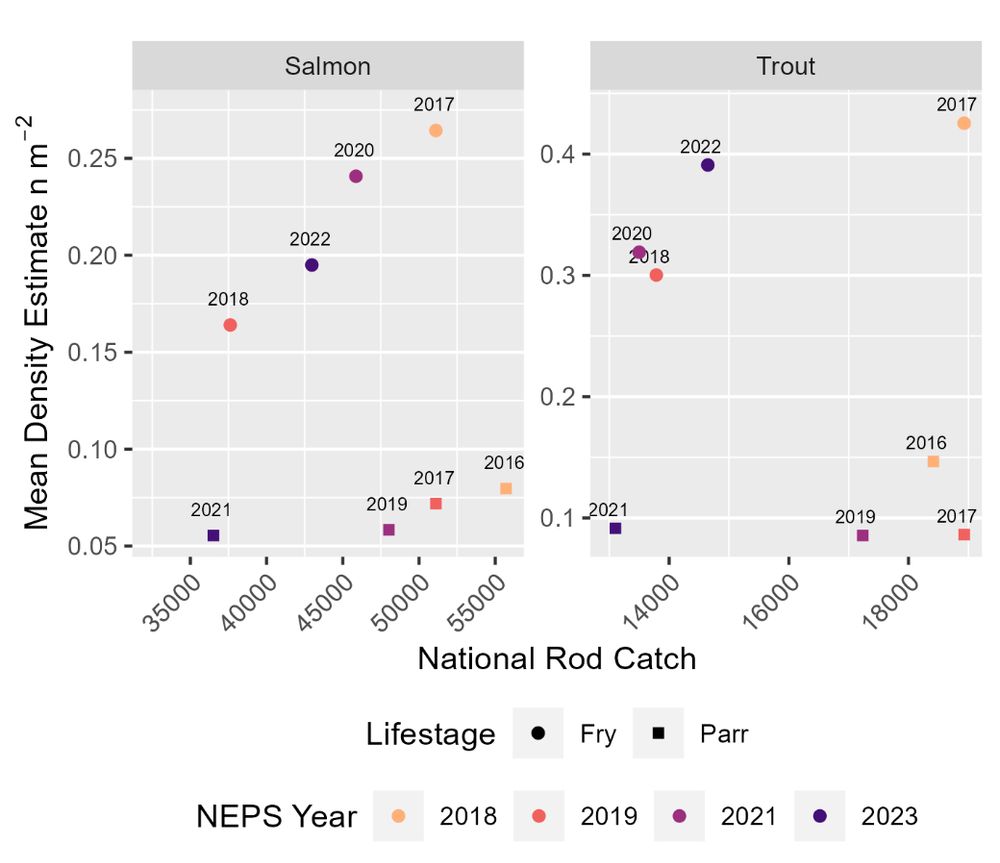
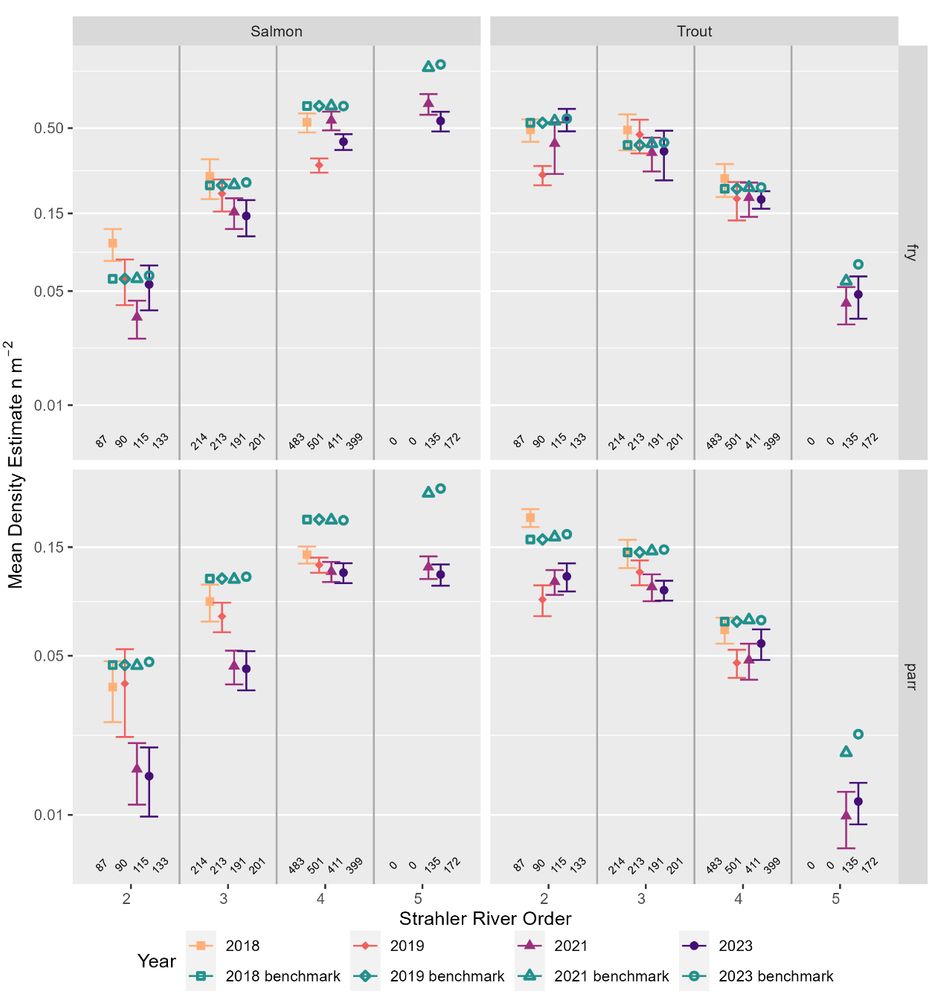
10. At the national scale salmon fry densities varied among years with rod catch (proxy of adult abundance). This was less clear for salmon parr, due to the effects of covid lockdowns on rod catches in 2021. Trout fry densities exhibited signs of density dependence in relation to sea trout catches
June 13, 2025 at 12:06 PM
10. At the national scale salmon fry densities varied among years with rod catch (proxy of adult abundance). This was less clear for salmon parr, due to the effects of covid lockdowns on rod catches in 2021. Trout fry densities exhibited signs of density dependence in relation to sea trout catches
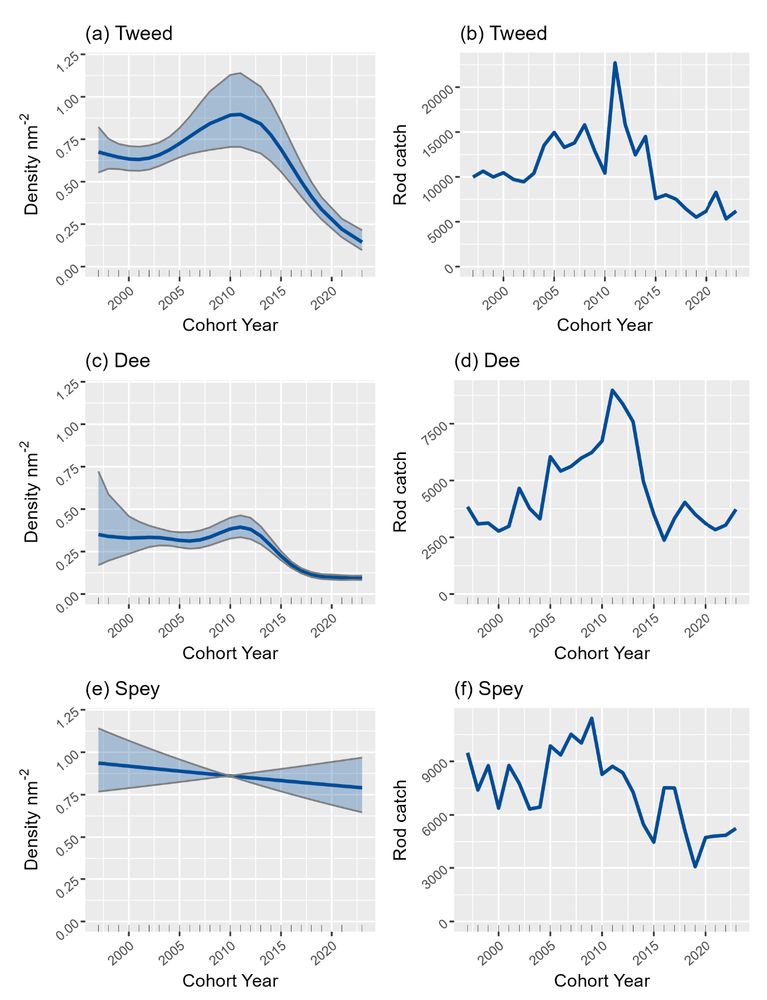
9. Where habitats are saturated with juveniles (NEPS Grade 1) densities would be expected to remain fairly constant over time, independent of adult numbers due to density dependent competition (see Spey below). This was explored for a small number of catchments with longer-term multi-pass EF data.
June 13, 2025 at 12:06 PM
9. Where habitats are saturated with juveniles (NEPS Grade 1) densities would be expected to remain fairly constant over time, independent of adult numbers due to density dependent competition (see Spey below). This was explored for a small number of catchments with longer-term multi-pass EF data.
8. At a national scale, Atlantic salmon densities increased with increasing Strahler river order (bigger rivers), while trout densities declined. In general, spatial patterns persisted between years shifting up or down depending on overall abundance.
June 13, 2025 at 12:06 PM
8. At a national scale, Atlantic salmon densities increased with increasing Strahler river order (bigger rivers), while trout densities declined. In general, spatial patterns persisted between years shifting up or down depending on overall abundance.
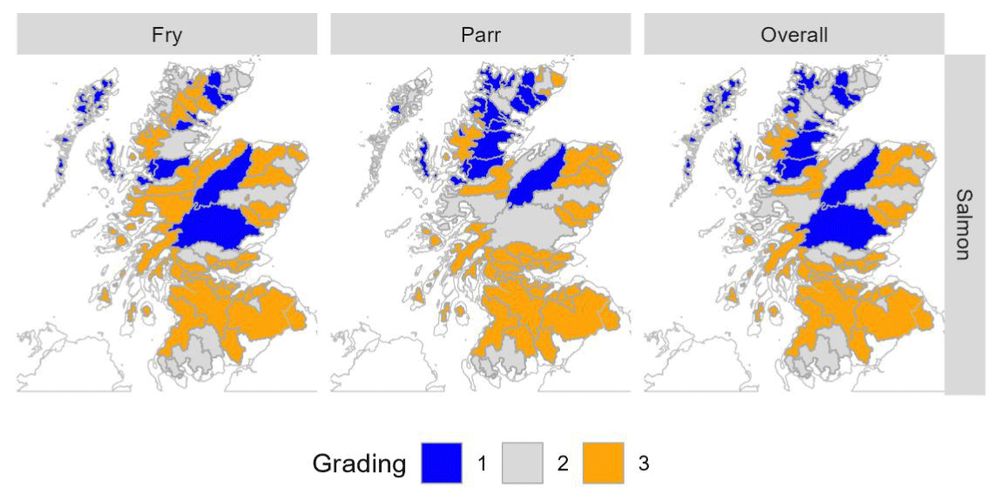
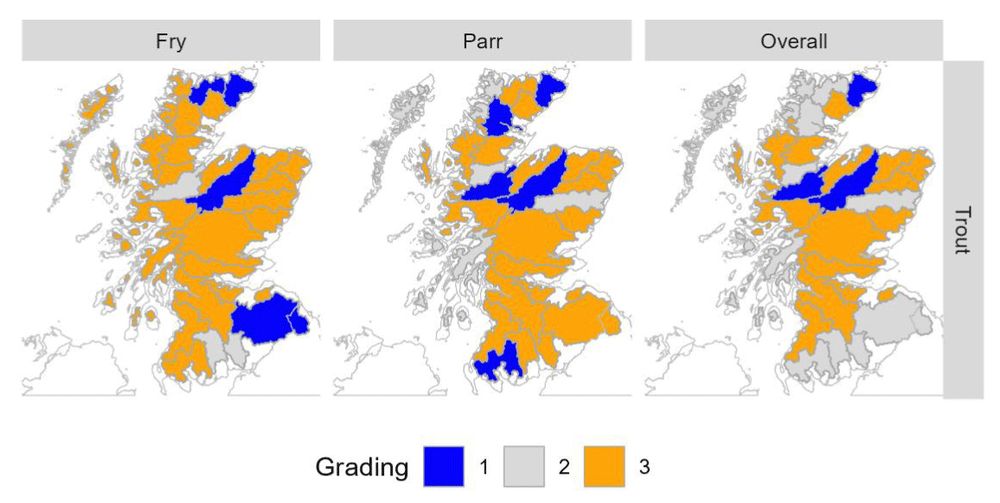
7. Within the overall pattern of poor performance there was substantial regional variability. Fish stocks were assigned a Grade of 1-3 (1 healthy, 3 unhealthy) depending on performance against benchmark & uncertainty in abundance. Separate assessments were undertaken for each species & age class.
June 13, 2025 at 12:06 PM
7. Within the overall pattern of poor performance there was substantial regional variability. Fish stocks were assigned a Grade of 1-3 (1 healthy, 3 unhealthy) depending on performance against benchmark & uncertainty in abundance. Separate assessments were undertaken for each species & age class.
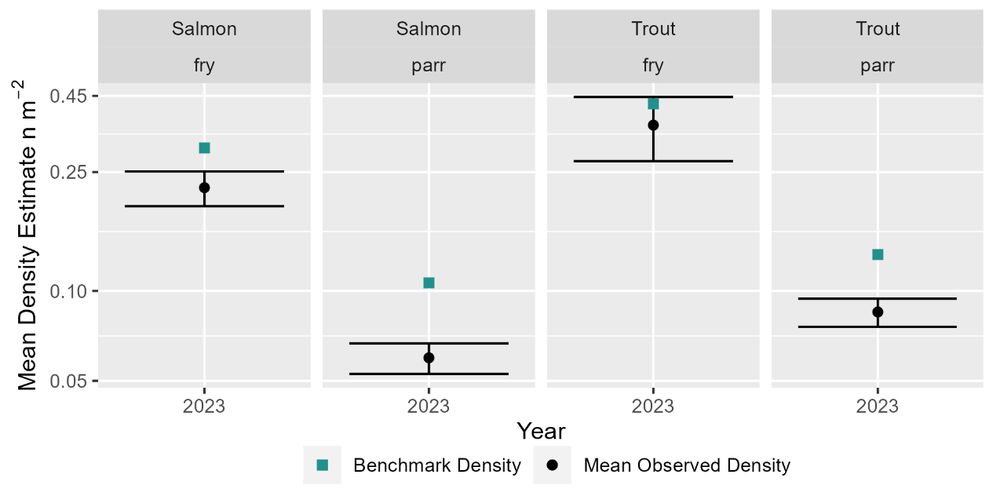
6. At a national scale salmon fry (0 year old) & parr (>0 year old) juvenile densities were substantially & significantly below the benchmark indicating that available habitats are no longer fully occupied. Trout fry & parr densities were also below the benchmark, but not significantly for fry.
June 13, 2025 at 12:06 PM
6. At a national scale salmon fry (0 year old) & parr (>0 year old) juvenile densities were substantially & significantly below the benchmark indicating that available habitats are no longer fully occupied. Trout fry & parr densities were also below the benchmark, but not significantly for fry.
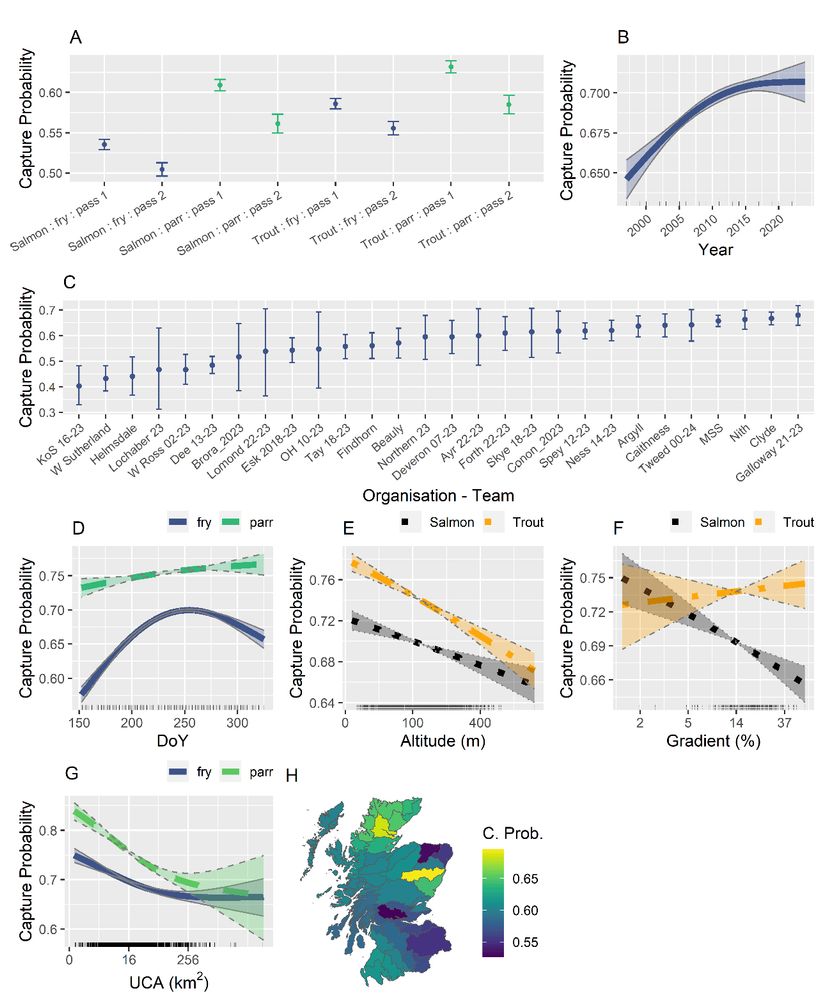
5. The NEPS 2023 report updates existing capture probability (P) models for Scotland, illustrating that P varies with species, lifestage, pass, organisation, habitat, day of the year & region. Importantly there are also long-term trends in P emphasising the need for continued multi-pass data.
June 13, 2025 at 12:06 PM
5. The NEPS 2023 report updates existing capture probability (P) models for Scotland, illustrating that P varies with species, lifestage, pass, organisation, habitat, day of the year & region. Importantly there are also long-term trends in P emphasising the need for continued multi-pass data.