


John Hammond
@hydrohammond.bsky.social
Research hydrologist and river photographer. www.riversfromabove.com
“On the Structure of Temporal Variability of Streamflow Responses and the Role of Timescale Interactions — A Synthesis”
A nice synthesis showing how streamflow variability emerges from interacting timescales — fast events like storms intertwined with slower processes like soil moisture and memory.
A nice synthesis showing how streamflow variability emerges from interacting timescales — fast events like storms intertwined with slower processes like soil moisture and memory.


November 14, 2025 at 6:49 PM
“On the Structure of Temporal Variability of Streamflow Responses and the Role of Timescale Interactions — A Synthesis”
A nice synthesis showing how streamflow variability emerges from interacting timescales — fast events like storms intertwined with slower processes like soil moisture and memory.
A nice synthesis showing how streamflow variability emerges from interacting timescales — fast events like storms intertwined with slower processes like soil moisture and memory.
Finally, I got to explore the high elevations of North Central Colorado, where I studied stream flow generation in snow dominated areas, some of them semiarid.

November 12, 2025 at 6:54 PM
Finally, I got to explore the high elevations of North Central Colorado, where I studied stream flow generation in snow dominated areas, some of them semiarid.
While in Oregon, I got to study the difference in stream flow dynamics between above dam and below dam sites, with an example of a blow, dam hydrograph shown by the site in Oregon.

November 12, 2025 at 6:54 PM
While in Oregon, I got to study the difference in stream flow dynamics between above dam and below dam sites, with an example of a blow, dam hydrograph shown by the site in Oregon.
From there, it was off to Oregon or I got to experience the distinct wet and dry seasons of a Mediterranean like climate


November 12, 2025 at 6:54 PM
From there, it was off to Oregon or I got to experience the distinct wet and dry seasons of a Mediterranean like climate
My first real job after I left Maryland was as a national Park range at North Cascades national Park in Washington state. There I got to experience seasonal snow, melt for the first time, and got to explore many of the hundreds of glaciers in the region!


November 12, 2025 at 6:54 PM
My first real job after I left Maryland was as a national Park range at North Cascades national Park in Washington state. There I got to experience seasonal snow, melt for the first time, and got to explore many of the hundreds of glaciers in the region!
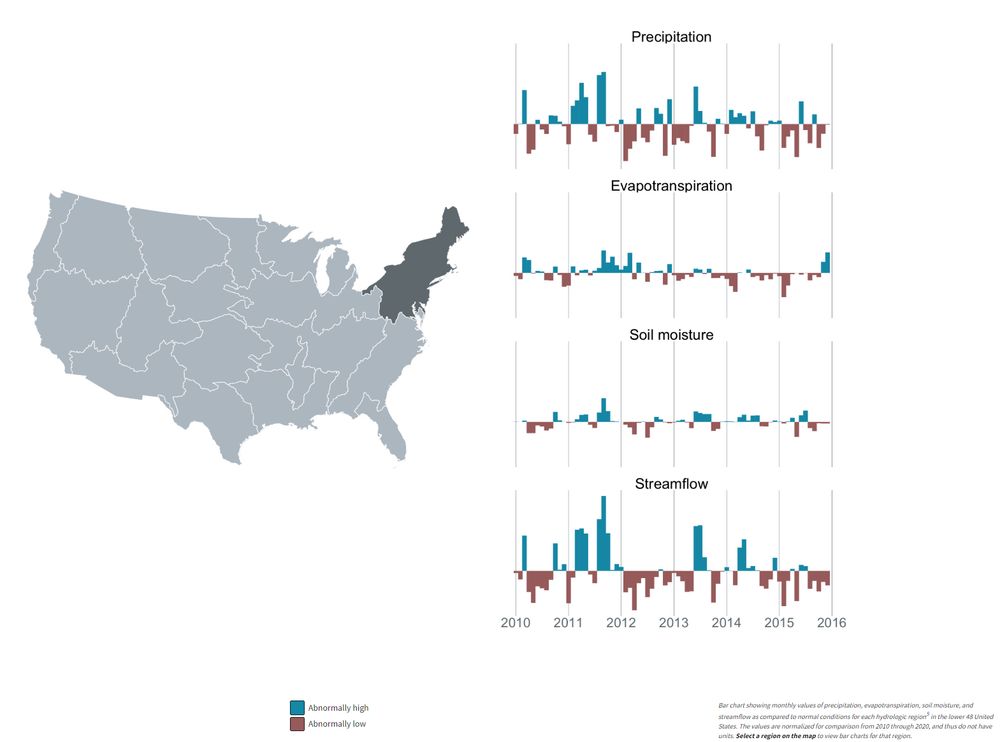
Now here are the same types of plots for an exclusively rain driven system closer to where I live in Maryland now, and where I grew up. I distinctly remember the super low periods of 1999 in 2002 when our yard had deep cracks in the clay soils.


November 12, 2025 at 6:54 PM
Now here are the same types of plots for an exclusively rain driven system closer to where I live in Maryland now, and where I grew up. I distinctly remember the super low periods of 1999 in 2002 when our yard had deep cracks in the clay soils.
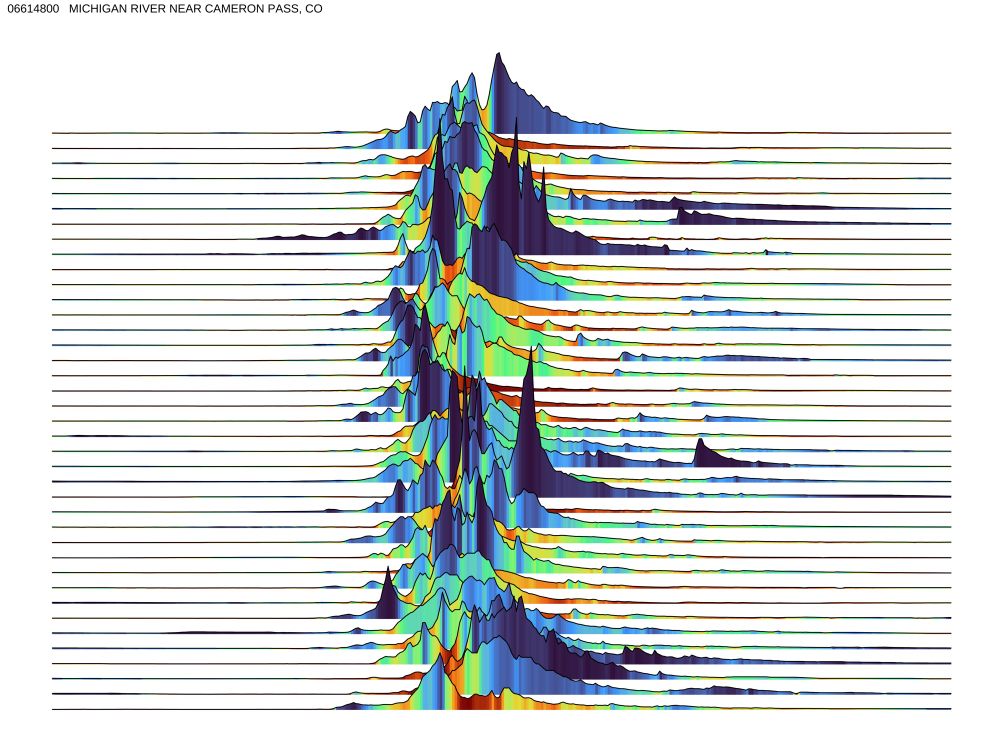
This example shows a watershed with a clear seasonal snow melt freshet in the spring. One thing I haven’t quite worked out yet is how to have the years with below normal snow melt or later than normal snow melt still display when the data is hidden behind the higher than normal peaks.

November 12, 2025 at 6:54 PM
This example shows a watershed with a clear seasonal snow melt freshet in the spring. One thing I haven’t quite worked out yet is how to have the years with below normal snow melt or later than normal snow melt still display when the data is hidden behind the higher than normal peaks.
Refinding joy in exploring streamflow data 😍 just looking at the stories gages tell about rivers.
Here’s the Allagash River (ME), 1980–2020. Each line: a year of daily flow (Jan–Dec). Colors show each day compared to normal: green ≈ normal, blue = high, red = low. 🌊💧
#Hydrology #DataViz #sciArt
Here’s the Allagash River (ME), 1980–2020. Each line: a year of daily flow (Jan–Dec). Colors show each day compared to normal: green ≈ normal, blue = high, red = low. 🌊💧
#Hydrology #DataViz #sciArt

November 12, 2025 at 6:54 PM
Refinding joy in exploring streamflow data 😍 just looking at the stories gages tell about rivers.
Here’s the Allagash River (ME), 1980–2020. Each line: a year of daily flow (Jan–Dec). Colors show each day compared to normal: green ≈ normal, blue = high, red = low. 🌊💧
#Hydrology #DataViz #sciArt
Here’s the Allagash River (ME), 1980–2020. Each line: a year of daily flow (Jan–Dec). Colors show each day compared to normal: green ≈ normal, blue = high, red = low. 🌊💧
#Hydrology #DataViz #sciArt
I’m still figuring out bluesky… but with the goal of more easily finding information I’m interested in, I started a feed and associated starter pack for Hydrological Processes as well as Hydrological Extremes. Please let me know if you want to be added to the starter pack! bsky.app/profile/did:...

November 11, 2025 at 6:15 PM
I’m still figuring out bluesky… but with the goal of more easily finding information I’m interested in, I started a feed and associated starter pack for Hydrological Processes as well as Hydrological Extremes. Please let me know if you want to be added to the starter pack! bsky.app/profile/did:...
Fond memories from exploring the hydrology of Scotland this time last year


November 5, 2025 at 7:44 PM
Fond memories from exploring the hydrology of Scotland this time last year
Significant precipitation finally headed for areas of the northeast that are in severe and extreme hydrological drought


October 28, 2025 at 3:02 PM
Significant precipitation finally headed for areas of the northeast that are in severe and extreme hydrological drought
Excited to start playing around with #IOT again! Narrow band IOT sensors are affordable and claim to have very long battery life with SIM cards that have a one time up front payment. Let’s see how this goes over the coming days….

October 28, 2025 at 12:52 AM
Excited to start playing around with #IOT again! Narrow band IOT sensors are affordable and claim to have very long battery life with SIM cards that have a one time up front payment. Let’s see how this goes over the coming days….


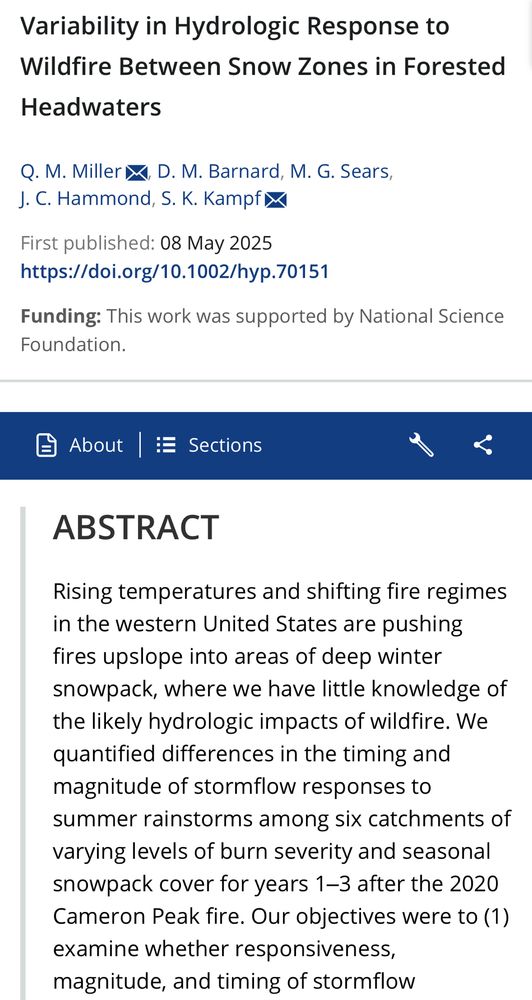
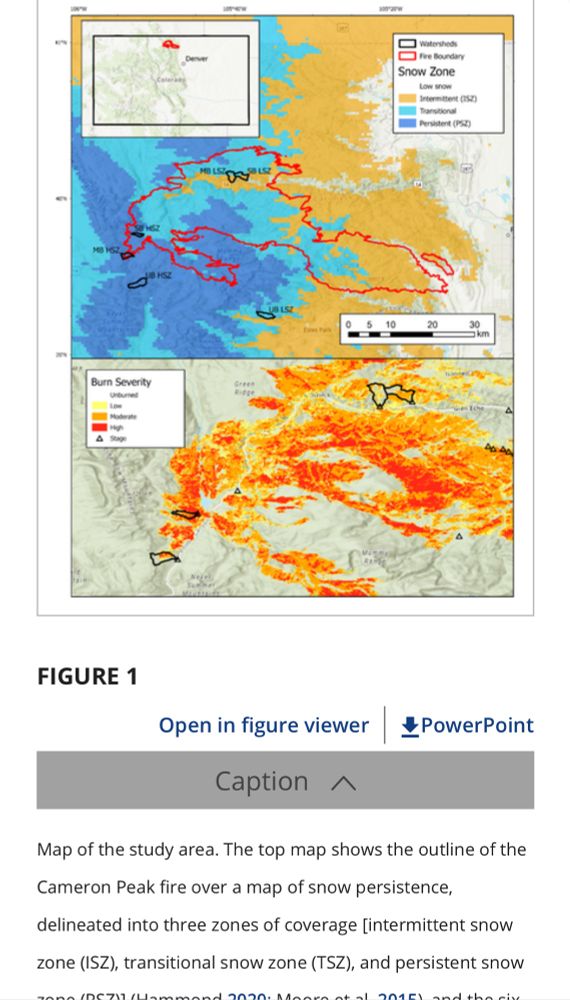
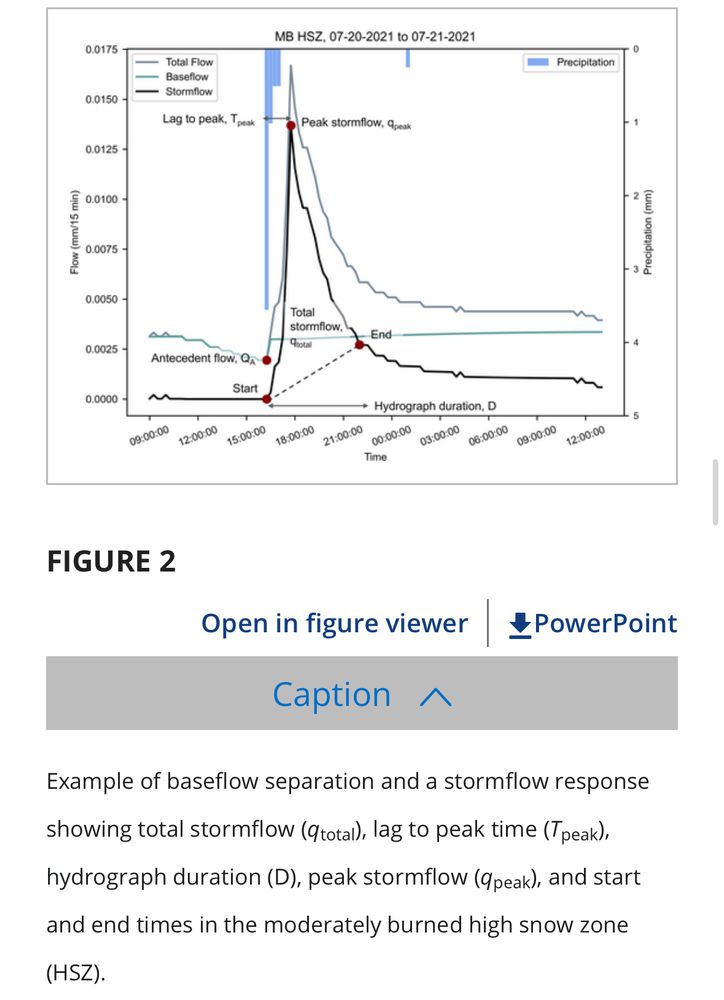
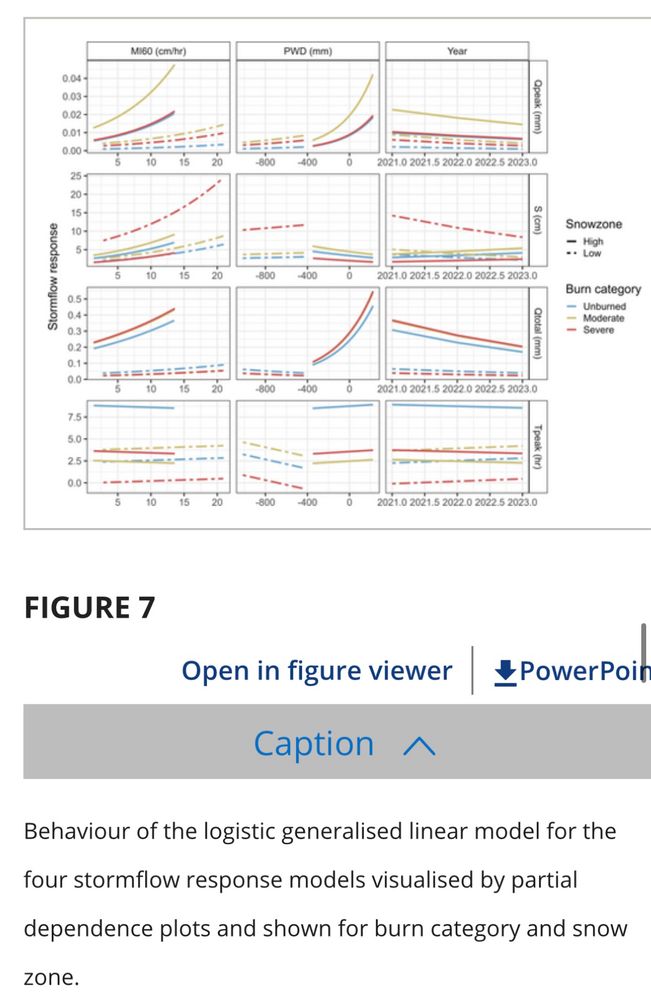
Quinn Miller’s MS work is now out! onlinelibrary.wiley.com/doi/10.1002/...
May 8, 2025 at 3:47 PM
Quinn Miller’s MS work is now out! onlinelibrary.wiley.com/doi/10.1002/...
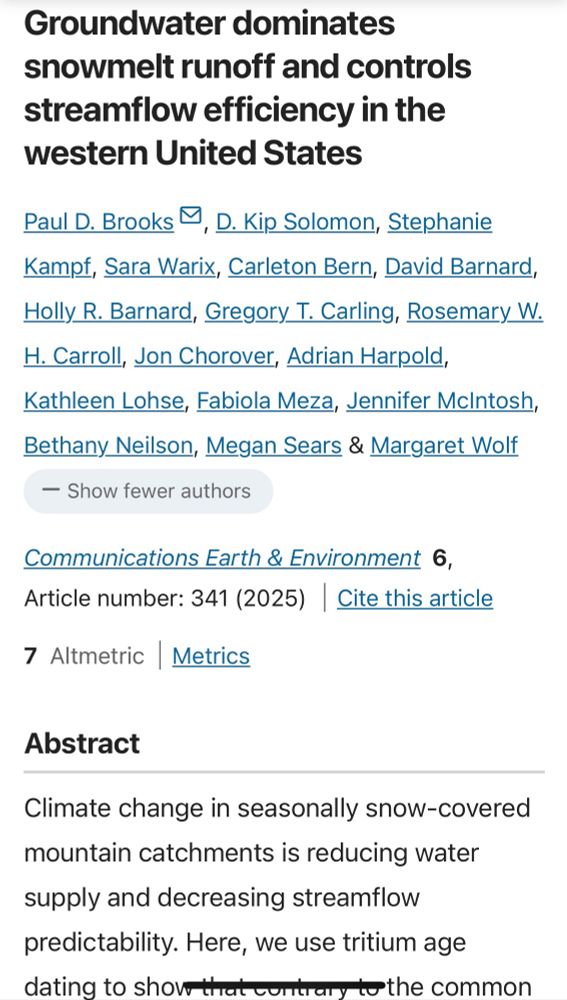
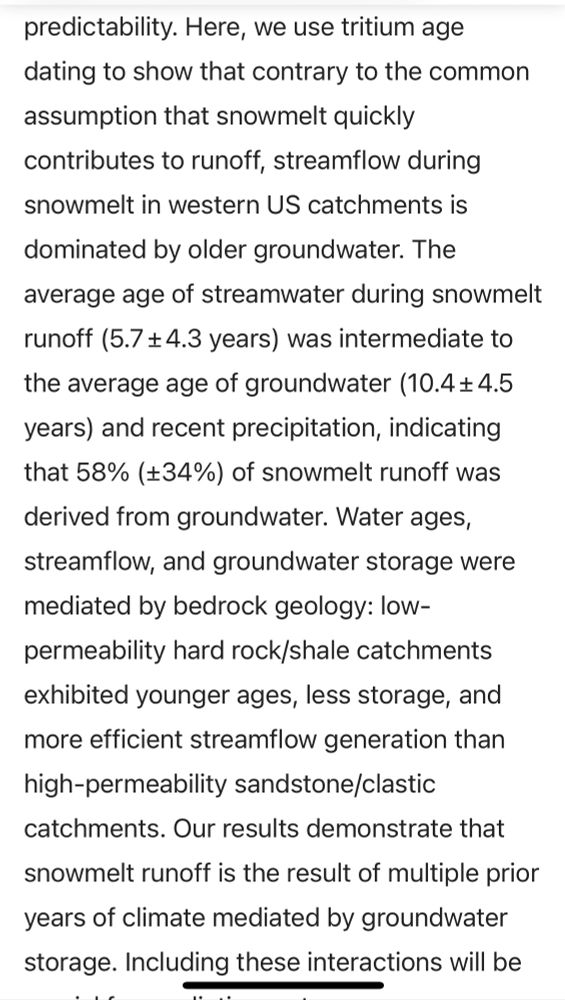
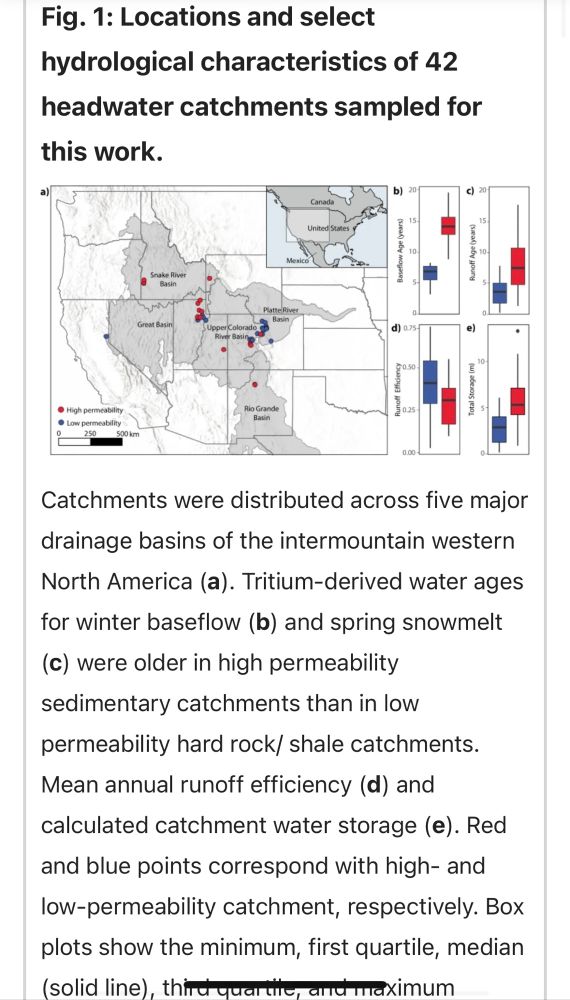
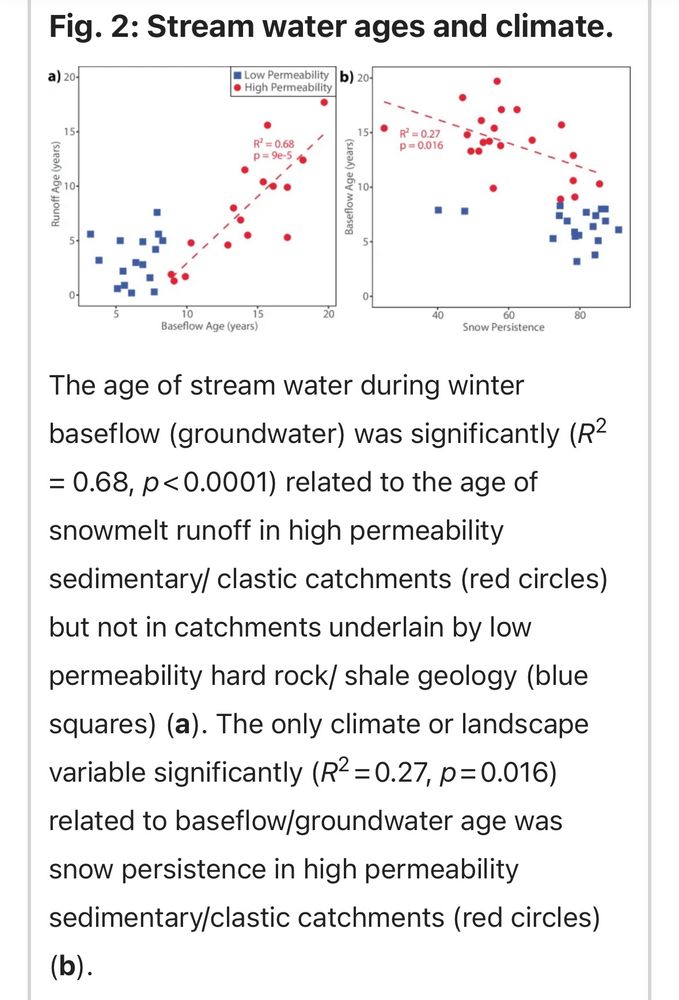
“Groundwater dominates snowmelt runoff and controls streamflow efficiency in the western United States” www.nature.com/articles/s43...
May 5, 2025 at 1:51 PM
“Groundwater dominates snowmelt runoff and controls streamflow efficiency in the western United States” www.nature.com/articles/s43...
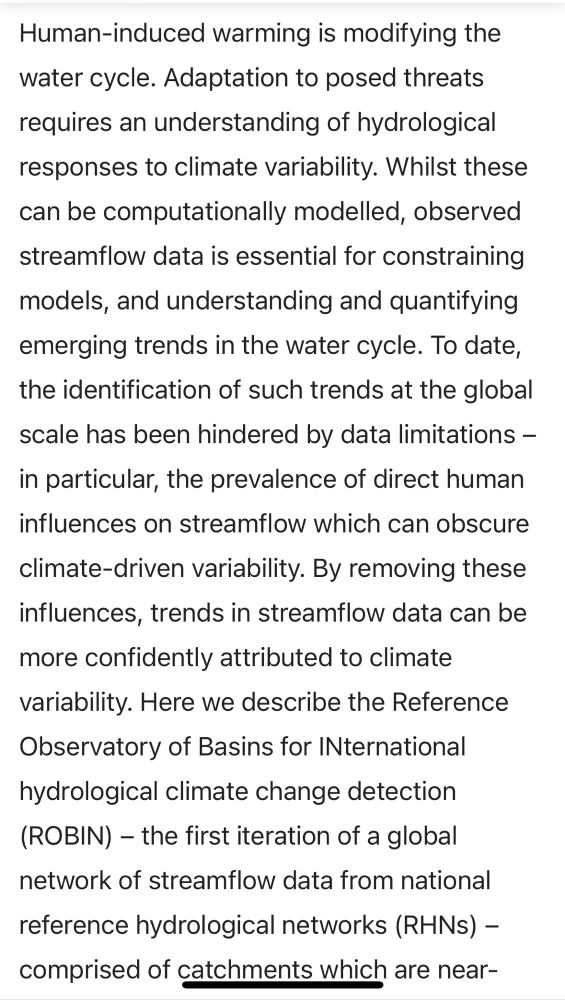
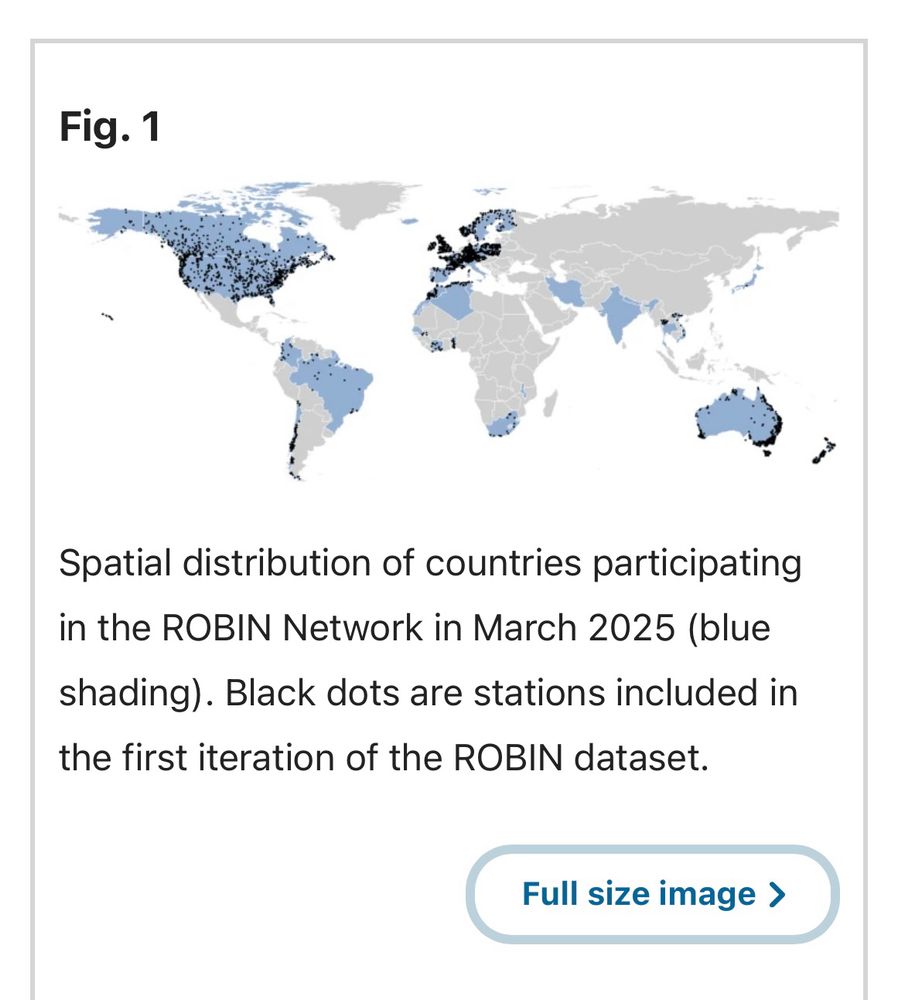
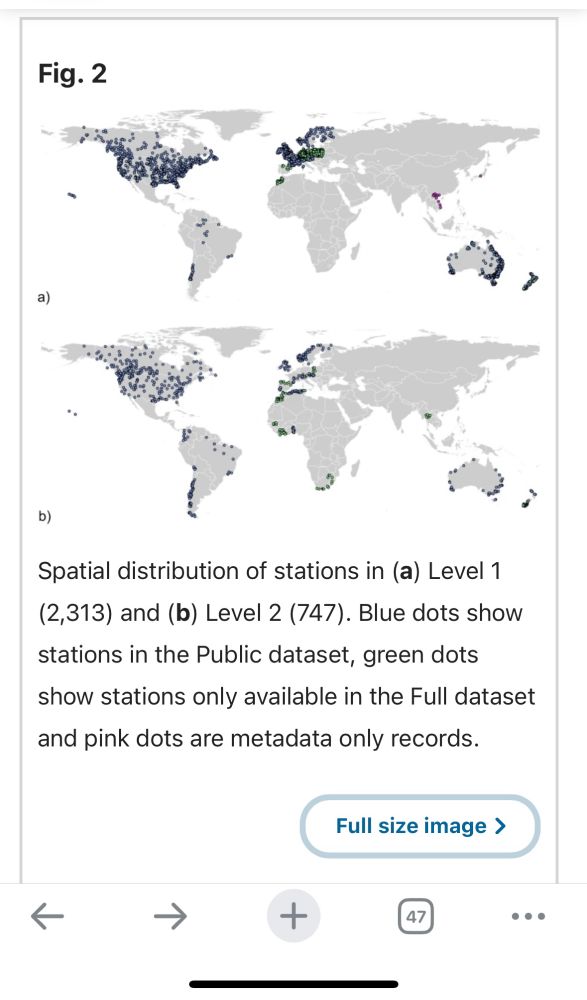
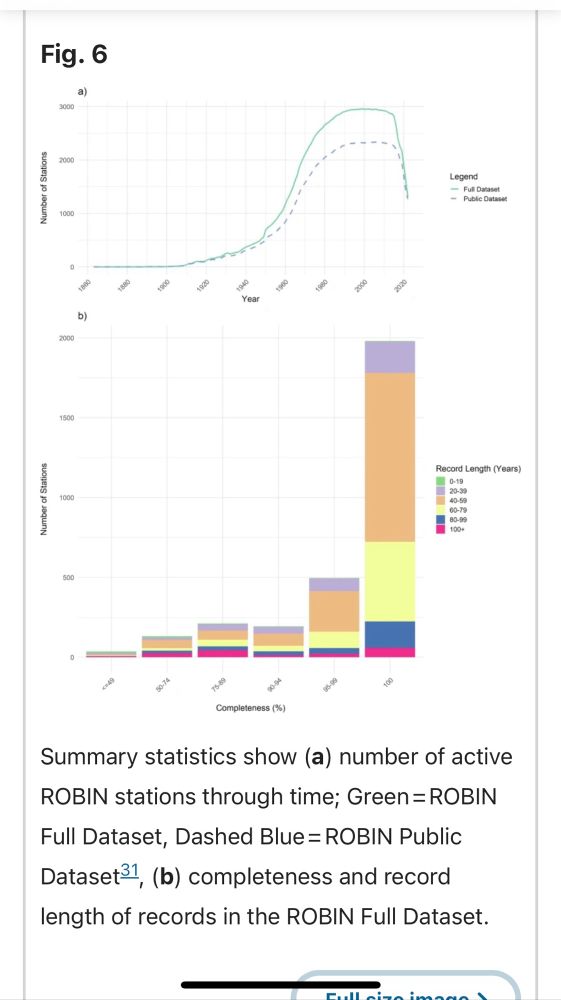
“ROBIN: Reference observatory of basins for international hydrological climate change detection” www.nature.com/articles/s41...
April 21, 2025 at 2:51 PM
“ROBIN: Reference observatory of basins for international hydrological climate change detection” www.nature.com/articles/s41...
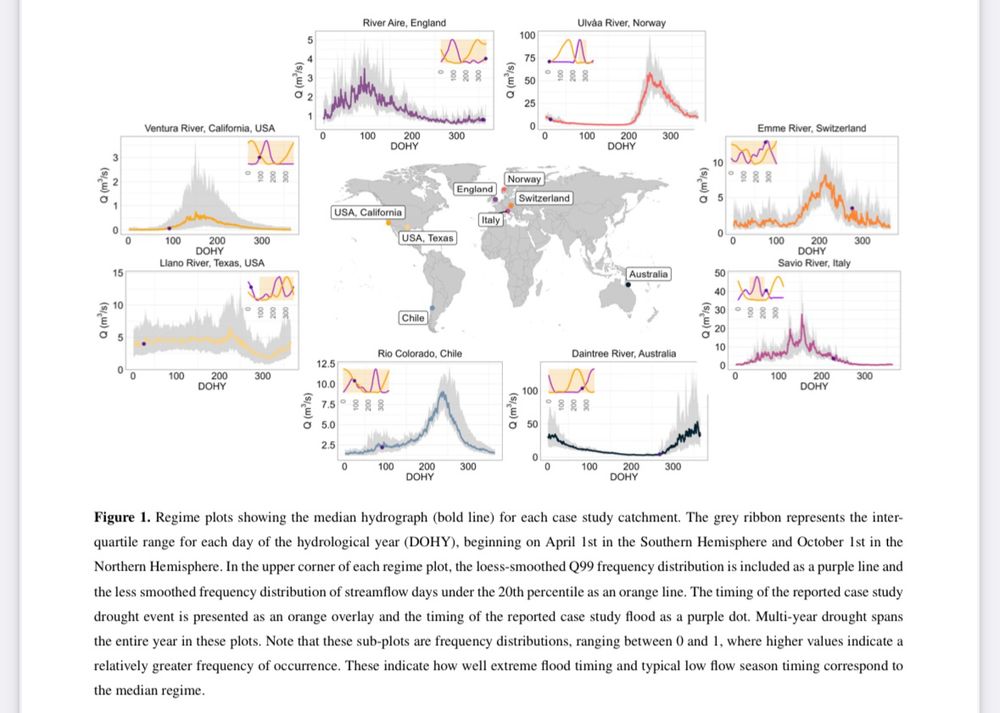
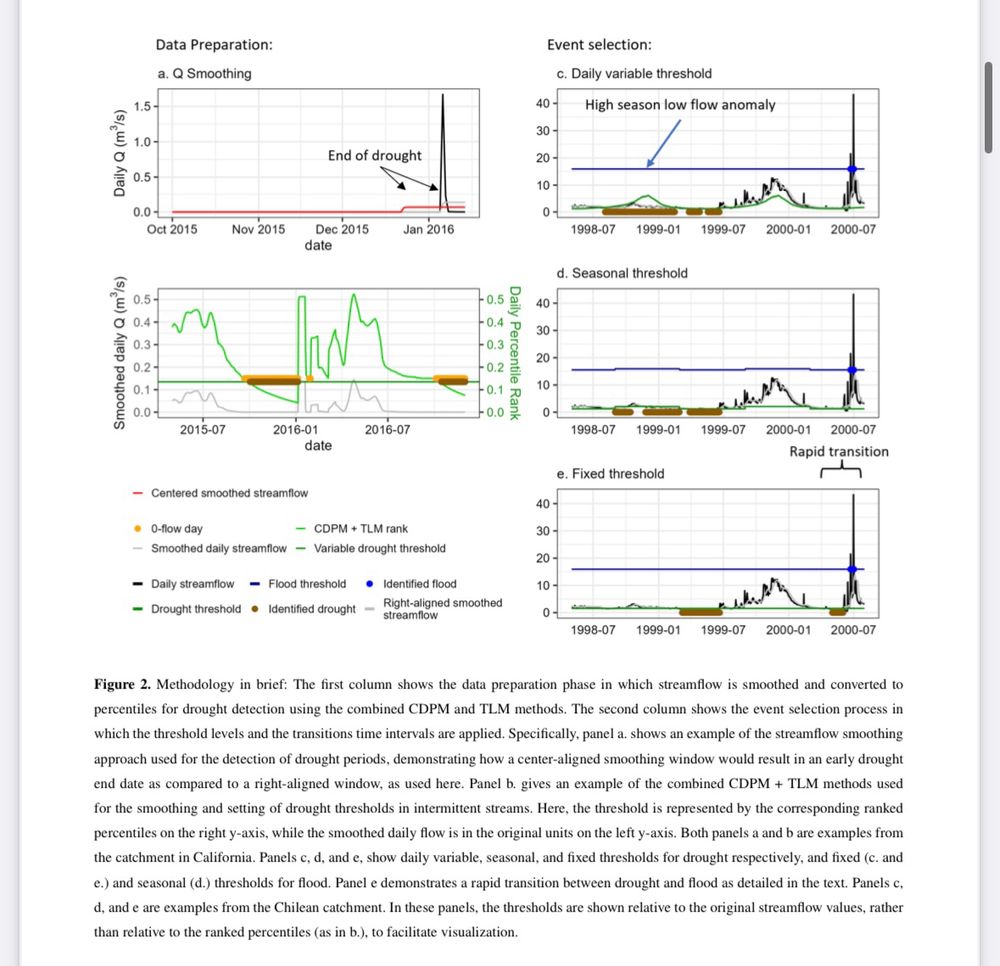
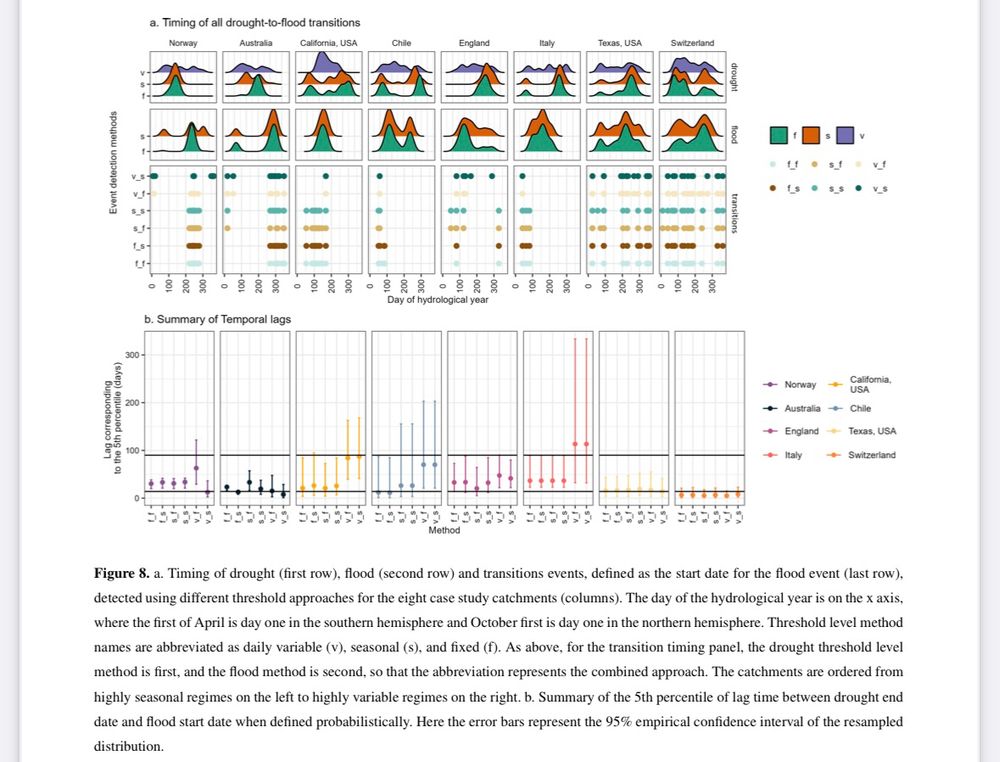
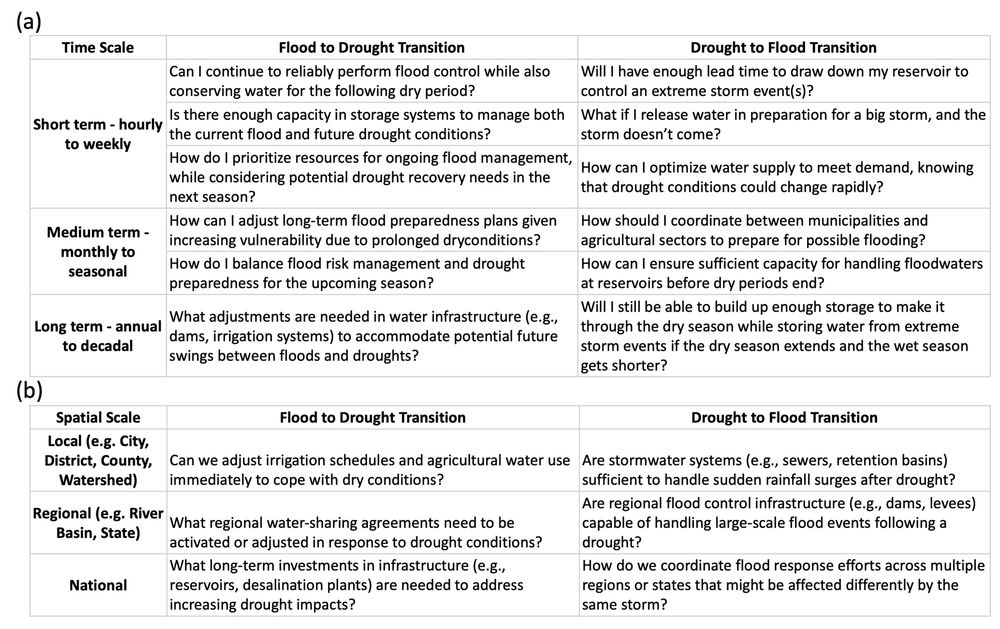
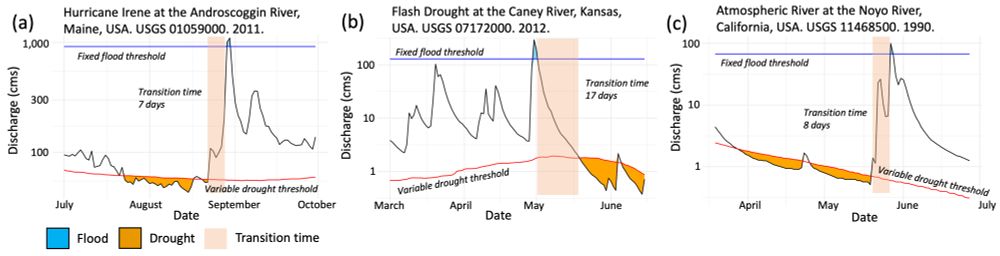
“What is a drought-to-flood transition? Pitfalls and recommendations for defining consecutive hydrological extreme events”
egusphere.copernicus.org/preprints/20...
egusphere.copernicus.org/preprints/20...
April 17, 2025 at 4:06 PM
“What is a drought-to-flood transition? Pitfalls and recommendations for defining consecutive hydrological extreme events”
egusphere.copernicus.org/preprints/20...
egusphere.copernicus.org/preprints/20...
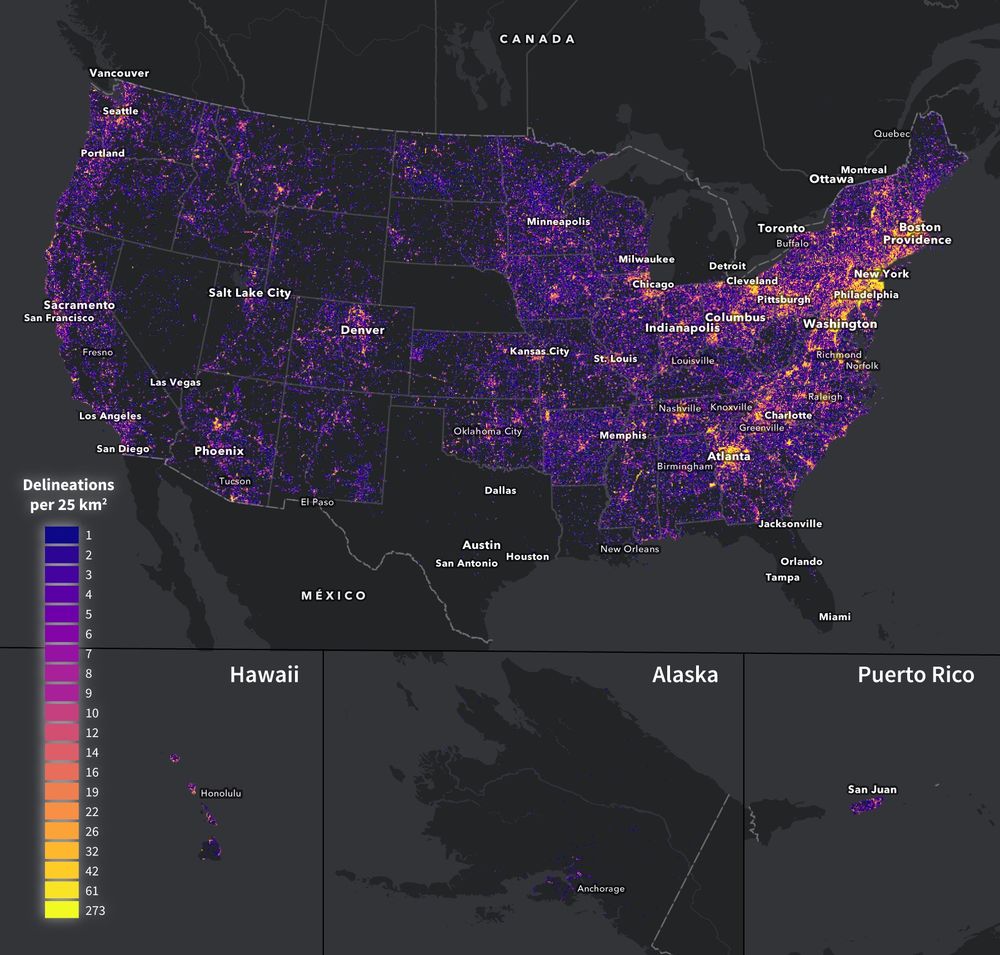
StreamStats Delineations - Where are they?
This figure shows the density of delineations per 25 square kilometer grid for all delineations over the period 3/16/24-3/15/25. www.usgs.gov/media/images...
This figure shows the density of delineations per 25 square kilometer grid for all delineations over the period 3/16/24-3/15/25. www.usgs.gov/media/images...
April 16, 2025 at 4:27 PM
StreamStats Delineations - Where are they?
This figure shows the density of delineations per 25 square kilometer grid for all delineations over the period 3/16/24-3/15/25. www.usgs.gov/media/images...
This figure shows the density of delineations per 25 square kilometer grid for all delineations over the period 3/16/24-3/15/25. www.usgs.gov/media/images...
“Linking wetlands to relatively permanent flowing waters: a conterminous United States geospatial analysis” - 79% or 66% of freshwater palustrine wetlands are potentially connected to the stream network, depending if inclusive,exclusive flow permanence network used
link.springer.com/article/10.1...
link.springer.com/article/10.1...
March 31, 2025 at 3:02 PM
“Linking wetlands to relatively permanent flowing waters: a conterminous United States geospatial analysis” - 79% or 66% of freshwater palustrine wetlands are potentially connected to the stream network, depending if inclusive,exclusive flow permanence network used
link.springer.com/article/10.1...
link.springer.com/article/10.1...
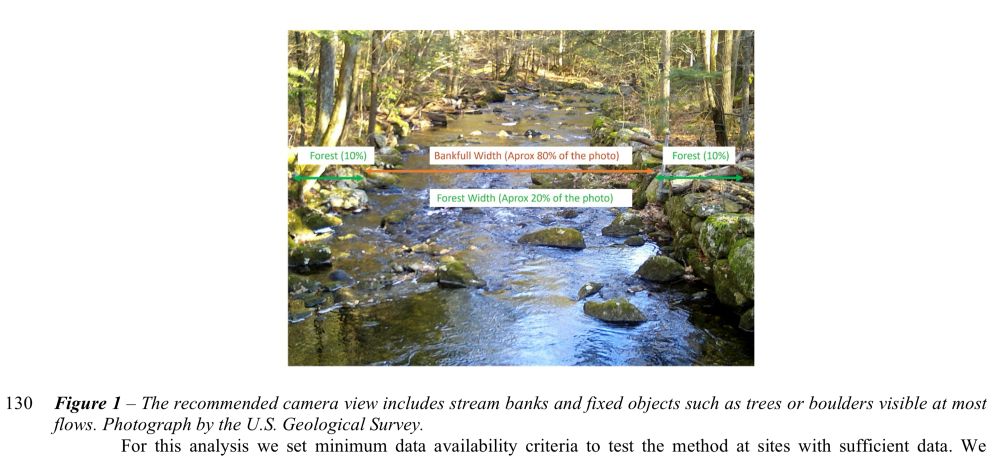
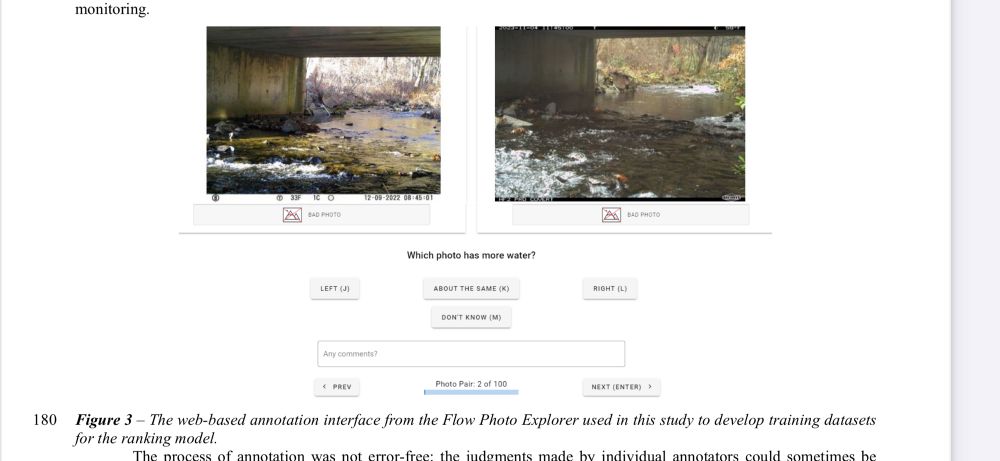
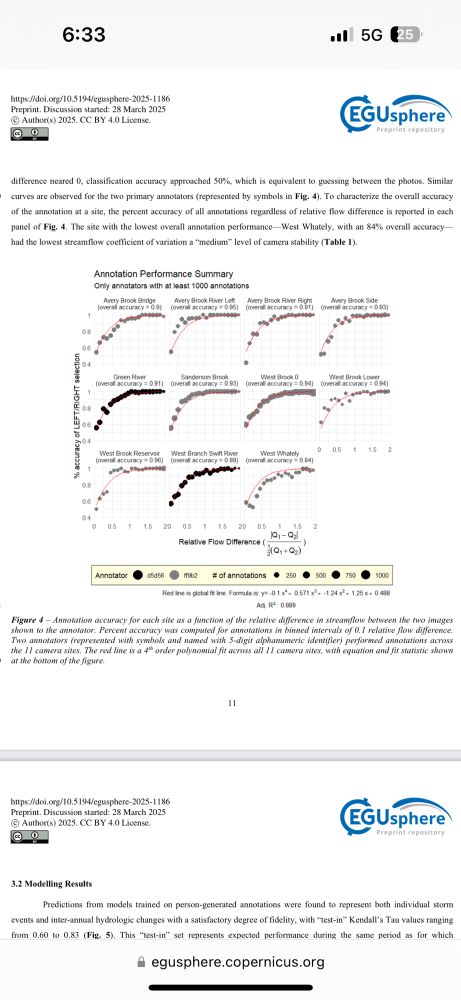
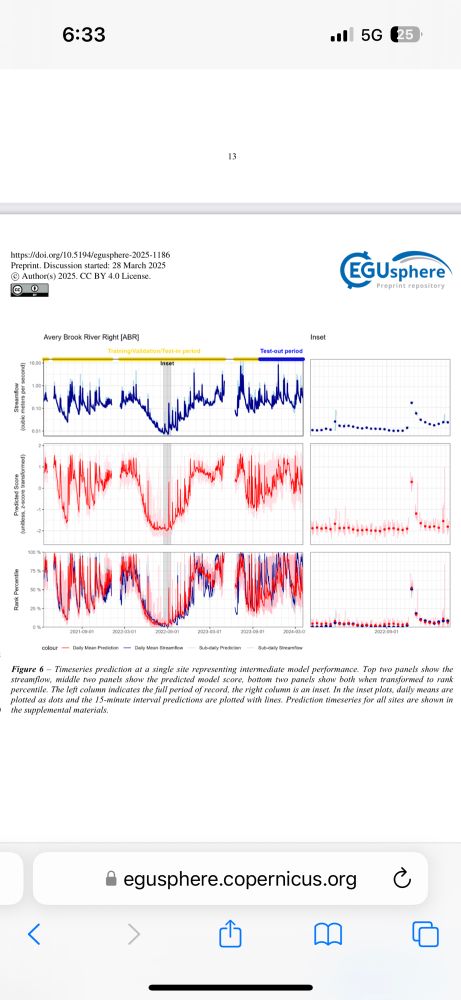
“A low-cost approach to monitoring streamflow dynamics in small, headwater streams using timelapse imagery and a deep learning model” egusphere.copernicus.org/preprints/20...
March 31, 2025 at 1:53 PM
“A low-cost approach to monitoring streamflow dynamics in small, headwater streams using timelapse imagery and a deep learning model” egusphere.copernicus.org/preprints/20...
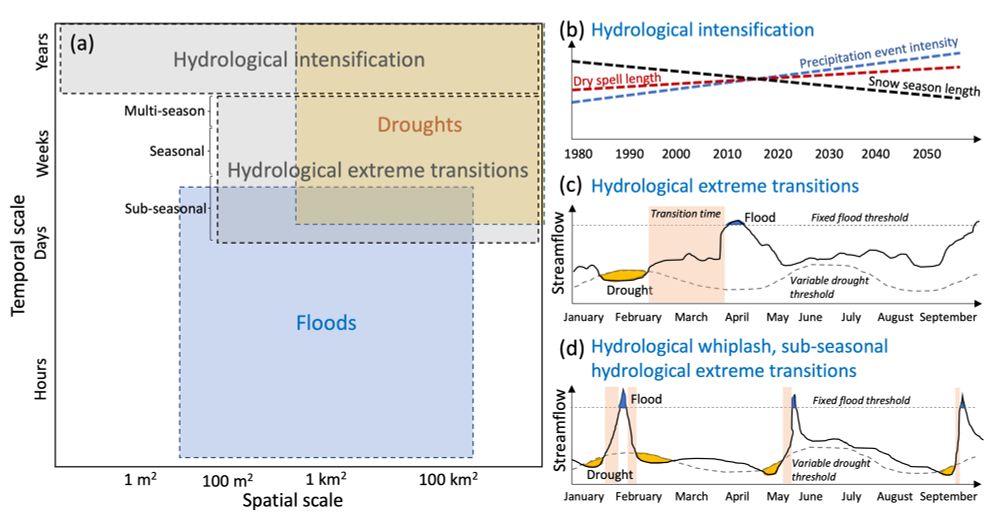
We (1) describe hydrological intensification and whiplash impacts, (2) introduce complexities in quantifying transitions, (3) discuss the processes controlling transitions and trends, (4) discuss considerations involved in modelling these transitions, (5) suggest priority research questions
March 20, 2025 at 12:10 PM
We (1) describe hydrological intensification and whiplash impacts, (2) introduce complexities in quantifying transitions, (3) discuss the processes controlling transitions and trends, (4) discuss considerations involved in modelling these transitions, (5) suggest priority research questions
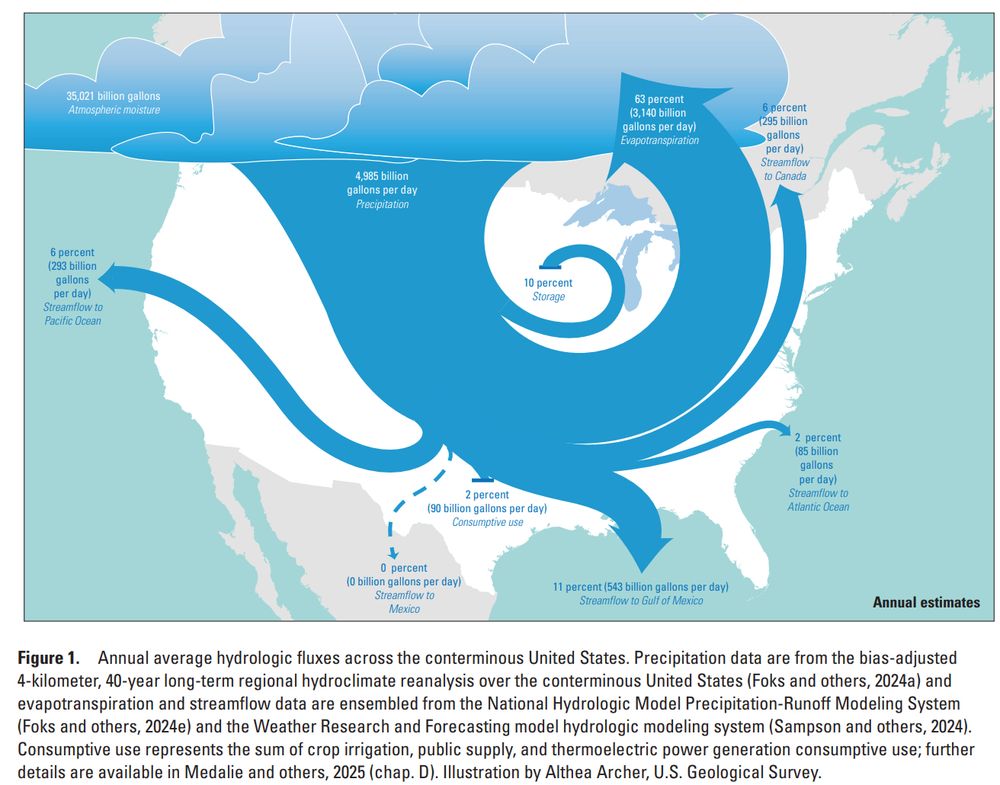
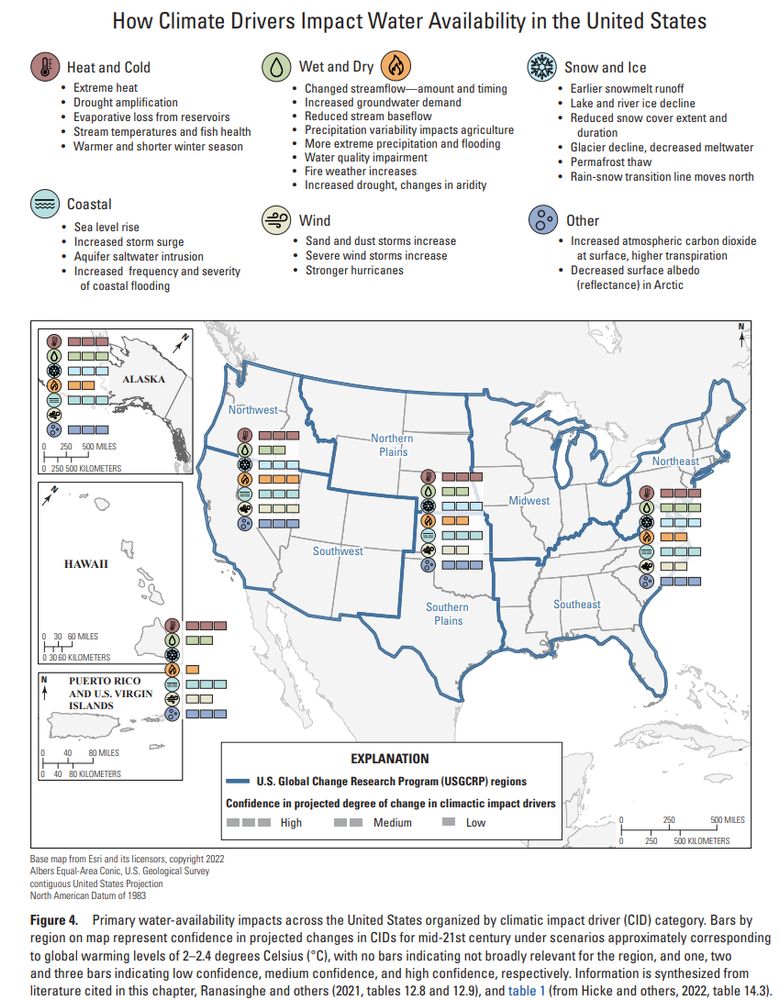
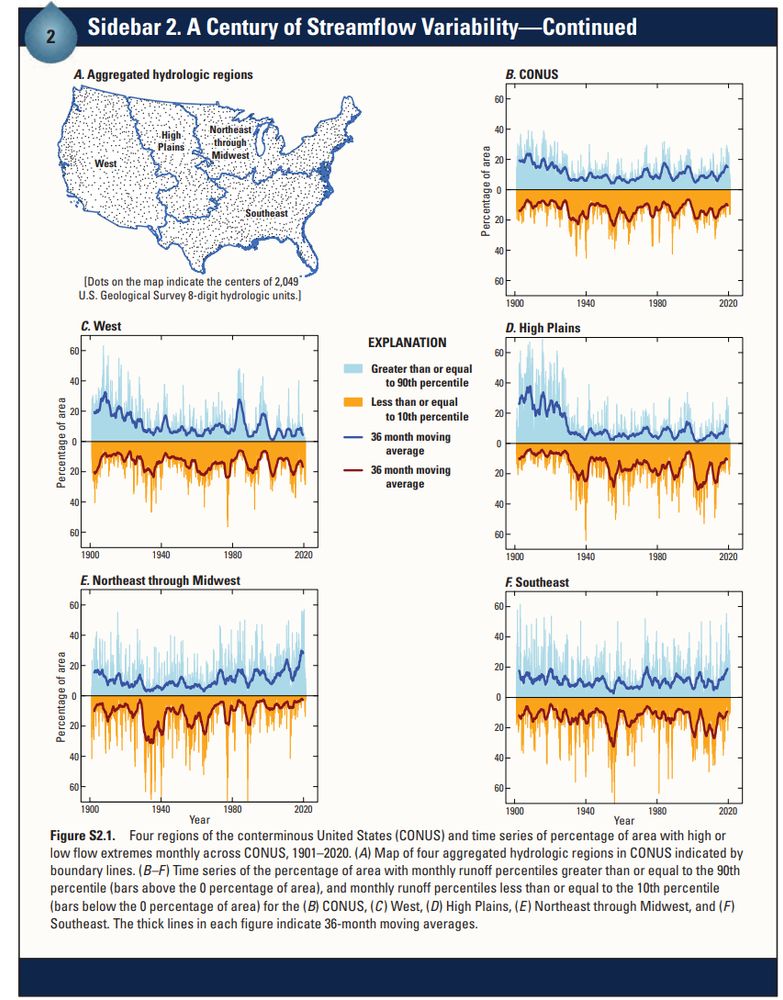
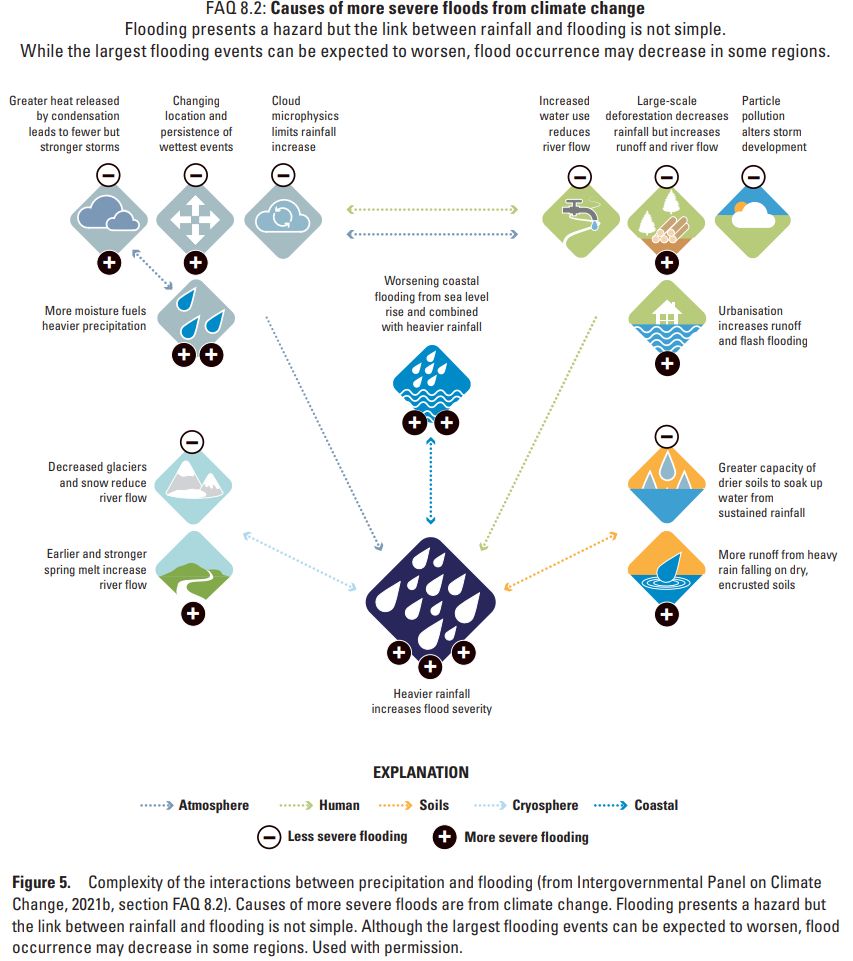
Even more to explore!
January 16, 2025 at 7:58 PM
Even more to explore!
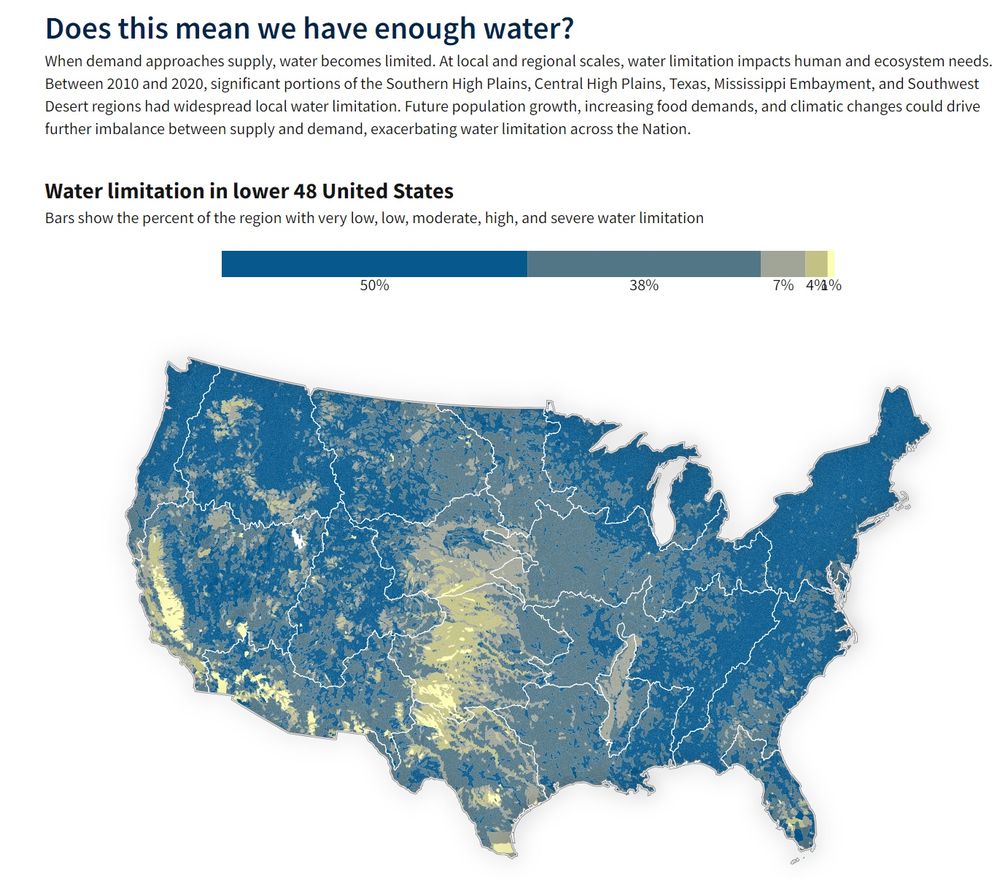
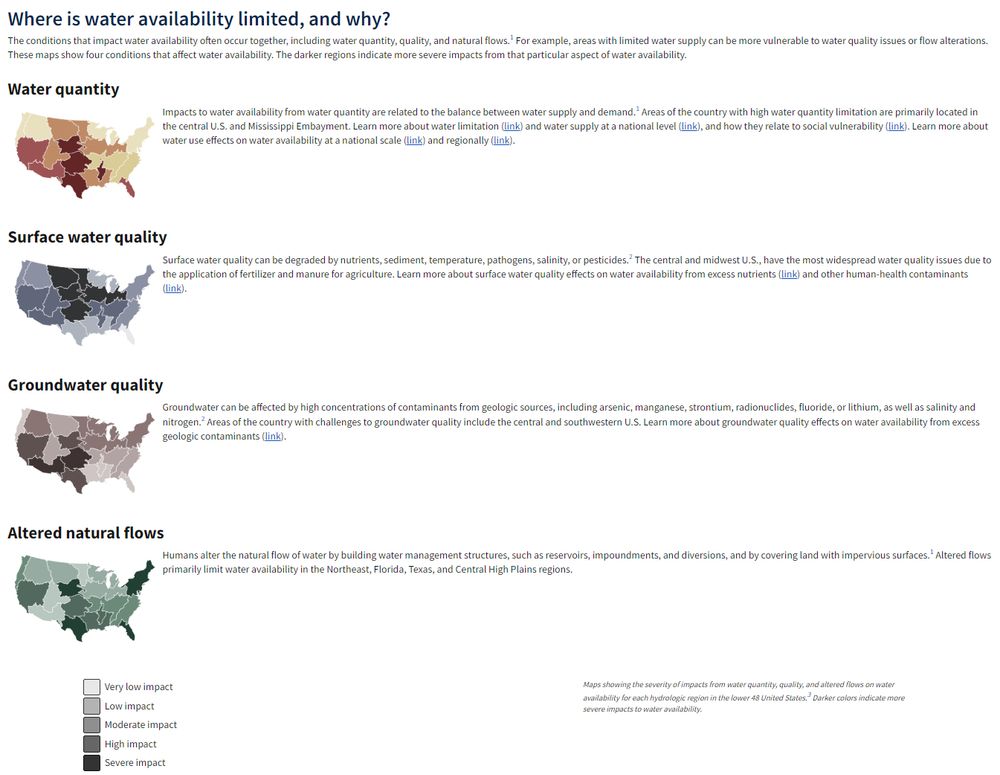
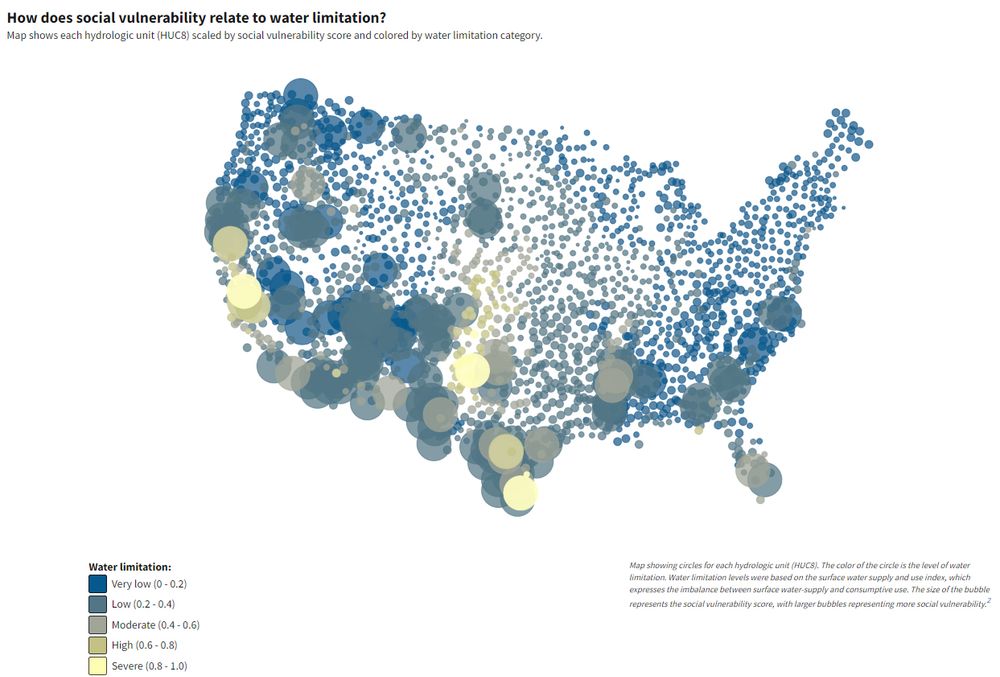
There’s so much fantastic information in this report for those in #sciencecommunication and #teaching, not to mention for all us water users and water enthusiasts!
January 16, 2025 at 7:58 PM
There’s so much fantastic information in this report for those in #sciencecommunication and #teaching, not to mention for all us water users and water enthusiasts!
Learning about drought impacts for aquatic ecosystems in the Southeastern US over the next couple days, and presenting on the upcoming hydrological drought forecasting tool we’ll be rolling out for the conterminous US later this year!


January 7, 2025 at 9:03 PM
Learning about drought impacts for aquatic ecosystems in the Southeastern US over the next couple days, and presenting on the upcoming hydrological drought forecasting tool we’ll be rolling out for the conterminous US later this year!