


Helena Klara Jambor
@helenajambor.bsky.social
Data Visualization & Biomedical Science. PhD in biology, trained in art, Associate Prof
Writes here: https://helenajamborwrites.netlify.app/
Writes here: https://helenajamborwrites.netlify.app/
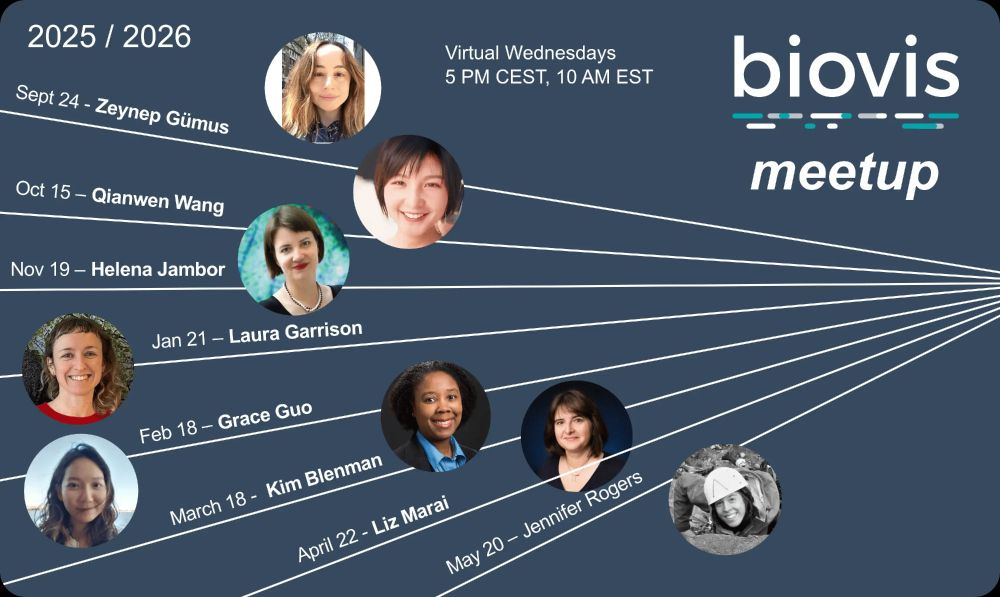
⏰ tomorrow, Nov 18, 5pm Berlin/4pm London
“Data Vis for Cancer Patient Education“ - a #DataVis #BioVis talk
Link & Abstract: alt-text and also:
biovis.net/2025/meetup/ (right under picture)
“Data Vis for Cancer Patient Education“ - a #DataVis #BioVis talk
Link & Abstract: alt-text and also:
biovis.net/2025/meetup/ (right under picture)

November 18, 2025 at 9:53 AM
⏰ tomorrow, Nov 18, 5pm Berlin/4pm London
“Data Vis for Cancer Patient Education“ - a #DataVis #BioVis talk
Link & Abstract: alt-text and also:
biovis.net/2025/meetup/ (right under picture)
“Data Vis for Cancer Patient Education“ - a #DataVis #BioVis talk
Link & Abstract: alt-text and also:
biovis.net/2025/meetup/ (right under picture)
Tatata-tarte tatin! My annual tradition of making the most fancy apple pie there is: fluffy pastry and sour, caramelized apples. I had 3 (!) slices 😍
Love my #staub pan with removable handles...
Love my #staub pan with removable handles...


November 12, 2025 at 7:27 PM
Tatata-tarte tatin! My annual tradition of making the most fancy apple pie there is: fluffy pastry and sour, caramelized apples. I had 3 (!) slices 😍
Love my #staub pan with removable handles...
Love my #staub pan with removable handles...
see you in #Cologne: Sunday, 27th I present our study
on #VisualAids in oncology patient communication – and how we continue!
(and I will sneak away to learn about #RomanHistory, #Agrippina and see the #Dionysus mosaic!)
#DGHO #dhgo2025 #oncology #hematology
on #VisualAids in oncology patient communication – and how we continue!
(and I will sneak away to learn about #RomanHistory, #Agrippina and see the #Dionysus mosaic!)
#DGHO #dhgo2025 #oncology #hematology

October 22, 2025 at 3:17 PM
see you in #Cologne: Sunday, 27th I present our study
on #VisualAids in oncology patient communication – and how we continue!
(and I will sneak away to learn about #RomanHistory, #Agrippina and see the #Dionysus mosaic!)
#DGHO #dhgo2025 #oncology #hematology
on #VisualAids in oncology patient communication – and how we continue!
(and I will sneak away to learn about #RomanHistory, #Agrippina and see the #Dionysus mosaic!)
#DGHO #dhgo2025 #oncology #hematology
New to me, biking up mountains. Did lots of hikes, today 1000m up up up riding!! 💪🚲 Best company @jamessaenz.bsky.social #grisons


October 19, 2025 at 5:31 PM
New to me, biking up mountains. Did lots of hikes, today 1000m up up up riding!! 💪🚲 Best company @jamessaenz.bsky.social #grisons
🚨 tomorrow, 15th of October* at 5pm Berlin/4pm
London
“Collaborating with Biomedical AI through Visual Explanations and Interactive Guidance“ - a #DataVis #BioVis talk by
Qianwen Wang, Univ Minnesota
Link: biovis.net/2025/meetup/ (right under picture)
Abstract: see alt-text
London
“Collaborating with Biomedical AI through Visual Explanations and Interactive Guidance“ - a #DataVis #BioVis talk by
Qianwen Wang, Univ Minnesota
Link: biovis.net/2025/meetup/ (right under picture)
Abstract: see alt-text
October 14, 2025 at 5:08 AM
🚨 tomorrow, 15th of October* at 5pm Berlin/4pm
London
“Collaborating with Biomedical AI through Visual Explanations and Interactive Guidance“ - a #DataVis #BioVis talk by
Qianwen Wang, Univ Minnesota
Link: biovis.net/2025/meetup/ (right under picture)
Abstract: see alt-text
London
“Collaborating with Biomedical AI through Visual Explanations and Interactive Guidance“ - a #DataVis #BioVis talk by
Qianwen Wang, Univ Minnesota
Link: biovis.net/2025/meetup/ (right under picture)
Abstract: see alt-text
Continuing my irregular contributions to "very unfortunate #GraphicalAbtract ": an oligomer with lots of fans in 1933 Germany... 🤨

October 9, 2025 at 2:44 PM
Continuing my irregular contributions to "very unfortunate #GraphicalAbtract ": an oligomer with lots of fans in 1933 Germany... 🤨
Original post: floss.social/@fdroidorg/1...

September 30, 2025 at 10:21 AM
Original post: floss.social/@fdroidorg/1...
Original post: mas.to/@JoergAltSJ/...

September 28, 2025 at 12:00 PM
Original post: mas.to/@JoergAltSJ/...
#BioVis meetups 2025/26 start tomorrow, Sept 24th!
Zeynep H. Gümüş, Mount Sinai, NY:
“From Samples to Populations: Interactive Visualizations of Multi-Omics Data at Scale“
link biovis.net/2025/meetup/
All seminars Wed 5pm berlin/11am est, for updates: dm me for mailing list
#DataVis
Zeynep H. Gümüş, Mount Sinai, NY:
“From Samples to Populations: Interactive Visualizations of Multi-Omics Data at Scale“
link biovis.net/2025/meetup/
All seminars Wed 5pm berlin/11am est, for updates: dm me for mailing list
#DataVis
September 23, 2025 at 5:35 AM
#BioVis meetups 2025/26 start tomorrow, Sept 24th!
Zeynep H. Gümüş, Mount Sinai, NY:
“From Samples to Populations: Interactive Visualizations of Multi-Omics Data at Scale“
link biovis.net/2025/meetup/
All seminars Wed 5pm berlin/11am est, for updates: dm me for mailing list
#DataVis
Zeynep H. Gümüş, Mount Sinai, NY:
“From Samples to Populations: Interactive Visualizations of Multi-Omics Data at Scale“
link biovis.net/2025/meetup/
All seminars Wed 5pm berlin/11am est, for updates: dm me for mailing list
#DataVis

September 19, 2025 at 8:32 PM
What a week: invited talk at @embl.org course and workshop for #SwissInstituteBioinformatics, to poster presentation once again myself, waiting (a little anxiously) for someone to come take a look.
In science we constantly circle between being an expert and learner, keeps us humble!
In science we constantly circle between being an expert and learner, keeps us humble!


September 12, 2025 at 10:02 AM
What a week: invited talk at @embl.org course and workshop for #SwissInstituteBioinformatics, to poster presentation once again myself, waiting (a little anxiously) for someone to come take a look.
In science we constantly circle between being an expert and learner, keeps us humble!
In science we constantly circle between being an expert and learner, keeps us humble!
@nigelblue.bsky.social is on blsky!
Everyone, follow & expect some light and fun data viz, badly needed these days... 😀
#MonstrousCosts is an all time favorite in teaching!
Everyone, follow & expect some light and fun data viz, badly needed these days... 😀
#MonstrousCosts is an all time favorite in teaching!


September 7, 2025 at 3:25 PM
@nigelblue.bsky.social is on blsky!
Everyone, follow & expect some light and fun data viz, badly needed these days... 😀
#MonstrousCosts is an all time favorite in teaching!
Everyone, follow & expect some light and fun data viz, badly needed these days... 😀
#MonstrousCosts is an all time favorite in teaching!
Ahhh... what a great #GraphicalAbstract - supposedly about aging. But possibly about more... 😂
#SciComm #ScienceVisualization
#SciComm #ScienceVisualization

August 25, 2025 at 2:19 PM
Ahhh... what a great #GraphicalAbstract - supposedly about aging. But possibly about more... 😂
#SciComm #ScienceVisualization
#SciComm #ScienceVisualization
Absolutely :=)


August 15, 2025 at 11:31 AM
Absolutely :=)
SneakPeak - BioVis meetups 2025/26!
Wednesdays, monthly, 4pm berlin, 10am est
Stay updated/get links: send a mail with subject: subscribe to: biovis-meetup-request@groups.tu-dresden.de (or me)
Wednesdays, monthly, 4pm berlin, 10am est
Stay updated/get links: send a mail with subject: subscribe to: biovis-meetup-request@groups.tu-dresden.de (or me)

August 12, 2025 at 1:40 PM
SneakPeak - BioVis meetups 2025/26!
Wednesdays, monthly, 4pm berlin, 10am est
Stay updated/get links: send a mail with subject: subscribe to: biovis-meetup-request@groups.tu-dresden.de (or me)
Wednesdays, monthly, 4pm berlin, 10am est
Stay updated/get links: send a mail with subject: subscribe to: biovis-meetup-request@groups.tu-dresden.de (or me)
Don't get your hopes up ladies, data shows your changes are low and not increasing either.. (as per dfg own numbers published in June 25) 🥳 🥳

July 10, 2025 at 8:26 AM
Don't get your hopes up ladies, data shows your changes are low and not increasing either.. (as per dfg own numbers published in June 25) 🥳 🥳

July 9, 2025 at 7:52 AM

July 9, 2025 at 7:51 AM
Du willst #DatenVisualisieren? Checklisten helfen.
🇨🇭 Als Dank an meine Studierenden jetzt auf #Bünderdeutsch und #Rumansch - im Dialekt macht Statistik viel mehr Spass!
#Grisons #Schweiz #DataViz
helenajamborwrites.netlify.app/posts/25-7_g...
English V: www.nature.com/articles/s41...
🇨🇭 Als Dank an meine Studierenden jetzt auf #Bünderdeutsch und #Rumansch - im Dialekt macht Statistik viel mehr Spass!
#Grisons #Schweiz #DataViz
helenajamborwrites.netlify.app/posts/25-7_g...
English V: www.nature.com/articles/s41...


July 9, 2025 at 7:48 AM
Du willst #DatenVisualisieren? Checklisten helfen.
🇨🇭 Als Dank an meine Studierenden jetzt auf #Bünderdeutsch und #Rumansch - im Dialekt macht Statistik viel mehr Spass!
#Grisons #Schweiz #DataViz
helenajamborwrites.netlify.app/posts/25-7_g...
English V: www.nature.com/articles/s41...
🇨🇭 Als Dank an meine Studierenden jetzt auf #Bünderdeutsch und #Rumansch - im Dialekt macht Statistik viel mehr Spass!
#Grisons #Schweiz #DataViz
helenajamborwrites.netlify.app/posts/25-7_g...
English V: www.nature.com/articles/s41...
OUTTAKES of my figure checklist (www.nature.com/articles/s41...) - many important and good references that explain why we do things the way we do in charts - e.g. why #rainbowcolors were replaced with #viridis.
helenajamborwrites.netlify.app/posts/25-7_c...
PS outtakes or directors cut?
helenajamborwrites.netlify.app/posts/25-7_c...
PS outtakes or directors cut?


July 1, 2025 at 3:44 PM
OUTTAKES of my figure checklist (www.nature.com/articles/s41...) - many important and good references that explain why we do things the way we do in charts - e.g. why #rainbowcolors were replaced with #viridis.
helenajamborwrites.netlify.app/posts/25-7_c...
PS outtakes or directors cut?
helenajamborwrites.netlify.app/posts/25-7_c...
PS outtakes or directors cut?
Here we go!
@jesseveenvliet.bsky.social @paveltomancak.bsky.social (not sure, do we need the tagging or not!?)
@jesseveenvliet.bsky.social @paveltomancak.bsky.social (not sure, do we need the tagging or not!?)

June 22, 2025 at 7:06 PM
Here we go!
@jesseveenvliet.bsky.social @paveltomancak.bsky.social (not sure, do we need the tagging or not!?)
@jesseveenvliet.bsky.social @paveltomancak.bsky.social (not sure, do we need the tagging or not!?)
for non-normal distributions with many measurements, you could use violin or histogram
and, because we are attached to tradition, many people use bar overlaid with dots as a compromise, like these examples:
and, because we are attached to tradition, many people use bar overlaid with dots as a compromise, like these examples:

June 20, 2025 at 5:51 AM
for non-normal distributions with many measurements, you could use violin or histogram
and, because we are attached to tradition, many people use bar overlaid with dots as a compromise, like these examples:
and, because we are attached to tradition, many people use bar overlaid with dots as a compromise, like these examples:
If you *know* you got a normal distribution (example B from above) and many measurements, you could then use boxplots, or boxplot overlaid with data points:


June 20, 2025 at 5:47 AM
If you *know* you got a normal distribution (example B from above) and many measurements, you could then use boxplots, or boxplot overlaid with data points:
Then, as soon as you make *several measurements* per category, you got a distribution. We then want to also know the actual values for *each* measured point, hence dot plots.
A bar actually hides the distribution, see example. And an example of a summary dot plot from @simonereber.bsky.social
A bar actually hides the distribution, see example. And an example of a summary dot plot from @simonereber.bsky.social


June 20, 2025 at 5:45 AM
Then, as soon as you make *several measurements* per category, you got a distribution. We then want to also know the actual values for *each* measured point, hence dot plots.
A bar actually hides the distribution, see example. And an example of a summary dot plot from @simonereber.bsky.social
A bar actually hides the distribution, see example. And an example of a summary dot plot from @simonereber.bsky.social
The naming is a problem, by tradition biologists called summary stat plots "bar plot".
An simple bar chart shows one discrete value per category (A, B, C... )
My friend @simonereber.bsky.social just published a wonderful paper in @natcellbio.nature.com - hers is used for %
An simple bar chart shows one discrete value per category (A, B, C... )
My friend @simonereber.bsky.social just published a wonderful paper in @natcellbio.nature.com - hers is used for %


June 20, 2025 at 5:40 AM
The naming is a problem, by tradition biologists called summary stat plots "bar plot".
An simple bar chart shows one discrete value per category (A, B, C... )
My friend @simonereber.bsky.social just published a wonderful paper in @natcellbio.nature.com - hers is used for %
An simple bar chart shows one discrete value per category (A, B, C... )
My friend @simonereber.bsky.social just published a wonderful paper in @natcellbio.nature.com - hers is used for %