


Hannah Keenan
@hannahkeenan.bsky.social
Associate Director at Institute for Government, and former civil servant (cabinet office, dfid). Interested in all things Civil Service. And mountains.
^ featuring wise words from my colleague @alexgathomas.bsky.social

September 2, 2025 at 5:42 PM
^ featuring wise words from my colleague @alexgathomas.bsky.social
Think 2 big risks in No.10 shake-up are (a) more big figures & no clarity on who does what means duplicative work gumming up the system, and (b) the 'change the way the state works' bit of missions gets totally cannibalised by the 'deliver the plan for change targets' bit of missions.

September 2, 2025 at 7:46 AM
Think 2 big risks in No.10 shake-up are (a) more big figures & no clarity on who does what means duplicative work gumming up the system, and (b) the 'change the way the state works' bit of missions gets totally cannibalised by the 'deliver the plan for change targets' bit of missions.
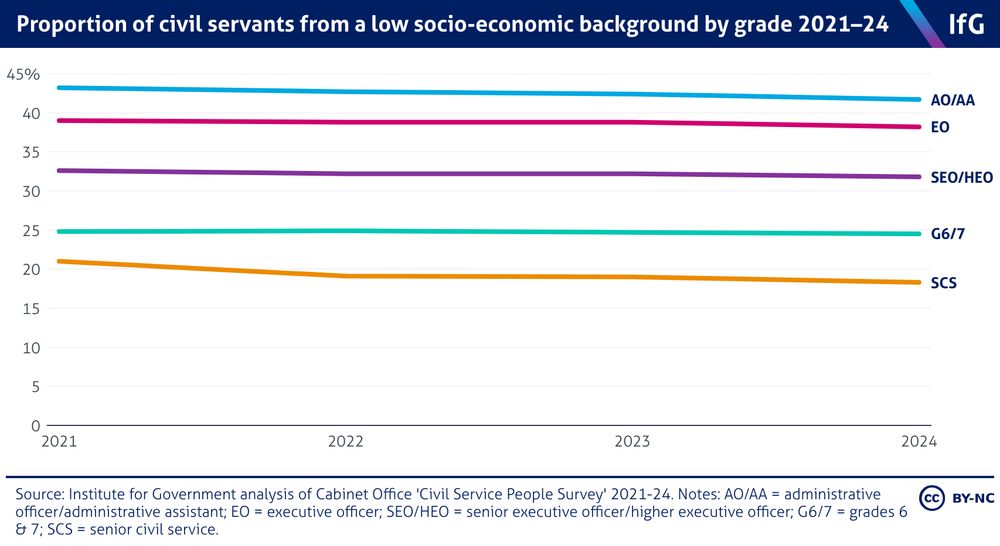
Proportion of civil servants from low SEB by seniority. It is v striking to me...
1 - how flat the lines are. Almost no change over time?
2 - how perfectly stacked they are. Consistently smaller proportion of low SEB civil servants at each grade.
(stats are from people survey so not perfect)
1 - how flat the lines are. Almost no change over time?
2 - how perfectly stacked they are. Consistently smaller proportion of low SEB civil servants at each grade.
(stats are from people survey so not perfect)
August 1, 2025 at 4:28 PM
Proportion of civil servants from low SEB by seniority. It is v striking to me...
1 - how flat the lines are. Almost no change over time?
2 - how perfectly stacked they are. Consistently smaller proportion of low SEB civil servants at each grade.
(stats are from people survey so not perfect)
1 - how flat the lines are. Almost no change over time?
2 - how perfectly stacked they are. Consistently smaller proportion of low SEB civil servants at each grade.
(stats are from people survey so not perfect)
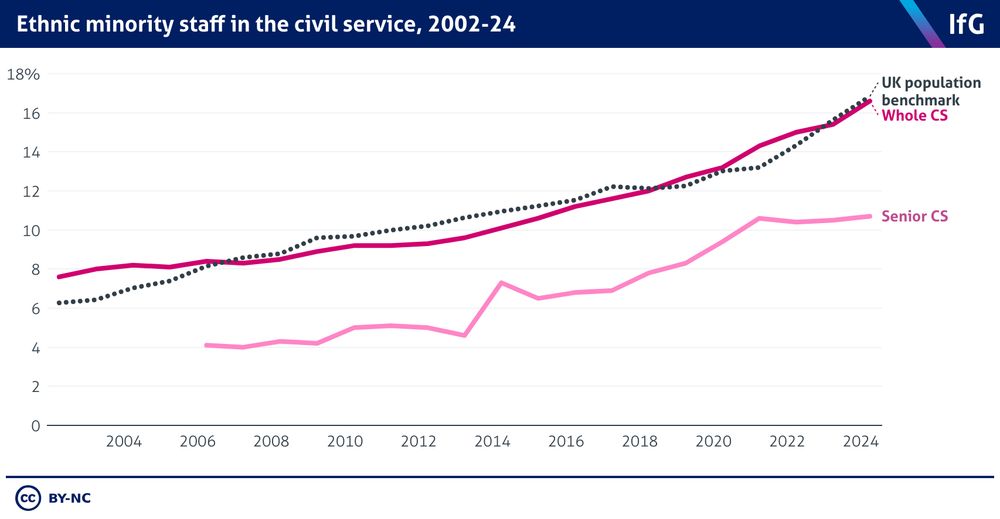
The numbers on socio-economic background of civil servants really don't tell a story of much change over time - v. striking compared to e.g. ethnic minority staff. (plz note different timeframes, but point holds).
Alex's thread has a good breakdown of socio-economic background by grade, and more!
Alex's thread has a good breakdown of socio-economic background by grade, and more!

August 1, 2025 at 1:01 PM
The numbers on socio-economic background of civil servants really don't tell a story of much change over time - v. striking compared to e.g. ethnic minority staff. (plz note different timeframes, but point holds).
Alex's thread has a good breakdown of socio-economic background by grade, and more!
Alex's thread has a good breakdown of socio-economic background by grade, and more!
Given there is less churn between departments this year, it's interesting to see who is moving within the civil service - HMT staff seem to be very appointable what is presumably a competitive field, with most of their leavers staying inside the civil service.

July 30, 2025 at 5:26 PM
Given there is less churn between departments this year, it's interesting to see who is moving within the civil service - HMT staff seem to be very appointable what is presumably a competitive field, with most of their leavers staying inside the civil service.
2025 civil service turnover falls because fewer internal transfers. If really less churn then great. But...pressure to cut headcount can mean broad recruitment freezes (bad!) and managers forced to look within the dept first to fill roles - we don't see that churn (inside a dept) in the stats.

July 30, 2025 at 5:26 PM
2025 civil service turnover falls because fewer internal transfers. If really less churn then great. But...pressure to cut headcount can mean broad recruitment freezes (bad!) and managers forced to look within the dept first to fill roles - we don't see that churn (inside a dept) in the stats.
Outstanding translation from the LRB.

May 24, 2025 at 4:58 PM
Outstanding translation from the LRB.
7 - Grade structure in CS has become more senior since 2010. Some of that may be grade inflation. This, and CS growth, explains why the overall pay bill is about back to 2010 levels, while each person is being paid less in real terms. Absent the grade shift, total bill would be lower.

May 23, 2025 at 12:36 PM
7 - Grade structure in CS has become more senior since 2010. Some of that may be grade inflation. This, and CS growth, explains why the overall pay bill is about back to 2010 levels, while each person is being paid less in real terms. Absent the grade shift, total bill would be lower.
6 - Depts have flexibility in how they award that across grades. Junior staff have seen bigger awards in the past (e.g. 23/24 remit gave another 0.5% to be targeted at lower pay bands). Overall civil service pay in 2024 was almost back to 2010 levels, but each grade was being paid less in real terms

May 23, 2025 at 12:36 PM
6 - Depts have flexibility in how they award that across grades. Junior staff have seen bigger awards in the past (e.g. 23/24 remit gave another 0.5% to be targeted at lower pay bands). Overall civil service pay in 2024 was almost back to 2010 levels, but each grade was being paid less in real terms
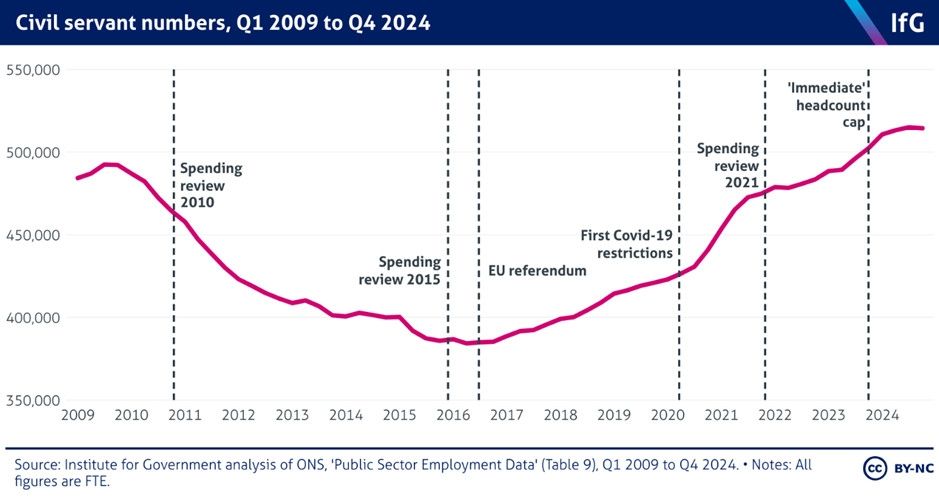
@alaintolhurst.bsky.social mentions on the podcast an IfG graph on headcount numbers - my wonderful colleague @teodorgrama.bsky.social updated this yesterday and you can see our explainer here www.instituteforgovernment.org.uk/explainer/ci...
March 21, 2025 at 12:45 PM
@alaintolhurst.bsky.social mentions on the podcast an IfG graph on headcount numbers - my wonderful colleague @teodorgrama.bsky.social updated this yesterday and you can see our explainer here www.instituteforgovernment.org.uk/explainer/ci...