


Roel van der Ploeg
@grvanderploeg.bsky.social
PhD candidate in Biosystems Data Analysis at the University of Amsterdam (UvA) | Omics Data Integration | Statistical Modeling | Microbiome | grvanderploeg.com
(8/8) I hope that this was helpful. If you got this far, thank you very much for your interest. Feel free to DM me if you have any questions. Also check out my paper (https://buff.ly/4hDLpFw) and the parafac4microbiome R package (https://buff.ly/4hFVtOD) for more details.

parafac4microbiome: Exploratory analysis of longitudinal microbiome data using Parallel Factor Analysis
Studies investigating microbial temporal dynamics are increasingly common, leveraging longitudinal designs that collect microbial abundance data across multiple time points from the same subjects.…
buff.ly
January 31, 2025 at 7:01 PM
(8/8) I hope that this was helpful. If you got this far, thank you very much for your interest. Feel free to DM me if you have any questions. Also check out my paper (https://buff.ly/4hDLpFw) and the parafac4microbiome R package (https://buff.ly/4hFVtOD) for more details.
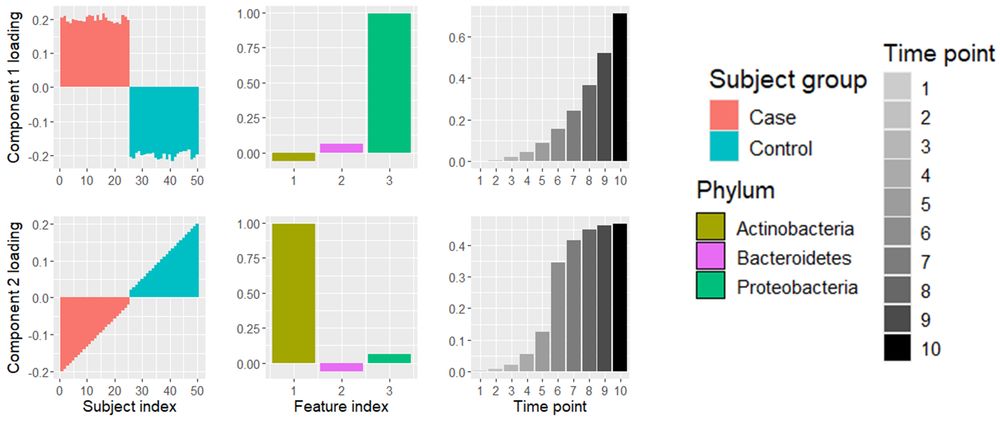
(7/8) PARAFAC reveals distinct microbial growth patterns: Proteobacteria show exponential growth in case subjects, while Actinobacteria exhibit a sigmoid growth curve in controls. This method interprets time-resolved microbial differences between groups more effectively than PCA.
January 31, 2025 at 7:01 PM
(7/8) PARAFAC reveals distinct microbial growth patterns: Proteobacteria show exponential growth in case subjects, while Actinobacteria exhibit a sigmoid growth curve in controls. This method interprets time-resolved microbial differences between groups more effectively than PCA.
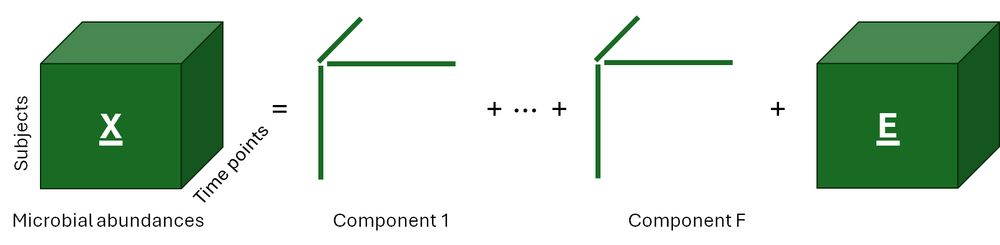
(6/8) In contrast, Parallel factor analysis decomposes a three-way data array into components with three loading vectors each: one for the subjects, one for the microbial relative abundances, and one for time.
January 31, 2025 at 7:01 PM
(6/8) In contrast, Parallel factor analysis decomposes a three-way data array into components with three loading vectors each: one for the subjects, one for the microbial relative abundances, and one for time.
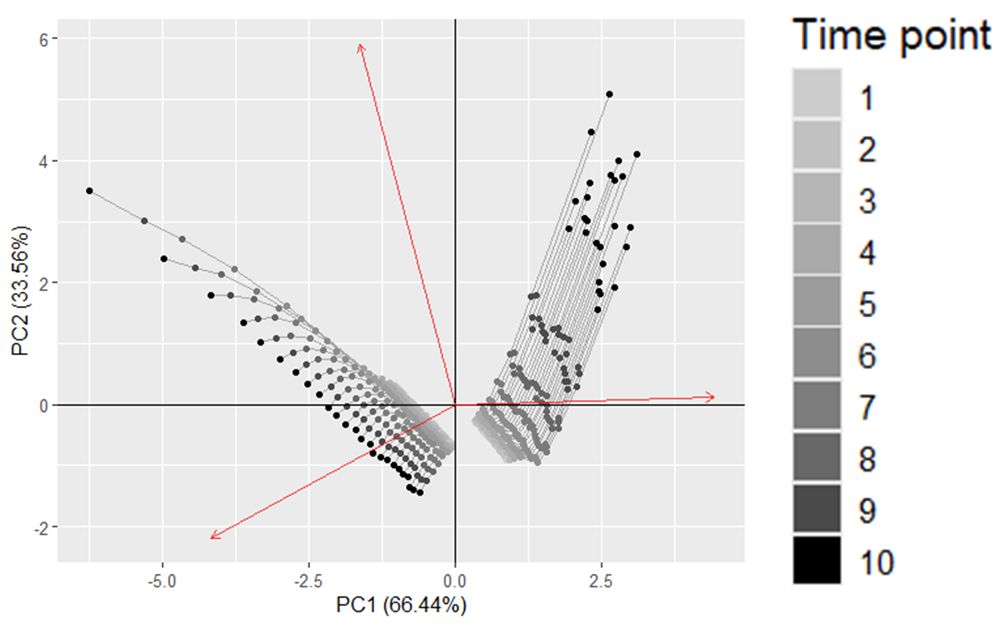
(5/8) The biplot of the PCA shows that the first principal component distinguishes case and control samples by Actinobacteria abundance, while the second separates different time points. However, the time profiles of each subject group remain unclear.
January 31, 2025 at 7:01 PM
(5/8) The biplot of the PCA shows that the first principal component distinguishes case and control samples by Actinobacteria abundance, while the second separates different time points. However, the time profiles of each subject group remain unclear.
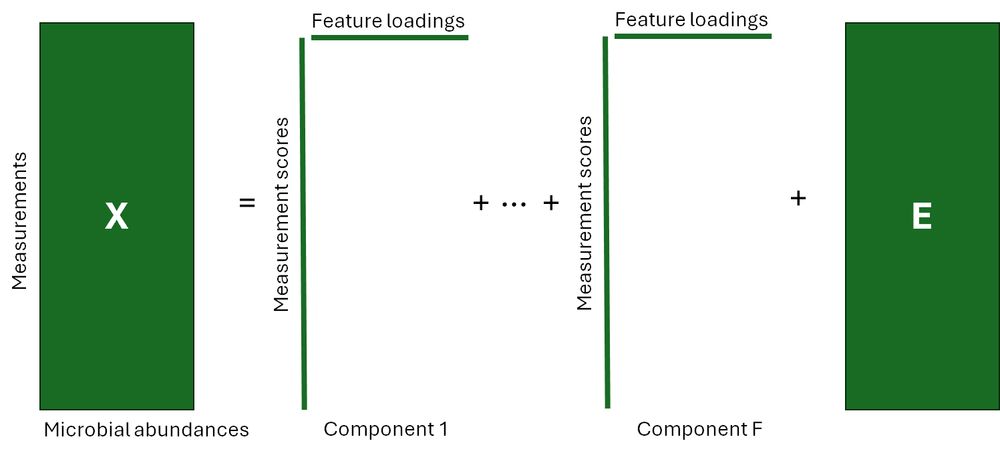
(4/8) Principal Component Analysis would decompose a two-way data table like this into components with scores for the measurements and loadings for the microbial relative abundances. This does not take the longitudinal study design into account.
January 31, 2025 at 7:01 PM
(4/8) Principal Component Analysis would decompose a two-way data table like this into components with scores for the measurements and loadings for the microbial relative abundances. This does not take the longitudinal study design into account.
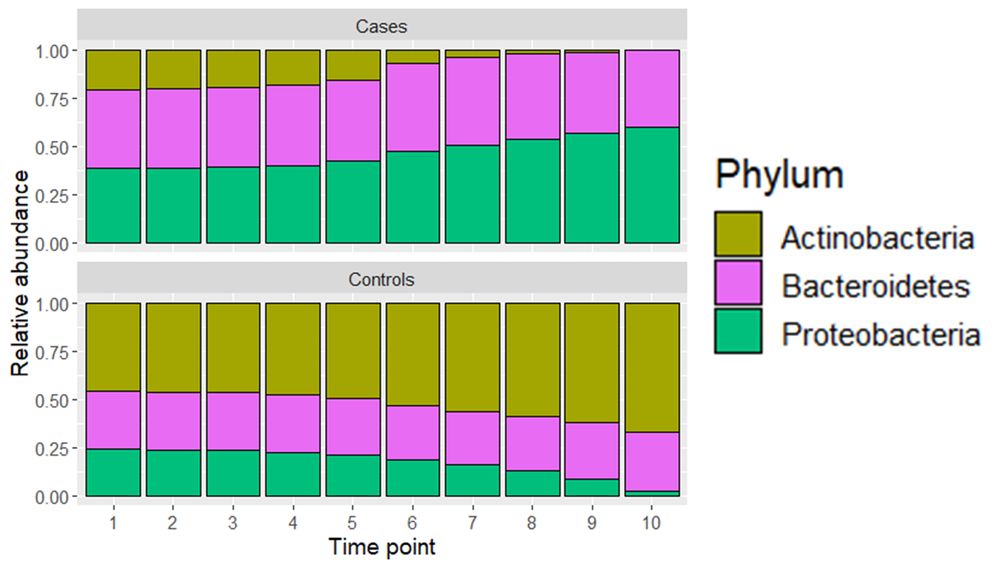
(3/8) The mock data contains three phyla corresponding to 25 case and 25 control subjects across 10 time points. Initially, all subjects are similar. By time point 10, case subjects show reduced Actinobacteria and increased Proteobacteria, while controls show the opposite.
January 31, 2025 at 7:01 PM
(3/8) The mock data contains three phyla corresponding to 25 case and 25 control subjects across 10 time points. Initially, all subjects are similar. By time point 10, case subjects show reduced Actinobacteria and increased Proteobacteria, while controls show the opposite.
(2/8) I will highlight how this helps using a a mock intervention dataset, where we have obtained count data of three phyla corresponding to 25 case and 25 control subjects across 10 time points.
January 31, 2025 at 7:01 PM
(2/8) I will highlight how this helps using a a mock intervention dataset, where we have obtained count data of three phyla corresponding to 25 case and 25 control subjects across 10 time points.
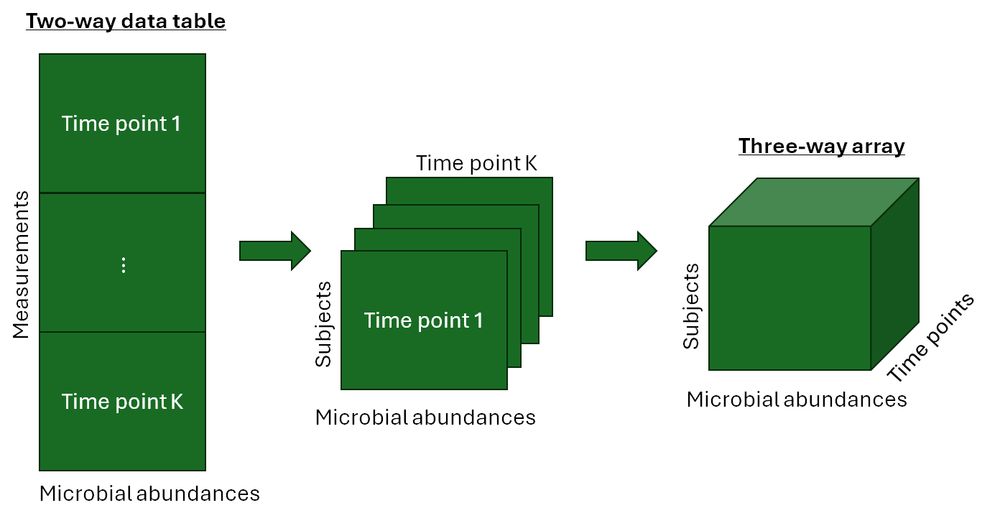
(1/8) Longitudinal microbiome data is shown as a two-way table with rows for the measurements (subject-time point combinations) and columns for microbial abundances, which can be transformed into a three-way array by adding time points as a third dimension.
January 31, 2025 at 7:01 PM
(1/8) Longitudinal microbiome data is shown as a two-way table with rows for the measurements (subject-time point combinations) and columns for microbial abundances, which can be transformed into a three-way array by adding time points as a third dimension.