


Greg Atkinson
@gregatki.bsky.social
Honorary Visiting Professor at LJMU. Exercise & Nutrition Science, Circadian Rhythms and Jet lag, Research Methods & Statistics, Bike Racing, BBC6-played singer-songwriter. https://scholar.google.co.uk/citations?user=8Gog69EAAAAJ&hl=en


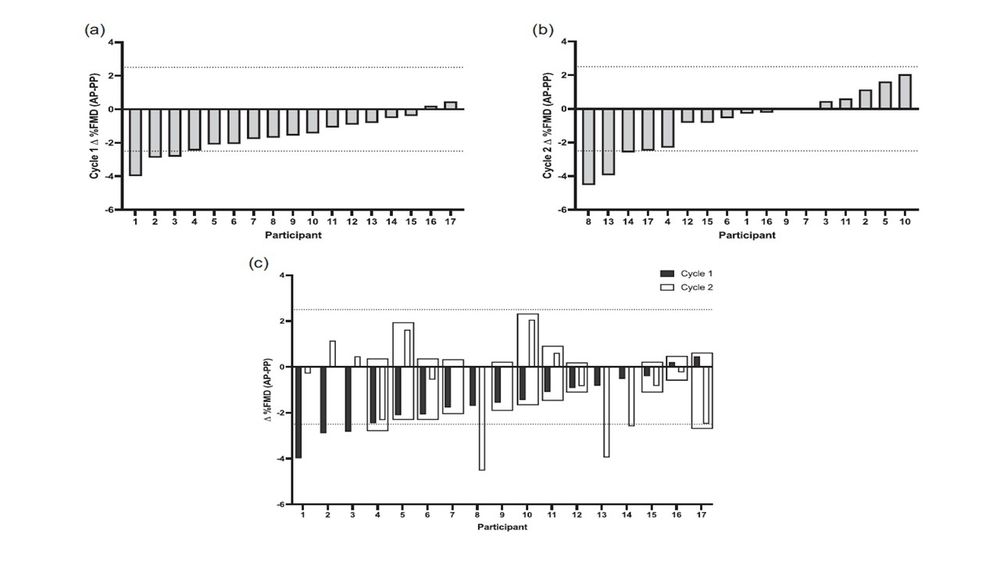
Waterfall plots can be drawn to show individual differences in FMD% change between phases. Look at Figure (a) for cycle 1. Differences in response are indicated but look at Figure (b) for cycle 2 - a completely different picture. There's no consistency at all between the 2 cycles (Figure c).
August 1, 2025 at 3:01 PM
Waterfall plots can be drawn to show individual differences in FMD% change between phases. Look at Figure (a) for cycle 1. Differences in response are indicated but look at Figure (b) for cycle 2 - a completely different picture. There's no consistency at all between the 2 cycles (Figure c).
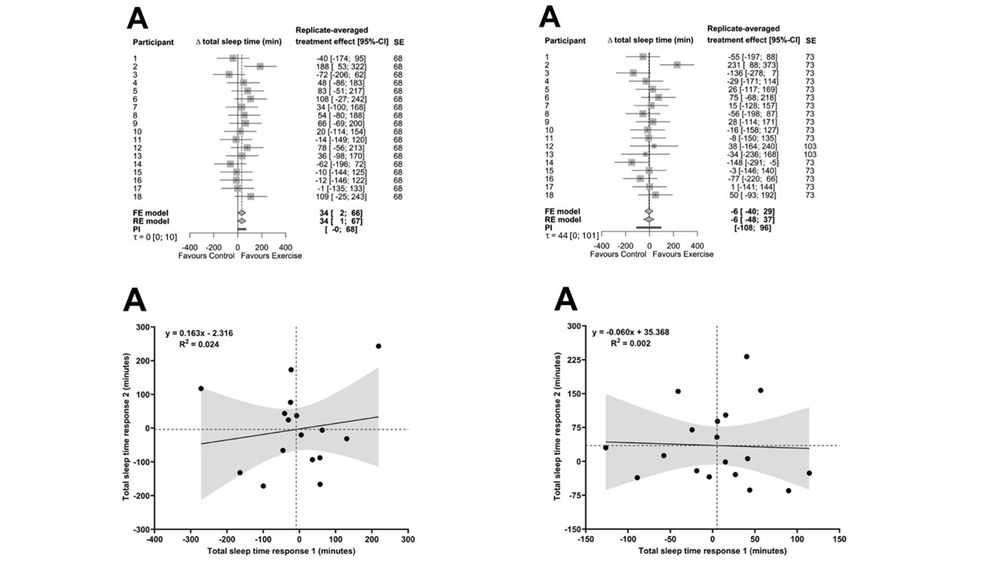
This variable was measured 5 times within each period. There's a person by time interaction in each period – even the control periods! Probably, serial effects in the repeated measurements are masquerading as individual differences in the outcome over the treatment period. This is not HTE.

July 15, 2025 at 1:37 PM
This variable was measured 5 times within each period. There's a person by time interaction in each period – even the control periods! Probably, serial effects in the repeated measurements are masquerading as individual differences in the outcome over the treatment period. This is not HTE.
We can look at our replicate crossover trials (a type of n-of-1 trial), some having repeated measurements within each period, to explore this question. We can take a variable for which there was little evidence of HTE. Between-treatment consistency is poor with no person by treatment interaction.
July 15, 2025 at 1:37 PM
We can look at our replicate crossover trials (a type of n-of-1 trial), some having repeated measurements within each period, to explore this question. We can take a variable for which there was little evidence of HTE. Between-treatment consistency is poor with no person by treatment interaction.
Type B “Count responders-flower with irrelevant jargon”. No repeat treatments (as in n-of-1 trials or replicate crossover) so person x treatment interaction can't be derived. No problem, use “highest density interval Bayesian decision rule.” to somehow get response distributions for individuals

March 20, 2025 at 9:23 AM
Type B “Count responders-flower with irrelevant jargon”. No repeat treatments (as in n-of-1 trials or replicate crossover) so person x treatment interaction can't be derived. No problem, use “highest density interval Bayesian decision rule.” to somehow get response distributions for individuals
Type A – “Just say it upfront – it must be true”. And in this case, also cite a paper (reference 5) in which true HTE was NOT confirmed to back up your assumption.


March 20, 2025 at 9:23 AM
Type A – “Just say it upfront – it must be true”. And in this case, also cite a paper (reference 5) in which true HTE was NOT confirmed to back up your assumption.
"Early papers" 3 and 5 are mine. I feel particularly old this morning 😀. I've always been intrigued by the "time saving/pacing" ideas. I think they have been under-researched.

March 19, 2025 at 7:18 AM
"Early papers" 3 and 5 are mine. I feel particularly old this morning 😀. I've always been intrigued by the "time saving/pacing" ideas. I think they have been under-researched.
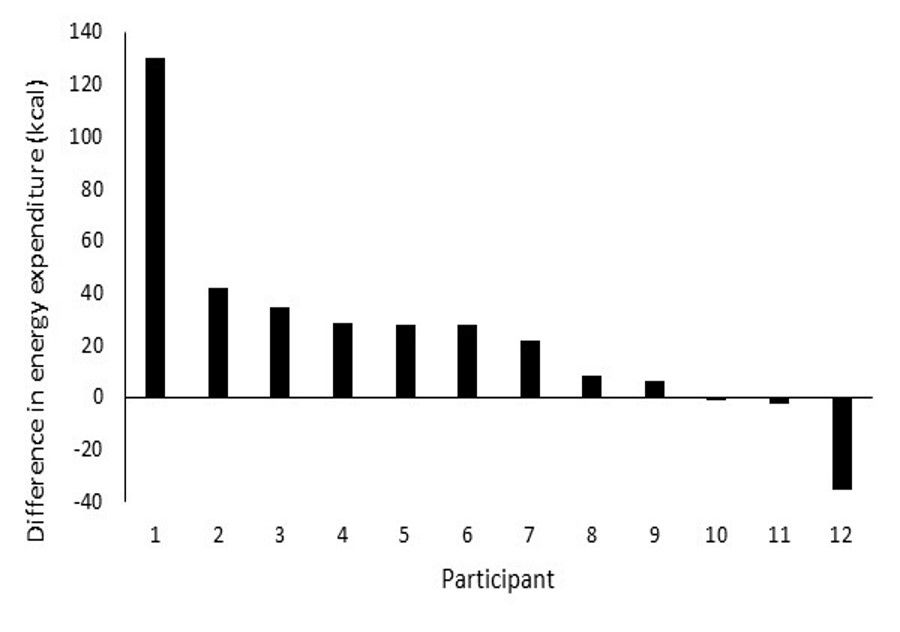
Looks good doesn't it? This is how some researchers conclude there are individual differences in response. Some might even say participant 1 is an "extreme responder". But just to say that this trial was actually a replicate crossover. Here's the second set of differences plotted in the same order.
March 12, 2025 at 7:38 AM
Looks good doesn't it? This is how some researchers conclude there are individual differences in response. Some might even say participant 1 is an "extreme responder". But just to say that this trial was actually a replicate crossover. Here's the second set of differences plotted in the same order.
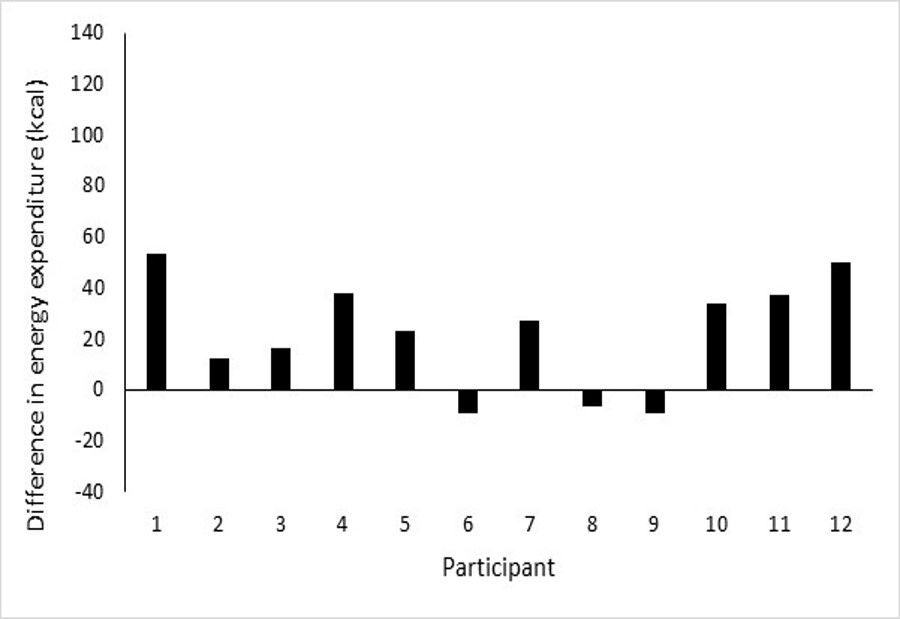
Waterfall plots present changes or differences for individual cases. While "show the data" is 👍, just a reminder that these plots don't inform about treatment response heterogeneity on their own. Here's a plot of the treatment-control differences in energy expenditure from a crossover trial.
March 12, 2025 at 7:38 AM
Waterfall plots present changes or differences for individual cases. While "show the data" is 👍, just a reminder that these plots don't inform about treatment response heterogeneity on their own. Here's a plot of the treatment-control differences in energy expenditure from a crossover trial.
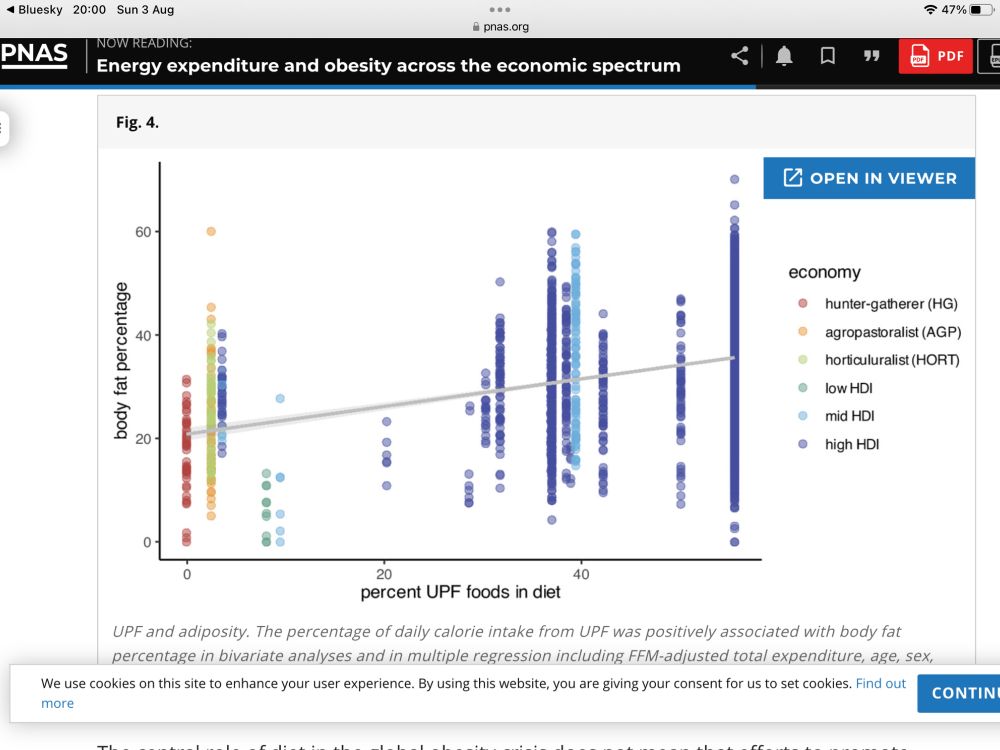
This piece is based on our paper, sciencedirect.com/science/arti..., which is well worth a read to see how statistics informs physiological inferences. The study of a very important physiological hypothesis being compromised by correlating X with Y-X and getting excited about a -ve slope.

January 28, 2025 at 7:47 AM
This piece is based on our paper, sciencedirect.com/science/arti..., which is well worth a read to see how statistics informs physiological inferences. The study of a very important physiological hypothesis being compromised by correlating X with Y-X and getting excited about a -ve slope.
Yet again, one of our Experimental Physiology reviews is referenced to a statement (see below), without the authors going on to say that what they ended up doing (responder counting & grouping on the outcome in a non-replicate crossover study) was not advised at all by us.

January 13, 2025 at 7:51 AM
Yet again, one of our Experimental Physiology reviews is referenced to a statement (see below), without the authors going on to say that what they ended up doing (responder counting & grouping on the outcome in a non-replicate crossover study) was not advised at all by us.