


Guillaume Noblet
@gnoblet.bsky.social
(he/him)
🔛 Now: humanitarian research #rstats #dataviz
🔙 Research on agricultural economics & history of statistics
🕸️ https://guillaume-noblet.com
🔛 Now: humanitarian research #rstats #dataviz
🔙 Research on agricultural economics & history of statistics
🕸️ https://guillaume-noblet.com
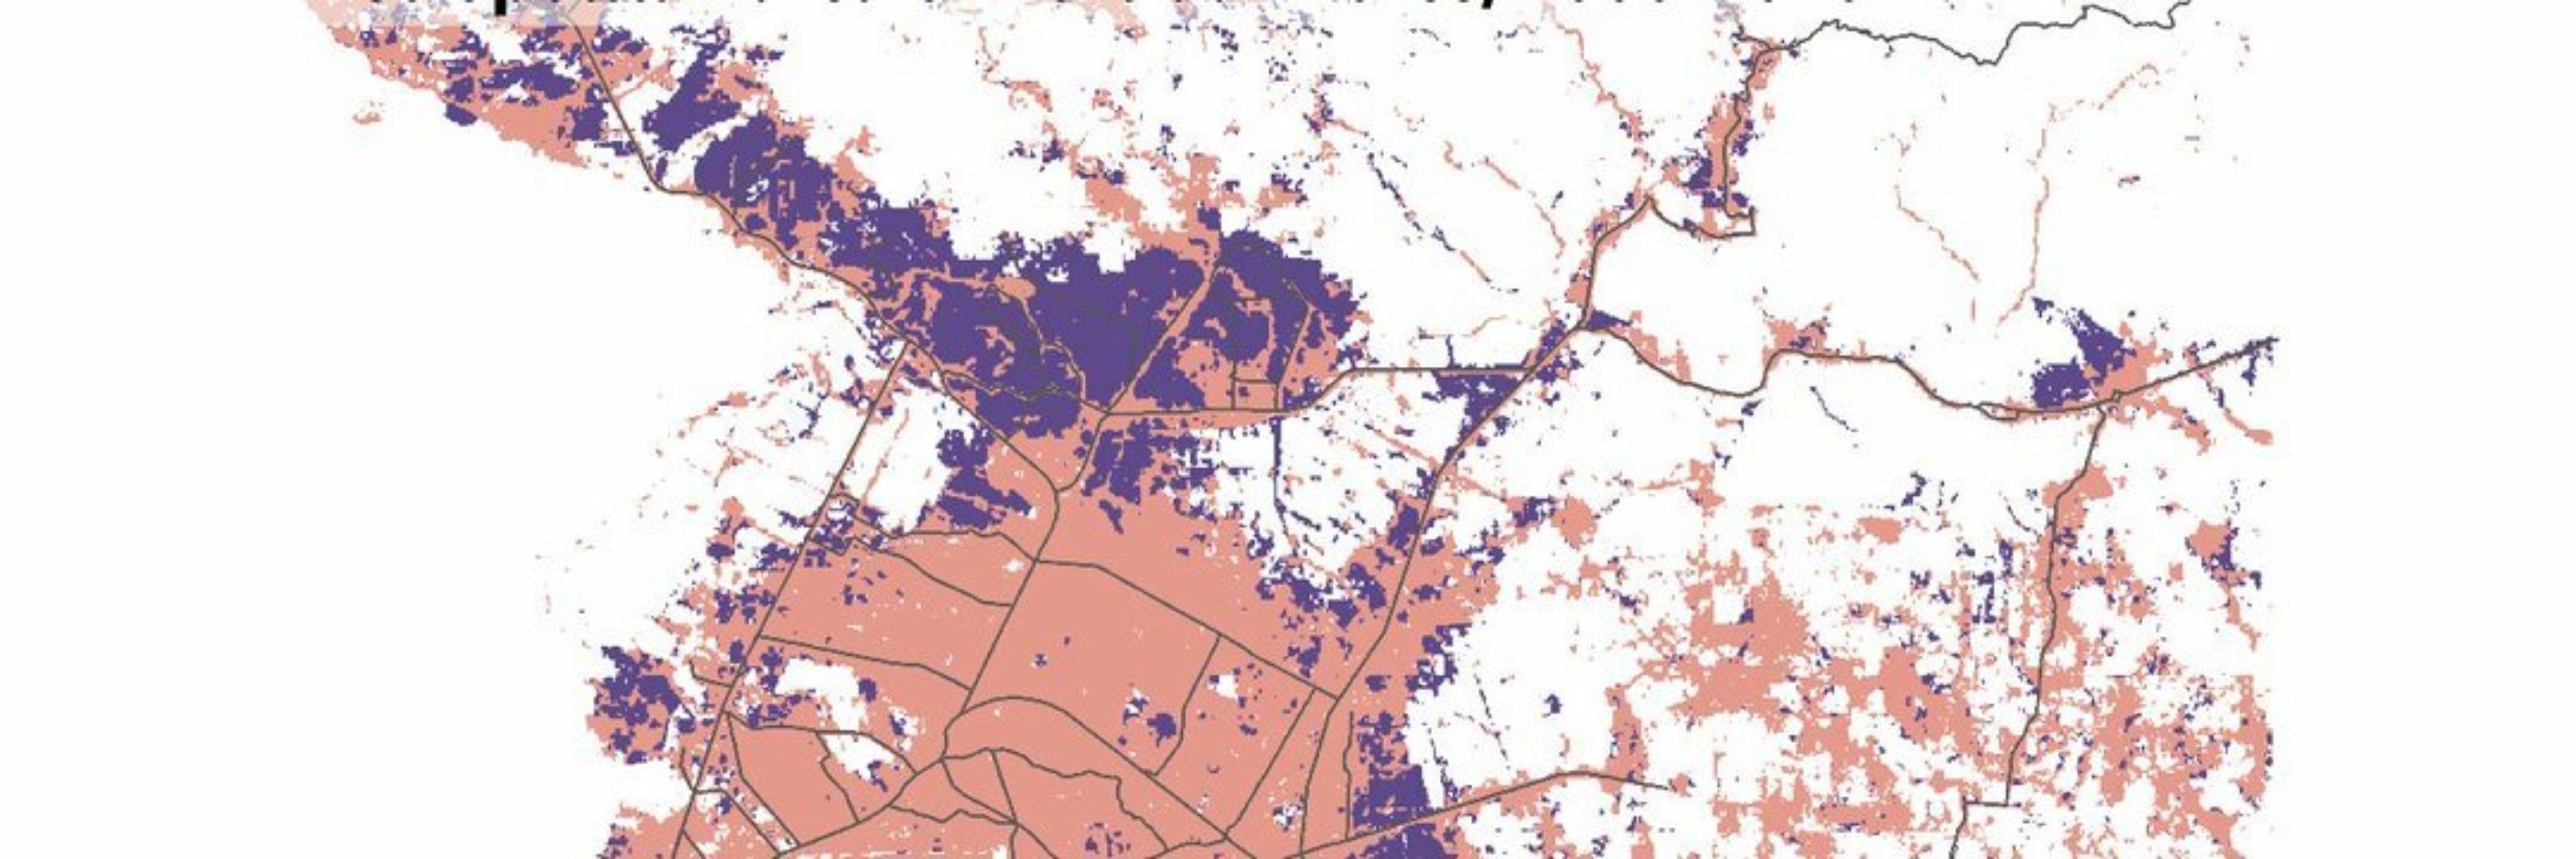
Days 08 and 11 of #30DayMapChallenge bridged into one: I minimally represented urbanism via the non-urban fabric of the Geneva area. Decided it was minimal although not that much.
Code: guillaume-noblet.com/30DayMapChal...
#ggplot2 #dataviz #maps #rstats
Code: guillaume-noblet.com/30DayMapChal...
#ggplot2 #dataviz #maps #rstats

November 12, 2025 at 7:55 AM
Days 08 and 11 of #30DayMapChallenge bridged into one: I minimally represented urbanism via the non-urban fabric of the Geneva area. Decided it was minimal although not that much.
Code: guillaume-noblet.com/30DayMapChal...
#ggplot2 #dataviz #maps #rstats
Code: guillaume-noblet.com/30DayMapChal...
#ggplot2 #dataviz #maps #rstats
#Day07 of #30DayMapChallenge on Accessibility
This map shows the time needed to cycle from Bains des Paquis (a popular fondue and sauna place in Geneva)
🆕 1st time use of the `osmr` package to define #isochrones.
Gallery: guillaume-noblet.com/30DayMapChal...
#dataviz #rstats #ggplot2 #gis #map
This map shows the time needed to cycle from Bains des Paquis (a popular fondue and sauna place in Geneva)
🆕 1st time use of the `osmr` package to define #isochrones.
Gallery: guillaume-noblet.com/30DayMapChal...
#dataviz #rstats #ggplot2 #gis #map

November 11, 2025 at 10:41 AM
#Day07 of #30DayMapChallenge on Accessibility
This map shows the time needed to cycle from Bains des Paquis (a popular fondue and sauna place in Geneva)
🆕 1st time use of the `osmr` package to define #isochrones.
Gallery: guillaume-noblet.com/30DayMapChal...
#dataviz #rstats #ggplot2 #gis #map
This map shows the time needed to cycle from Bains des Paquis (a popular fondue and sauna place in Geneva)
🆕 1st time use of the `osmr` package to define #isochrones.
Gallery: guillaume-noblet.com/30DayMapChal...
#dataviz #rstats #ggplot2 #gis #map
For Day 06 of the #30DayMapChallenge, I used:
📖 Wikipedia retrieving tallest building list with `rvest`
🏔️ `tidyterra` to retrieve elevation shades
🔮 Refined top buildings's labels and lines with `ggrepel`
Code: guillaume-noblet.com/30DayMapChal...
#rstats #gis #dataviz #ggplot2 #terra
📖 Wikipedia retrieving tallest building list with `rvest`
🏔️ `tidyterra` to retrieve elevation shades
🔮 Refined top buildings's labels and lines with `ggrepel`
Code: guillaume-noblet.com/30DayMapChal...
#rstats #gis #dataviz #ggplot2 #terra

November 8, 2025 at 3:52 PM
For Day 06 of the #30DayMapChallenge, I used:
📖 Wikipedia retrieving tallest building list with `rvest`
🏔️ `tidyterra` to retrieve elevation shades
🔮 Refined top buildings's labels and lines with `ggrepel`
Code: guillaume-noblet.com/30DayMapChal...
#rstats #gis #dataviz #ggplot2 #terra
📖 Wikipedia retrieving tallest building list with `rvest`
🏔️ `tidyterra` to retrieve elevation shades
🔮 Refined top buildings's labels and lines with `ggrepel`
Code: guillaume-noblet.com/30DayMapChal...
#rstats #gis #dataviz #ggplot2 #terra
Day 05 of #30DayMapChallenge on Earth (Classical Elements 1/4)
I've discovered and used the new `tmap.mapgl` to show Swizerland's elevation. It's mindblowing how easy it is.
guillaume-noblet.com/30DayMapChal...
#dataviz #rstats #tmap #gis #mapgl cc @mtennekes and thanks!
I've discovered and used the new `tmap.mapgl` to show Swizerland's elevation. It's mindblowing how easy it is.
guillaume-noblet.com/30DayMapChal...
#dataviz #rstats #tmap #gis #mapgl cc @mtennekes and thanks!
November 7, 2025 at 12:30 PM
Day 05 of #30DayMapChallenge on Earth (Classical Elements 1/4)
I've discovered and used the new `tmap.mapgl` to show Swizerland's elevation. It's mindblowing how easy it is.
guillaume-noblet.com/30DayMapChal...
#dataviz #rstats #tmap #gis #mapgl cc @mtennekes and thanks!
I've discovered and used the new `tmap.mapgl` to show Swizerland's elevation. It's mindblowing how easy it is.
guillaume-noblet.com/30DayMapChal...
#dataviz #rstats #tmap #gis #mapgl cc @mtennekes and thanks!
I did publish Day 04 of #30DayMapChallenge on a Microsoft owned platform too! With a bit of tweaking the theme.
Code: guillaume-noblet.com/30DayMapChal...
#rstats #dataviz #map #ggplot2 #gis #fedora
Code: guillaume-noblet.com/30DayMapChal...
#rstats #dataviz #map #ggplot2 #gis #fedora

November 6, 2025 at 10:21 AM
I did publish Day 04 of #30DayMapChallenge on a Microsoft owned platform too! With a bit of tweaking the theme.
Code: guillaume-noblet.com/30DayMapChal...
#rstats #dataviz #map #ggplot2 #gis #fedora
Code: guillaume-noblet.com/30DayMapChal...
#rstats #dataviz #map #ggplot2 #gis #fedora
Here it is :) guillaume-noblet.com/30DayMapChal...

November 5, 2025 at 3:18 PM
Here it is :) guillaume-noblet.com/30DayMapChal...
Oh, and btw here is a live gallery for the challenge with scripts: guillaume-noblet.com/30DayMapChal...
November 5, 2025 at 3:14 PM
Oh, and btw here is a live gallery for the challenge with scripts: guillaume-noblet.com/30DayMapChal...
Day 03 of #30DayMapChallenge with a density choropleth and quantiles!
👏 Thanks to @Benjamin Novak's tutorial in @yan-holtz.bsky.social gallery r-graph-gallery.com/web-map-chor...
🌚 Used data from the Observatoire Statistique Tranfrontalier
#rstats #dataviz #map #ggplot2 #gis
👏 Thanks to @Benjamin Novak's tutorial in @yan-holtz.bsky.social gallery r-graph-gallery.com/web-map-chor...
🌚 Used data from the Observatoire Statistique Tranfrontalier
#rstats #dataviz #map #ggplot2 #gis

November 5, 2025 at 3:14 PM
Day 03 of #30DayMapChallenge with a density choropleth and quantiles!
👏 Thanks to @Benjamin Novak's tutorial in @yan-holtz.bsky.social gallery r-graph-gallery.com/web-map-chor...
🌚 Used data from the Observatoire Statistique Tranfrontalier
#rstats #dataviz #map #ggplot2 #gis
👏 Thanks to @Benjamin Novak's tutorial in @yan-holtz.bsky.social gallery r-graph-gallery.com/web-map-chor...
🌚 Used data from the Observatoire Statistique Tranfrontalier
#rstats #dataviz #map #ggplot2 #gis
Day 02 of #30DayMapChallenge with a few Swiss river lines
🙏 Followed @milos-makes-maps.bsky.social's tutorial
🆕 Added a halo layer under the lines layer
✨ 1st time I plotted a river system
#ggplot2 #rstats #dataviz #maps
🙏 Followed @milos-makes-maps.bsky.social's tutorial
🆕 Added a halo layer under the lines layer
✨ 1st time I plotted a river system
#ggplot2 #rstats #dataviz #maps

November 4, 2025 at 8:52 AM
Day 02 of #30DayMapChallenge with a few Swiss river lines
🙏 Followed @milos-makes-maps.bsky.social's tutorial
🆕 Added a halo layer under the lines layer
✨ 1st time I plotted a river system
#ggplot2 #rstats #dataviz #maps
🙏 Followed @milos-makes-maps.bsky.social's tutorial
🆕 Added a halo layer under the lines layer
✨ 1st time I plotted a river system
#ggplot2 #rstats #dataviz #maps
#30DayMapChallenge Here is day 01, showing road accidents in Geneva, Switzerland.
#DataViz #RStats #ggplot2
#DataViz #RStats #ggplot2

November 3, 2025 at 12:55 PM
#30DayMapChallenge Here is day 01, showing road accidents in Geneva, Switzerland.
#DataViz #RStats #ggplot2
#DataViz #RStats #ggplot2
#TidyTuesday this week is about the #FAO data for the #WorldFoodDay
📊 Combining `ggbump` and a map to display a ranking, I chose to use IPC data instead and reproduce a chart by David Sjoberg.
#rstats #ipcinfo #ipc #fsl #dataviz #map #ggplot2
Code: guillaume-noblet.com/TidyTuesday/
📊 Combining `ggbump` and a map to display a ranking, I chose to use IPC data instead and reproduce a chart by David Sjoberg.
#rstats #ipcinfo #ipc #fsl #dataviz #map #ggplot2
Code: guillaume-noblet.com/TidyTuesday/

October 15, 2025 at 2:42 PM
#TidyTuesday this week is about the #FAO data for the #WorldFoodDay
📊 Combining `ggbump` and a map to display a ranking, I chose to use IPC data instead and reproduce a chart by David Sjoberg.
#rstats #ipcinfo #ipc #fsl #dataviz #map #ggplot2
Code: guillaume-noblet.com/TidyTuesday/
📊 Combining `ggbump` and a map to display a ranking, I chose to use IPC data instead and reproduce a chart by David Sjoberg.
#rstats #ipcinfo #ipc #fsl #dataviz #map #ggplot2
Code: guillaume-noblet.com/TidyTuesday/
One of my graph has just entered the "best" section of the r-graph-gallery.com with a tutorial.
Featuring a waffle chart for time series, where the subtitle serves as a colorful legend.
Thanks a lot to @yan-holtz.bsky.social and @soeundataviz.bsky.social for adding it! #rstats #dataviz #ggplot2
Featuring a waffle chart for time series, where the subtitle serves as a colorful legend.
Thanks a lot to @yan-holtz.bsky.social and @soeundataviz.bsky.social for adding it! #rstats #dataviz #ggplot2

October 10, 2025 at 6:24 AM
One of my graph has just entered the "best" section of the r-graph-gallery.com with a tutorial.
Featuring a waffle chart for time series, where the subtitle serves as a colorful legend.
Thanks a lot to @yan-holtz.bsky.social and @soeundataviz.bsky.social for adding it! #rstats #dataviz #ggplot2
Featuring a waffle chart for time series, where the subtitle serves as a colorful legend.
Thanks a lot to @yan-holtz.bsky.social and @soeundataviz.bsky.social for adding it! #rstats #dataviz #ggplot2
#TidyTuesday Week 40 – I mostly just wanted to plot a map!
👉 Code: guillaume-noblet.com/TidyTuesday/
#DataScience #RStats #Geospatial #dataviz
👉 Code: guillaume-noblet.com/TidyTuesday/
#DataScience #RStats #Geospatial #dataviz

October 7, 2025 at 2:59 PM
#TidyTuesday Week 40 – I mostly just wanted to plot a map!
👉 Code: guillaume-noblet.com/TidyTuesday/
#DataScience #RStats #Geospatial #dataviz
👉 Code: guillaume-noblet.com/TidyTuesday/
#DataScience #RStats #Geospatial #dataviz
#TidyTuesday a week late on Crane Observations at Lake Hornborgasjön, Sweden (1994–2024).
🗓️ Used a heatmap to look at the repeated yearly spring observations
🎷 `ggbranding` to add personal branding github.com/gnoblet/ggbr...
👽 Code: gnoblet.github.io/TidyTuesday/
#rstats #ggplot2 #heatmap #dataviz
🗓️ Used a heatmap to look at the repeated yearly spring observations
🎷 `ggbranding` to add personal branding github.com/gnoblet/ggbr...
👽 Code: gnoblet.github.io/TidyTuesday/
#rstats #ggplot2 #heatmap #dataviz

October 6, 2025 at 9:29 AM
#TidyTuesday a week late on Crane Observations at Lake Hornborgasjön, Sweden (1994–2024).
🗓️ Used a heatmap to look at the repeated yearly spring observations
🎷 `ggbranding` to add personal branding github.com/gnoblet/ggbr...
👽 Code: gnoblet.github.io/TidyTuesday/
#rstats #ggplot2 #heatmap #dataviz
🗓️ Used a heatmap to look at the repeated yearly spring observations
🎷 `ggbranding` to add personal branding github.com/gnoblet/ggbr...
👽 Code: gnoblet.github.io/TidyTuesday/
#rstats #ggplot2 #heatmap #dataviz
Two days on e/os from @murena-com.bsky.social and here is the amount of trackers blocked.
e/os installed on my #FP5 @fairphone.com
e/os installed on my #FP5 @fairphone.com

September 28, 2025 at 3:48 PM
Two days on e/os from @murena-com.bsky.social and here is the amount of trackers blocked.
e/os installed on my #FP5 @fairphone.com
e/os installed on my #FP5 @fairphone.com
🚀 Just released **ggbranding** (v1) – a tiny R package that lets you brand `ggplot2` charts with Font Awesome 7 icons.
📝 Blog: gnoblet.github.io/blog/ggbrand...
💻 Code: github.com/gnoblet/ggbr...
#opensource #branding #package #rstats #dataviz #ggplot2
📝 Blog: gnoblet.github.io/blog/ggbrand...
💻 Code: github.com/gnoblet/ggbr...
#opensource #branding #package #rstats #dataviz #ggplot2

September 22, 2025 at 8:51 AM
🚀 Just released **ggbranding** (v1) – a tiny R package that lets you brand `ggplot2` charts with Font Awesome 7 icons.
📝 Blog: gnoblet.github.io/blog/ggbrand...
💻 Code: github.com/gnoblet/ggbr...
#opensource #branding #package #rstats #dataviz #ggplot2
📝 Blog: gnoblet.github.io/blog/ggbrand...
💻 Code: github.com/gnoblet/ggbr...
#opensource #branding #package #rstats #dataviz #ggplot2

🎈 Hey folks! I’ve just released V1 of `SurveyLiteR`, an R package that (hopefully) simplifies survey and KoboTool-based analysis.
🎯 Typical users: data teams in (I)NGOs or UN agencies in need of a toolkit to analyze humanitarian household-survey data.
#rstats #humanitarian #survey #datanalysis
🎯 Typical users: data teams in (I)NGOs or UN agencies in need of a toolkit to analyze humanitarian household-survey data.
#rstats #humanitarian #survey #datanalysis


September 16, 2025 at 8:11 AM
🎈 Hey folks! I’ve just released V1 of `SurveyLiteR`, an R package that (hopefully) simplifies survey and KoboTool-based analysis.
🎯 Typical users: data teams in (I)NGOs or UN agencies in need of a toolkit to analyze humanitarian household-survey data.
#rstats #humanitarian #survey #datanalysis
🎯 Typical users: data teams in (I)NGOs or UN agencies in need of a toolkit to analyze humanitarian household-survey data.
#rstats #humanitarian #survey #datanalysis
🌰 Very minor new #quarto blog post on a #Golem #Shiny app I built for accounting expenses in a shared house.
🫛 Blog post is here: gnoblet.github.io/blog/house-e...
🌱 App is available here: gnoblet-house-expenses-accounting.share.connect.posit.cloud
#rstats #quarto #website #react #typescript
🫛 Blog post is here: gnoblet.github.io/blog/house-e...
🌱 App is available here: gnoblet-house-expenses-accounting.share.connect.posit.cloud
#rstats #quarto #website #react #typescript


July 16, 2025 at 2:14 PM
🌰 Very minor new #quarto blog post on a #Golem #Shiny app I built for accounting expenses in a shared house.
🫛 Blog post is here: gnoblet.github.io/blog/house-e...
🌱 App is available here: gnoblet-house-expenses-accounting.share.connect.posit.cloud
#rstats #quarto #website #react #typescript
🫛 Blog post is here: gnoblet.github.io/blog/house-e...
🌱 App is available here: gnoblet-house-expenses-accounting.share.connect.posit.cloud
#rstats #quarto #website #react #typescript
🎨🎨🎨 I just leveled up my #TidyTuesday game with a live gallery (no new viz though, oops)
➡️ Accessible here: gnoblet.github.io/TidyTuesday/
🏗️ #Quarto website
🐍 #Python + 📈 #Rstats dual-language support with `uv` and `renv`
🤖 GitHub Actions auto-deploys to GitHub Pages
📱 Template for new #DataViz
➡️ Accessible here: gnoblet.github.io/TidyTuesday/
🏗️ #Quarto website
🐍 #Python + 📈 #Rstats dual-language support with `uv` and `renv`
🤖 GitHub Actions auto-deploys to GitHub Pages
📱 Template for new #DataViz

June 25, 2025 at 8:09 AM
🎨🎨🎨 I just leveled up my #TidyTuesday game with a live gallery (no new viz though, oops)
➡️ Accessible here: gnoblet.github.io/TidyTuesday/
🏗️ #Quarto website
🐍 #Python + 📈 #Rstats dual-language support with `uv` and `renv`
🤖 GitHub Actions auto-deploys to GitHub Pages
📱 Template for new #DataViz
➡️ Accessible here: gnoblet.github.io/TidyTuesday/
🏗️ #Quarto website
🐍 #Python + 📈 #Rstats dual-language support with `uv` and `renv`
🤖 GitHub Actions auto-deploys to GitHub Pages
📱 Template for new #DataViz
After too much polishing, most likely for nothing, here's a first version of my personal website! gnoblet.github.io
🍲 Happily embedded a #Quarto blog, built light/dark themes, and added a (marvelous, let's be honest) leaf animation
🤲 Feedback and critics more than welcomed!
🍲 Happily embedded a #Quarto blog, built light/dark themes, and added a (marvelous, let's be honest) leaf animation
🤲 Feedback and critics more than welcomed!

June 21, 2025 at 10:47 AM
After too much polishing, most likely for nothing, here's a first version of my personal website! gnoblet.github.io
🍲 Happily embedded a #Quarto blog, built light/dark themes, and added a (marvelous, let's be honest) leaf animation
🤲 Feedback and critics more than welcomed!
🍲 Happily embedded a #Quarto blog, built light/dark themes, and added a (marvelous, let's be honest) leaf animation
🤲 Feedback and critics more than welcomed!
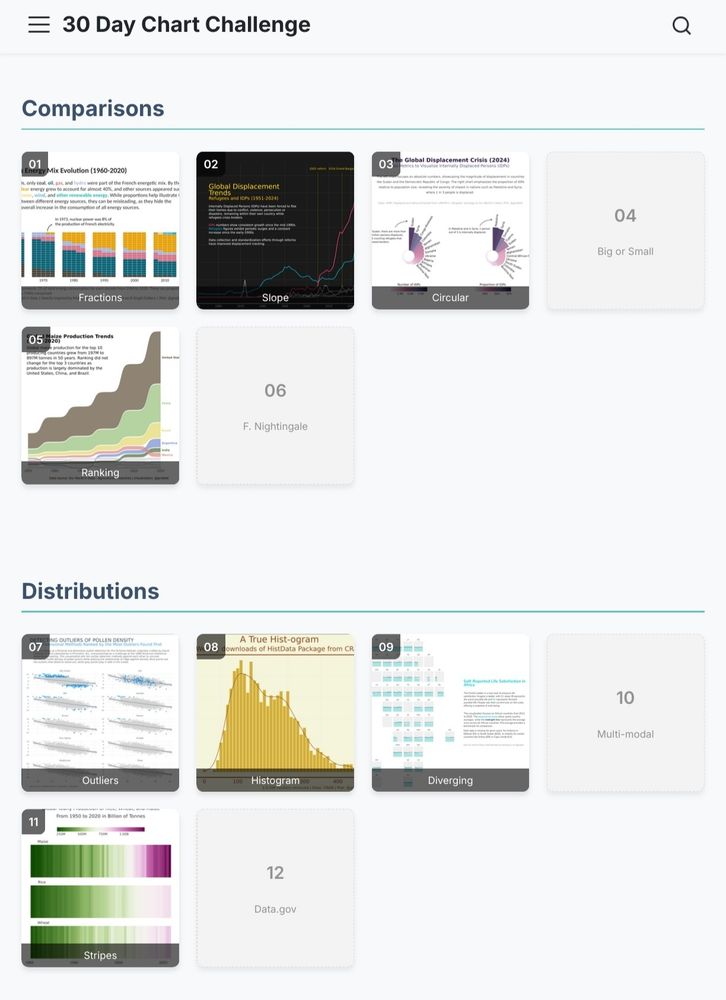
🪗 I just published a quick Quarto website as wrap-up of my first (short) participation to the @30daychartchall.bsky.social !
🐌 I may slowly produce the huge bunch of missing charts
➡️ Link: gnoblet.github.io/30DayChartChallenge
#quarto #dataviz #rstats #matplotlib #ggplot2 #30daychartchallenge
🐌 I may slowly produce the huge bunch of missing charts
➡️ Link: gnoblet.github.io/30DayChartChallenge
#quarto #dataviz #rstats #matplotlib #ggplot2 #30daychartchallenge
June 20, 2025 at 4:20 PM
🪗 I just published a quick Quarto website as wrap-up of my first (short) participation to the @30daychartchall.bsky.social !
🐌 I may slowly produce the huge bunch of missing charts
➡️ Link: gnoblet.github.io/30DayChartChallenge
#quarto #dataviz #rstats #matplotlib #ggplot2 #30daychartchallenge
🐌 I may slowly produce the huge bunch of missing charts
➡️ Link: gnoblet.github.io/30DayChartChallenge
#quarto #dataviz #rstats #matplotlib #ggplot2 #30daychartchallenge
🍳🍚 🍲 Ongoing cooking
💻 Learning Vite, Typescript, React, and Tailwind for the 1st time
📊 Embedding Quarto rendered documents for blog posting
✨ Mostly, having fun playing with colors and shapes
I get inspiration from @Colas Droin's and @yan-holtz.bsky.social 's personal websites, among others.
💻 Learning Vite, Typescript, React, and Tailwind for the 1st time
📊 Embedding Quarto rendered documents for blog posting
✨ Mostly, having fun playing with colors and shapes
I get inspiration from @Colas Droin's and @yan-holtz.bsky.social 's personal websites, among others.
May 14, 2025 at 6:00 AM
🍳🍚 🍲 Ongoing cooking
💻 Learning Vite, Typescript, React, and Tailwind for the 1st time
📊 Embedding Quarto rendered documents for blog posting
✨ Mostly, having fun playing with colors and shapes
I get inspiration from @Colas Droin's and @yan-holtz.bsky.social 's personal websites, among others.
💻 Learning Vite, Typescript, React, and Tailwind for the 1st time
📊 Embedding Quarto rendered documents for blog posting
✨ Mostly, having fun playing with colors and shapes
I get inspiration from @Colas Droin's and @yan-holtz.bsky.social 's personal websites, among others.
👏 For the Fossils Day 21 of #30DayChartChallenge, I re-used and expanded my 1st day waffle chart and played with constructing a rectangle legend.
📊 Code: github.com/gnoblet/30Da...
#rstats #ggplot2 #dataviz cc @30daychartchall.bsky.social
📊 Code: github.com/gnoblet/30Da...
#rstats #ggplot2 #dataviz cc @30daychartchall.bsky.social

April 22, 2025 at 11:32 AM
👏 For the Fossils Day 21 of #30DayChartChallenge, I re-used and expanded my 1st day waffle chart and played with constructing a rectangle legend.
📊 Code: github.com/gnoblet/30Da...
#rstats #ggplot2 #dataviz cc @30daychartchall.bsky.social
📊 Code: github.com/gnoblet/30Da...
#rstats #ggplot2 #dataviz cc @30daychartchall.bsky.social
👏 Day 19 of #30DayChartChallenge with prompt Time Series - Smooth
Looking at median prices of local rice for countries where currency is XOF---or coded as such in the World Food Programme (WFP) food prices dataset.
Code is ⬇️⬇️⬇️
#python #matplotlib #seaborn #dataviz cc @30daychartchall.bsky.social
Looking at median prices of local rice for countries where currency is XOF---or coded as such in the World Food Programme (WFP) food prices dataset.
Code is ⬇️⬇️⬇️
#python #matplotlib #seaborn #dataviz cc @30daychartchall.bsky.social

April 21, 2025 at 10:25 AM
👏 Day 19 of #30DayChartChallenge with prompt Time Series - Smooth
Looking at median prices of local rice for countries where currency is XOF---or coded as such in the World Food Programme (WFP) food prices dataset.
Code is ⬇️⬇️⬇️
#python #matplotlib #seaborn #dataviz cc @30daychartchall.bsky.social
Looking at median prices of local rice for countries where currency is XOF---or coded as such in the World Food Programme (WFP) food prices dataset.
Code is ⬇️⬇️⬇️
#python #matplotlib #seaborn #dataviz cc @30daychartchall.bsky.social