


Grant McDermott
@gmcd.bsky.social
Economics and data science | Former academic now working in the tech sector | Views my own | 🇿🇦 in 🇺🇸 | https://grantmcdermott.com/
The non rugby mind cannot comprehend these two images.


November 8, 2025 at 5:05 PM
The non rugby mind cannot comprehend these two images.
Successfully nerdsniped myself into writing a little script for this. gist.github.com/grantmcdermo...
(Longer than it probably needs to be bc of annoying Wiki table formatting, but I'm too lazy to find another source.)
(Longer than it probably needs to be bc of annoying Wiki table formatting, but I'm too lazy to find another source.)

September 30, 2025 at 12:12 AM
Successfully nerdsniped myself into writing a little script for this. gist.github.com/grantmcdermo...
(Longer than it probably needs to be bc of annoying Wiki table formatting, but I'm too lazy to find another source.)
(Longer than it probably needs to be bc of annoying Wiki table formatting, but I'm too lazy to find another source.)

Clearly not the most important news coming out of Oregon tonight, but I just added a recession bars example to the tinyplot “Tips & tricks” vignette. grantmcdermott.com/tinyplot/vig... #rstats

September 28, 2025 at 3:50 AM
Clearly not the most important news coming out of Oregon tonight, but I just added a recession bars example to the tinyplot “Tips & tricks” vignette. grantmcdermott.com/tinyplot/vig... #rstats
`tinyplot` 0.5.0 is now available from CRAN & R-universe. Alongside bug fixes & internal improvements, this release includes some cool new features like bubble chart + dual legend support, element dodging, & ephemeral themes.
Detailed changelog: grantmcdermott.com/tinyplot/NEW...
#rstats #dataviz
Detailed changelog: grantmcdermott.com/tinyplot/NEW...
#rstats #dataviz

September 23, 2025 at 2:41 AM
`tinyplot` 0.5.0 is now available from CRAN & R-universe. Alongside bug fixes & internal improvements, this release includes some cool new features like bubble chart + dual legend support, element dodging, & ephemeral themes.
Detailed changelog: grantmcdermott.com/tinyplot/NEW...
#rstats #dataviz
Detailed changelog: grantmcdermott.com/tinyplot/NEW...
#rstats #dataviz
Update: it won't see us through the winter, but a respectable harvest through the season.

September 19, 2025 at 12:54 AM
Update: it won't see us through the winter, but a respectable harvest through the season.
Word. Whenever someone asks me for career advice these days, I reply without irony: "Work on your core."

September 18, 2025 at 11:39 PM
Word. Whenever someone asks me for career advice these days, I reply without irony: "Work on your core."
To borrow another example, taken from the `dbreg` README: github.com/grantmcdermo...
Here I am running a fixed-effects regression on 180 million(!) row parquet dataset... and it completes **< 2 seconds**... on my laptop 🤯
This is powered by @duckdb.org under the hood.
#rstats #econsky
Here I am running a fixed-effects regression on 180 million(!) row parquet dataset... and it completes **< 2 seconds**... on my laptop 🤯
This is powered by @duckdb.org under the hood.
#rstats #econsky
![Running dbreg::dbreg() on a full year of NYC taxi data... and it takes less than 2 seconds.
dbreg(
tip_amount ~ fare_amount + passenger_count | month + vendor_name,
path = "read_parquet('nyc-taxi/**/*.parquet')", ## path to hive-partitioned dataset
vcov = "hc1"
)
#> [dbreg] Estimating compression ratio...
#> [dbreg] Data has 178,544,324 rows and 24 unique FE groups.
#> [dbreg] Using strategy: compress
#> [dbreg] Executing compress strategy SQL
#>
#> Compressed OLS estimation, Dep. Var.: tip_amount
#> Observations.: 178,544,324 (original) | 70,782 (compressed)
#> Standard Errors: Heteroskedasticity-robust
#> Estimate Std. Error t value Pr(>|t|)
#> fare_amount 0.106744 0.000068 1564.742 < 2.2e-16 ***
#> passenger_count -0.029086 0.000106 -273.866 < 2.2e-16 ***
#> ---
#> Signif. codes: 0 '***' 0.001 '**' 0.01 '*' 0.05 '.' 0.1 ' ' 1](https://cdn.bsky.app/img/feed_thumbnail/plain/did:plc:qww63z2t5rrhniusz5x7gk23/bafkreiajmnp6jiaycebutwid2lxx57hrz3zc3qp2p5ijnoqiyqag34xpe4@jpeg)
August 25, 2025 at 6:38 PM
To borrow another example, taken from the `dbreg` README: github.com/grantmcdermo...
Here I am running a fixed-effects regression on 180 million(!) row parquet dataset... and it completes **< 2 seconds**... on my laptop 🤯
This is powered by @duckdb.org under the hood.
#rstats #econsky
Here I am running a fixed-effects regression on 180 million(!) row parquet dataset... and it completes **< 2 seconds**... on my laptop 🤯
This is powered by @duckdb.org under the hood.
#rstats #econsky
#rstats Seen over at Mastodon: the `terminalgraphics` 📦 let's you render R plots _directly_ in a terminal window (e.g., R process launched from the command line, neovim or emacs). codeberg.org/djvanderlaan...
Get it: `remotes::install_git(url = "https://codeberg.org/djvanderlaan/terminalgraphics")`
Get it: `remotes::install_git(url = "https://codeberg.org/djvanderlaan/terminalgraphics")`

August 17, 2025 at 11:06 PM
#rstats Seen over at Mastodon: the `terminalgraphics` 📦 let's you render R plots _directly_ in a terminal window (e.g., R process launched from the command line, neovim or emacs). codeberg.org/djvanderlaan...
Get it: `remotes::install_git(url = "https://codeberg.org/djvanderlaan/terminalgraphics")`
Get it: `remotes::install_git(url = "https://codeberg.org/djvanderlaan/terminalgraphics")`
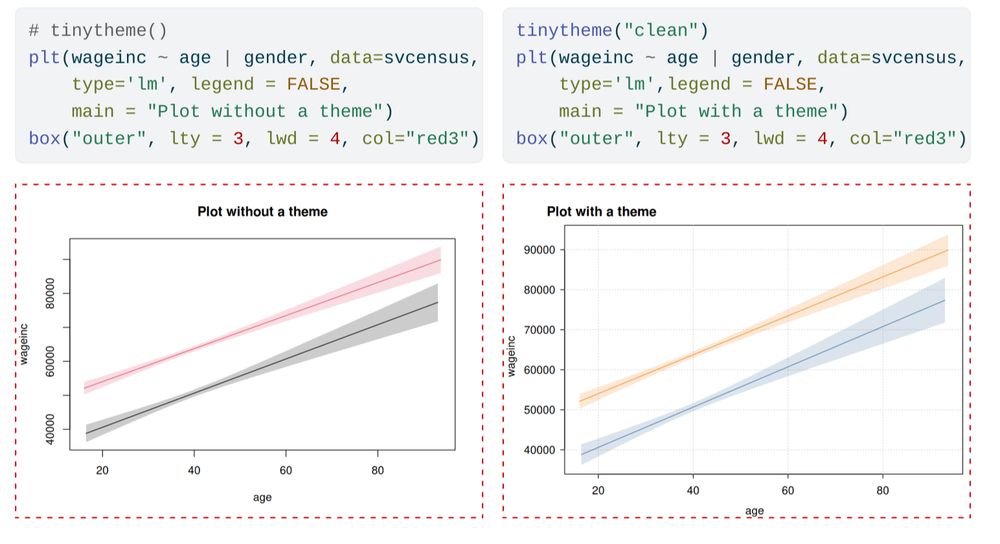
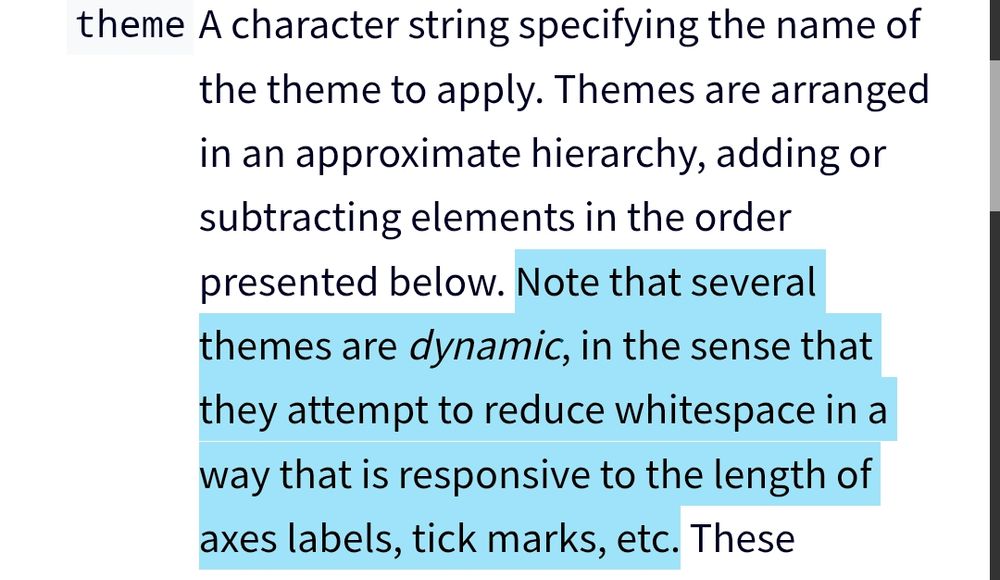
I don't think non-uniformity was the issue. Rather Frank doesn't like the default spacing of base graphics, esp. around the axis text and plot extent... But we offer much nicer spacing via themes; c.f. the reduction in whitespace in the rhs plot. (This is automated, but can be further customized.)
August 3, 2025 at 6:28 PM
I don't think non-uniformity was the issue. Rather Frank doesn't like the default spacing of base graphics, esp. around the axis text and plot extent... But we offer much nicer spacing via themes; c.f. the reduction in whitespace in the rhs plot. (This is automated, but can be further customized.)
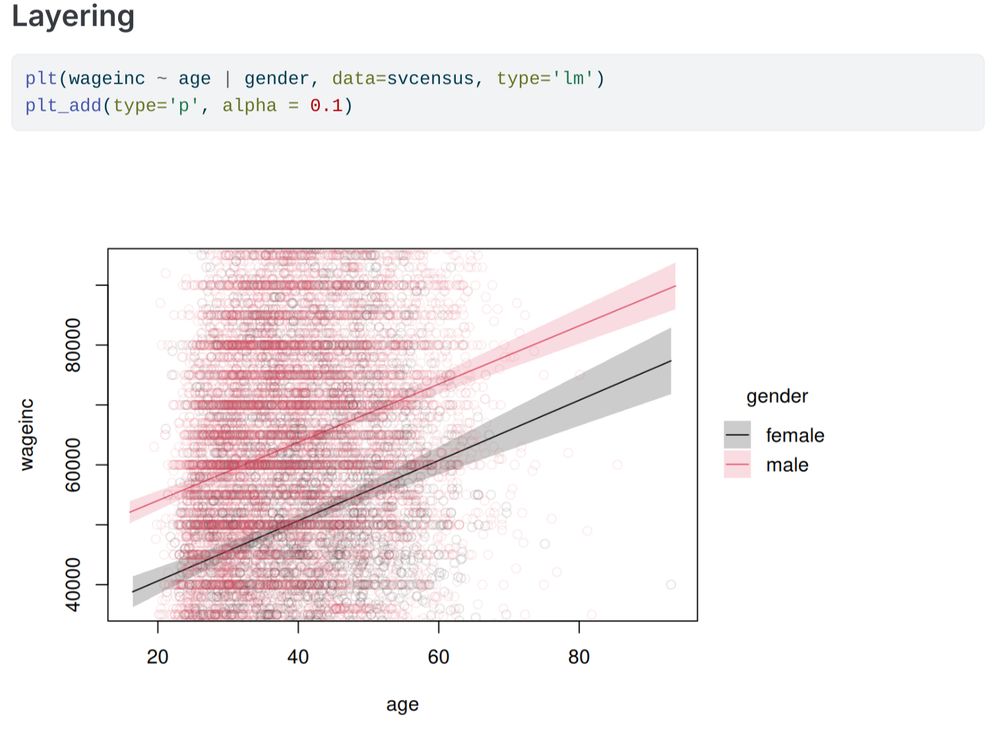
Sounds like you're looking for `tinyplot_add` (alias: `plt_add`)? grantmcdermott.com/tinyplot/man...
August 3, 2025 at 5:58 PM
Sounds like you're looking for `tinyplot_add` (alias: `plt_add`)? grantmcdermott.com/tinyplot/man...
Jumping across threads, but this should definitely work. As you said elsewhere maybe a conflict with the redundant with()?
August 3, 2025 at 5:55 PM
Jumping across threads, but this should definitely work. As you said elsewhere maybe a conflict with the redundant with()?
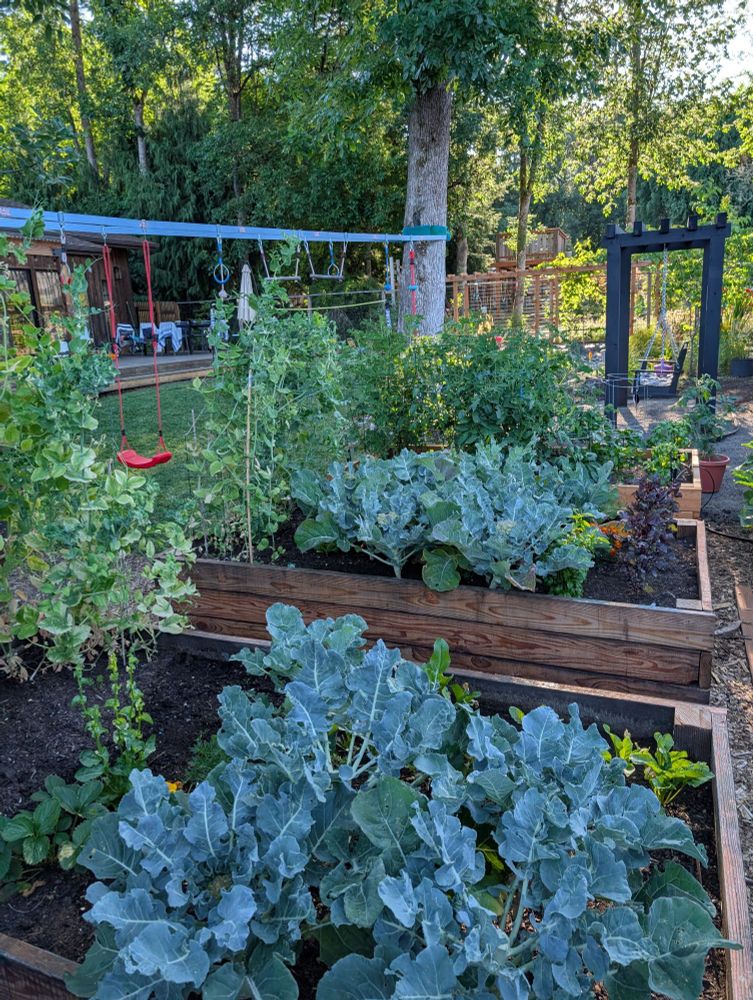
In other news, <Operation Autarky> in full swing here in the Willamette Valley.
More "Dig for Idiocracy" than "Dig for Victory", but needs must.
More "Dig for Idiocracy" than "Dig for Victory", but needs must.
July 18, 2025 at 4:05 PM
In other news, <Operation Autarky> in full swing here in the Willamette Valley.
More "Dig for Idiocracy" than "Dig for Victory", but needs must.
More "Dig for Idiocracy" than "Dig for Victory", but needs must.
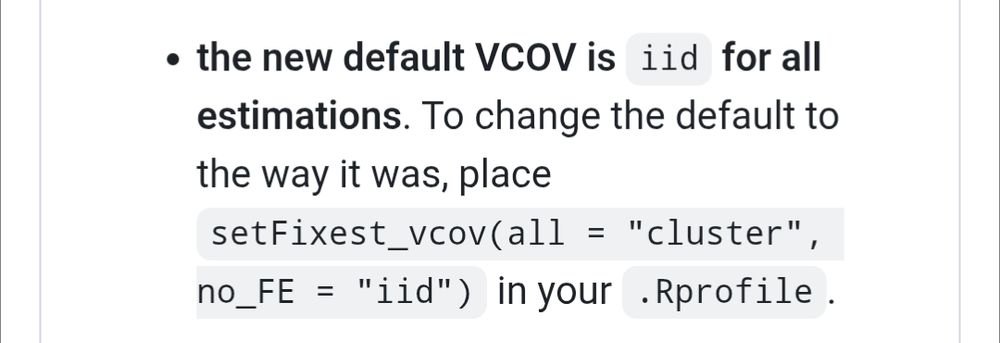
#rstats #econsky PSA: The next release of `fixest` will include some important changes (plus cool new features).
E.g. Fixed-effects regs will now default to 'iid' SEs rather than clustered. github.com/lrberge/fixe...
You can install and test drive the dev version from R-universe; see the README.
E.g. Fixed-effects regs will now default to 'iid' SEs rather than clustered. github.com/lrberge/fixe...
You can install and test drive the dev version from R-universe; see the README.
July 18, 2025 at 3:36 PM
#rstats #econsky PSA: The next release of `fixest` will include some important changes (plus cool new features).
E.g. Fixed-effects regs will now default to 'iid' SEs rather than clustered. github.com/lrberge/fixe...
You can install and test drive the dev version from R-universe; see the README.
E.g. Fixed-effects regs will now default to 'iid' SEs rather than clustered. github.com/lrberge/fixe...
You can install and test drive the dev version from R-universe; see the README.
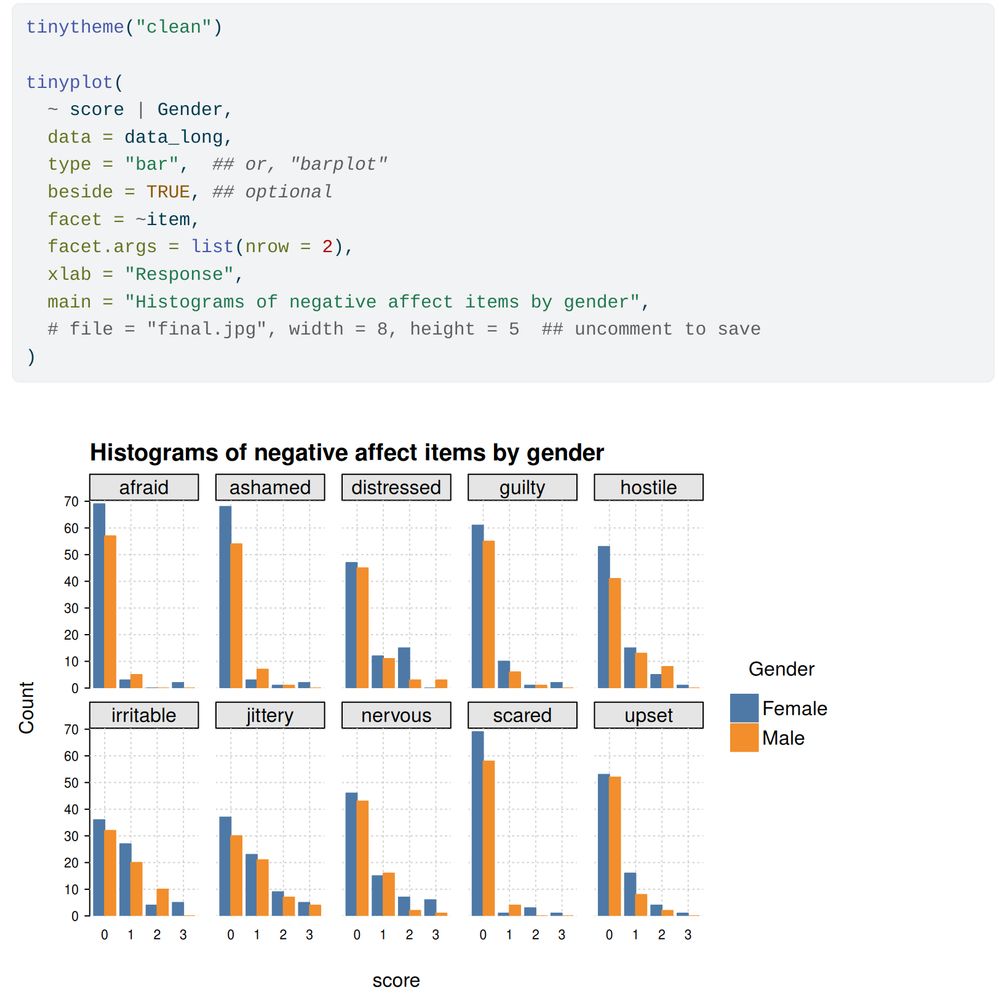
Thanks for the post and test!
I think you probably want barplots instead of histograms here, though? grantmcdermott.com/tinyplot/man...
E.g., your final plot would be:
I think you probably want barplots instead of histograms here, though? grantmcdermott.com/tinyplot/man...
E.g., your final plot would be:
July 18, 2025 at 2:09 PM
Thanks for the post and test!
I think you probably want barplots instead of histograms here, though? grantmcdermott.com/tinyplot/man...
E.g., your final plot would be:
I think you probably want barplots instead of histograms here, though? grantmcdermott.com/tinyplot/man...
E.g., your final plot would be:
I feel like @f2harrell.bsky.social brings this up with every tinyplot release notice... and we always respond by saying that themes are there to specifically reduce whitespace 🤷 grantmcdermott.com/tinyplot/vig...
July 13, 2025 at 2:42 PM
I feel like @f2harrell.bsky.social brings this up with every tinyplot release notice... and we always respond by saying that themes are there to specifically reduce whitespace 🤷 grantmcdermott.com/tinyplot/vig...
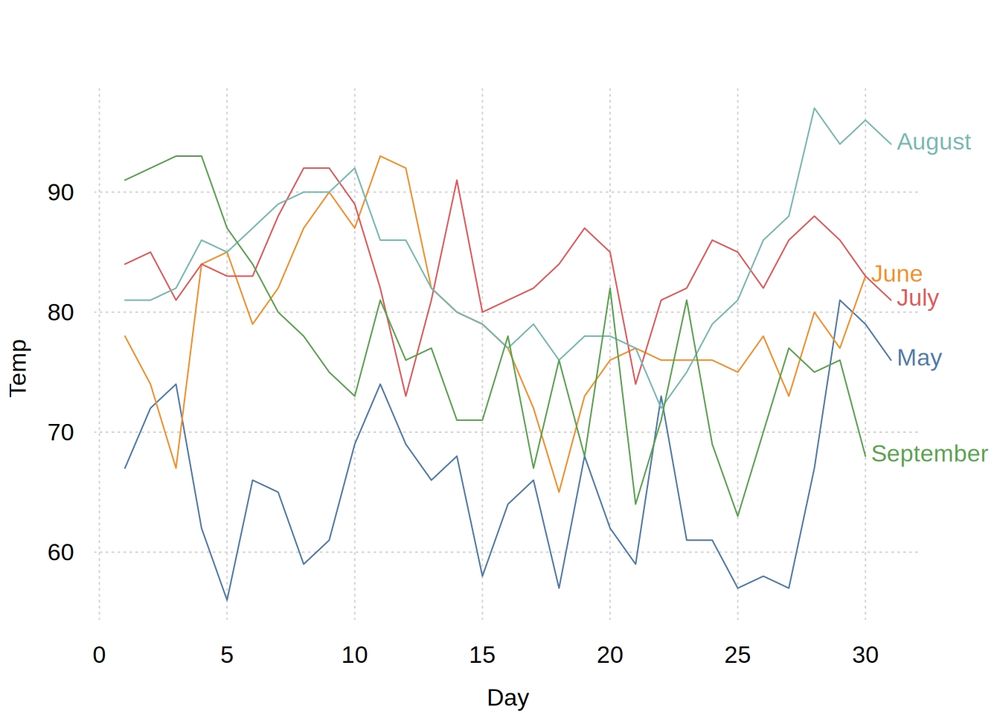
Also includes a mini update to the "Tips & tricks" vignette: how to add direct labels to a grouped line (tiny)plot. grantmcdermott.com/tinyplot/vig...
July 12, 2025 at 3:42 PM
Also includes a mini update to the "Tips & tricks" vignette: how to add direct labels to a grouped line (tiny)plot. grantmcdermott.com/tinyplot/vig...
300 GitHub stars now and counting for the "clean" Quarto presentation theme. So you know it's good. github.com/grantmcdermo...

June 10, 2025 at 12:39 AM
300 GitHub stars now and counting for the "clean" Quarto presentation theme. So you know it's good. github.com/grantmcdermo...
4. Better NSE support means less typing for plots with x/ymin and x/ymax values, e.g. coefficient plots.
(We plan to expand this smart NSE passing to equivalent arguments like weights and subset in a future release.)
(We plan to expand this smart NSE passing to equivalent arguments like weights and subset in a future release.)

June 3, 2025 at 8:47 PM
4. Better NSE support means less typing for plots with x/ymin and x/ymax values, e.g. coefficient plots.
(We plan to expand this smart NSE passing to equivalent arguments like weights and subset in a future release.)
(We plan to expand this smart NSE passing to equivalent arguments like weights and subset in a future release.)
3. Customizing axis labels is now a lot easier thanks to a couple of convenience functions documented here: grantmcdermott.com/tinyplot/man.... You can specify breaks, use formatting shortcut symbols, or even pass custom formatting functions.

June 3, 2025 at 8:47 PM
3. Customizing axis labels is now a lot easier thanks to a couple of convenience functions documented here: grantmcdermott.com/tinyplot/man.... You can specify breaks, use formatting shortcut symbols, or even pass custom formatting functions.
2. Another newly supported type: violin plots. You can do all of the regular grouping/faceting stuff, but here's a straightforward example to illustrate. grantmcdermott.com/tinyplot/man...

June 3, 2025 at 8:47 PM
2. Another newly supported type: violin plots. You can do all of the regular grouping/faceting stuff, but here's a straightforward example to illustrate. grantmcdermott.com/tinyplot/man...
1. We've added support for more plot types, including barplots. This was one of the last remaining "canonical" base plot types that we've wanted to cover. You can do regular stacked or dodged plots, as well as fancier pyramid / centered barplots. grantmcdermott.com/tinyplot/man...


June 3, 2025 at 8:47 PM
1. We've added support for more plot types, including barplots. This was one of the last remaining "canonical" base plot types that we've wanted to cover. You can do regular stacked or dodged plots, as well as fancier pyramid / centered barplots. grantmcdermott.com/tinyplot/man...
Children briefly fascinated by this rare piece of steampunk technology.
("Why doesn't it know about Spotify?")
("Why doesn't it know about Spotify?")
May 24, 2025 at 5:34 PM
Children briefly fascinated by this rare piece of steampunk technology.
("Why doesn't it know about Spotify?")
("Why doesn't it know about Spotify?")
Squirreled away in coastal BnB with dodgy wifi. Minecraft-like feed but at least audio is clear. Much as I (genuinely) like Saints, I feel UBB deserve this because of @lrberge.bsky.social's prolific output.

May 24, 2025 at 3:40 PM
Squirreled away in coastal BnB with dodgy wifi. Minecraft-like feed but at least audio is clear. Much as I (genuinely) like Saints, I feel UBB deserve this because of @lrberge.bsky.social's prolific output.
The main `tinyplot()` function (shorthand alias: `plt()`) has also gained some new features and arguments. For example, the `flip` argument allows you to flip the axes of any plot type.
4/5
4/5

February 6, 2025 at 9:25 PM
The main `tinyplot()` function (shorthand alias: `plt()`) has also gained some new features and arguments. For example, the `flip` argument allows you to flip the axes of any plot type.
4/5
4/5