


Gabriella Conti
@gabriconti.bsky.social
Professor of Economics at UCL
Research Fellow at IFS, CEPR, CESIFO, IZA
Research Fellow at IFS, CEPR, CESIFO, IZA
Reposted by Gabriella Conti

Was wonderful to have you, thanks for coming!
November 10, 2025 at 3:43 AM
Was wonderful to have you, thanks for coming!

And this piece in fortune is also well written fortune.com/well/article...

The 'menopause penalty': Many women in midlife see a drop in wages, new study finds | Fortune Well
A new study asserts that women experience a drop in earnings at the end of their child-bearing years.
fortune.com
November 9, 2025 at 8:47 PM
And this piece in fortune is also well written fortune.com/well/article...
Thanks a lot for the interest!
The press release is probably useful: www.ucl.ac.uk/news/2025/ma...
The press release is probably useful: www.ucl.ac.uk/news/2025/ma...

Women’s earnings fall 10% four years after menopause diagnosis
Women experience a significant fall in earnings in the years following a menopause diagnosis, with more women stopping work and others working fewer hours, according to a new UCL study published by th...
www.ucl.ac.uk
November 9, 2025 at 8:46 PM
Thanks a lot for the interest!
The press release is probably useful: www.ucl.ac.uk/news/2025/ma...
The press release is probably useful: www.ucl.ac.uk/news/2025/ma...
Thanks very much to all who donated!

October 19, 2025 at 9:26 AM
Thanks very much to all who donated!
These steps can help narrow Italy’s regional gaps and improve life chances for every child.
➡️ The geography of child disability is the geography of inequality — but new data can guide smarter policy.
📄 paper 👉 ifs.org.uk/publications...
(n/n)
➡️ The geography of child disability is the geography of inequality — but new data can guide smarter policy.
📄 paper 👉 ifs.org.uk/publications...
(n/n)
The geography of child disability in Italy: new evidence from administrative data | Institute for Fiscal Studies
We present new evidence from unique administrative data on child disability in Italy, examining prevalence by geography and age.
ifs.org.uk
October 15, 2025 at 1:08 AM
These steps can help narrow Italy’s regional gaps and improve life chances for every child.
➡️ The geography of child disability is the geography of inequality — but new data can guide smarter policy.
📄 paper 👉 ifs.org.uk/publications...
(n/n)
➡️ The geography of child disability is the geography of inequality — but new data can guide smarter policy.
📄 paper 👉 ifs.org.uk/publications...
(n/n)
👶 Enhance early detection and intervention programmes in disadvantaged areas — early action changes life trajectories.
💶 Expand financial support for low-income families raising disabled children.
(7/n)
💶 Expand financial support for low-income families raising disabled children.
(7/n)
October 15, 2025 at 1:06 AM
👶 Enhance early detection and intervention programmes in disadvantaged areas — early action changes life trajectories.
💶 Expand financial support for low-income families raising disabled children.
(7/n)
💶 Expand financial support for low-income families raising disabled children.
(7/n)
Policy lessons 🧩
🎯 Target resources and interventions in regions with higher disability rates — especially southern Italy.
🏥 Improve socio-economic and environmental conditions + strengthen healthcare quality and accessibility through specialist services & telemedicine.
(6/n)
🎯 Target resources and interventions in regions with higher disability rates — especially southern Italy.
🏥 Improve socio-economic and environmental conditions + strengthen healthcare quality and accessibility through specialist services & telemedicine.
(6/n)
October 15, 2025 at 1:06 AM
Policy lessons 🧩
🎯 Target resources and interventions in regions with higher disability rates — especially southern Italy.
🏥 Improve socio-economic and environmental conditions + strengthen healthcare quality and accessibility through specialist services & telemedicine.
(6/n)
🎯 Target resources and interventions in regions with higher disability rates — especially southern Italy.
🏥 Improve socio-economic and environmental conditions + strengthen healthcare quality and accessibility through specialist services & telemedicine.
(6/n)
🏥 Local context shapes children’s lives.
Higher disability rates appear where:
• economic vulnerability is high
• employment is low
• avoidable & infant mortality are higher
• families must travel for care (“health emigration”).
(5/n)
Higher disability rates appear where:
• economic vulnerability is high
• employment is low
• avoidable & infant mortality are higher
• families must travel for care (“health emigration”).
(5/n)
October 15, 2025 at 1:06 AM
🏥 Local context shapes children’s lives.
Higher disability rates appear where:
• economic vulnerability is high
• employment is low
• avoidable & infant mortality are higher
• families must travel for care (“health emigration”).
(5/n)
Higher disability rates appear where:
• economic vulnerability is high
• employment is low
• avoidable & infant mortality are higher
• families must travel for care (“health emigration”).
(5/n)
💰 Family income matters.
Children from the poorest families are almost twice as likely to be disabled as those in the richest deciles — even when using pre-birth parental earnings.
(4/n)
Children from the poorest families are almost twice as likely to be disabled as those in the richest deciles — even when using pre-birth parental earnings.
(4/n)

October 15, 2025 at 1:06 AM
💰 Family income matters.
Children from the poorest families are almost twice as likely to be disabled as those in the richest deciles — even when using pre-birth parental earnings.
(4/n)
Children from the poorest families are almost twice as likely to be disabled as those in the richest deciles — even when using pre-birth parental earnings.
(4/n)
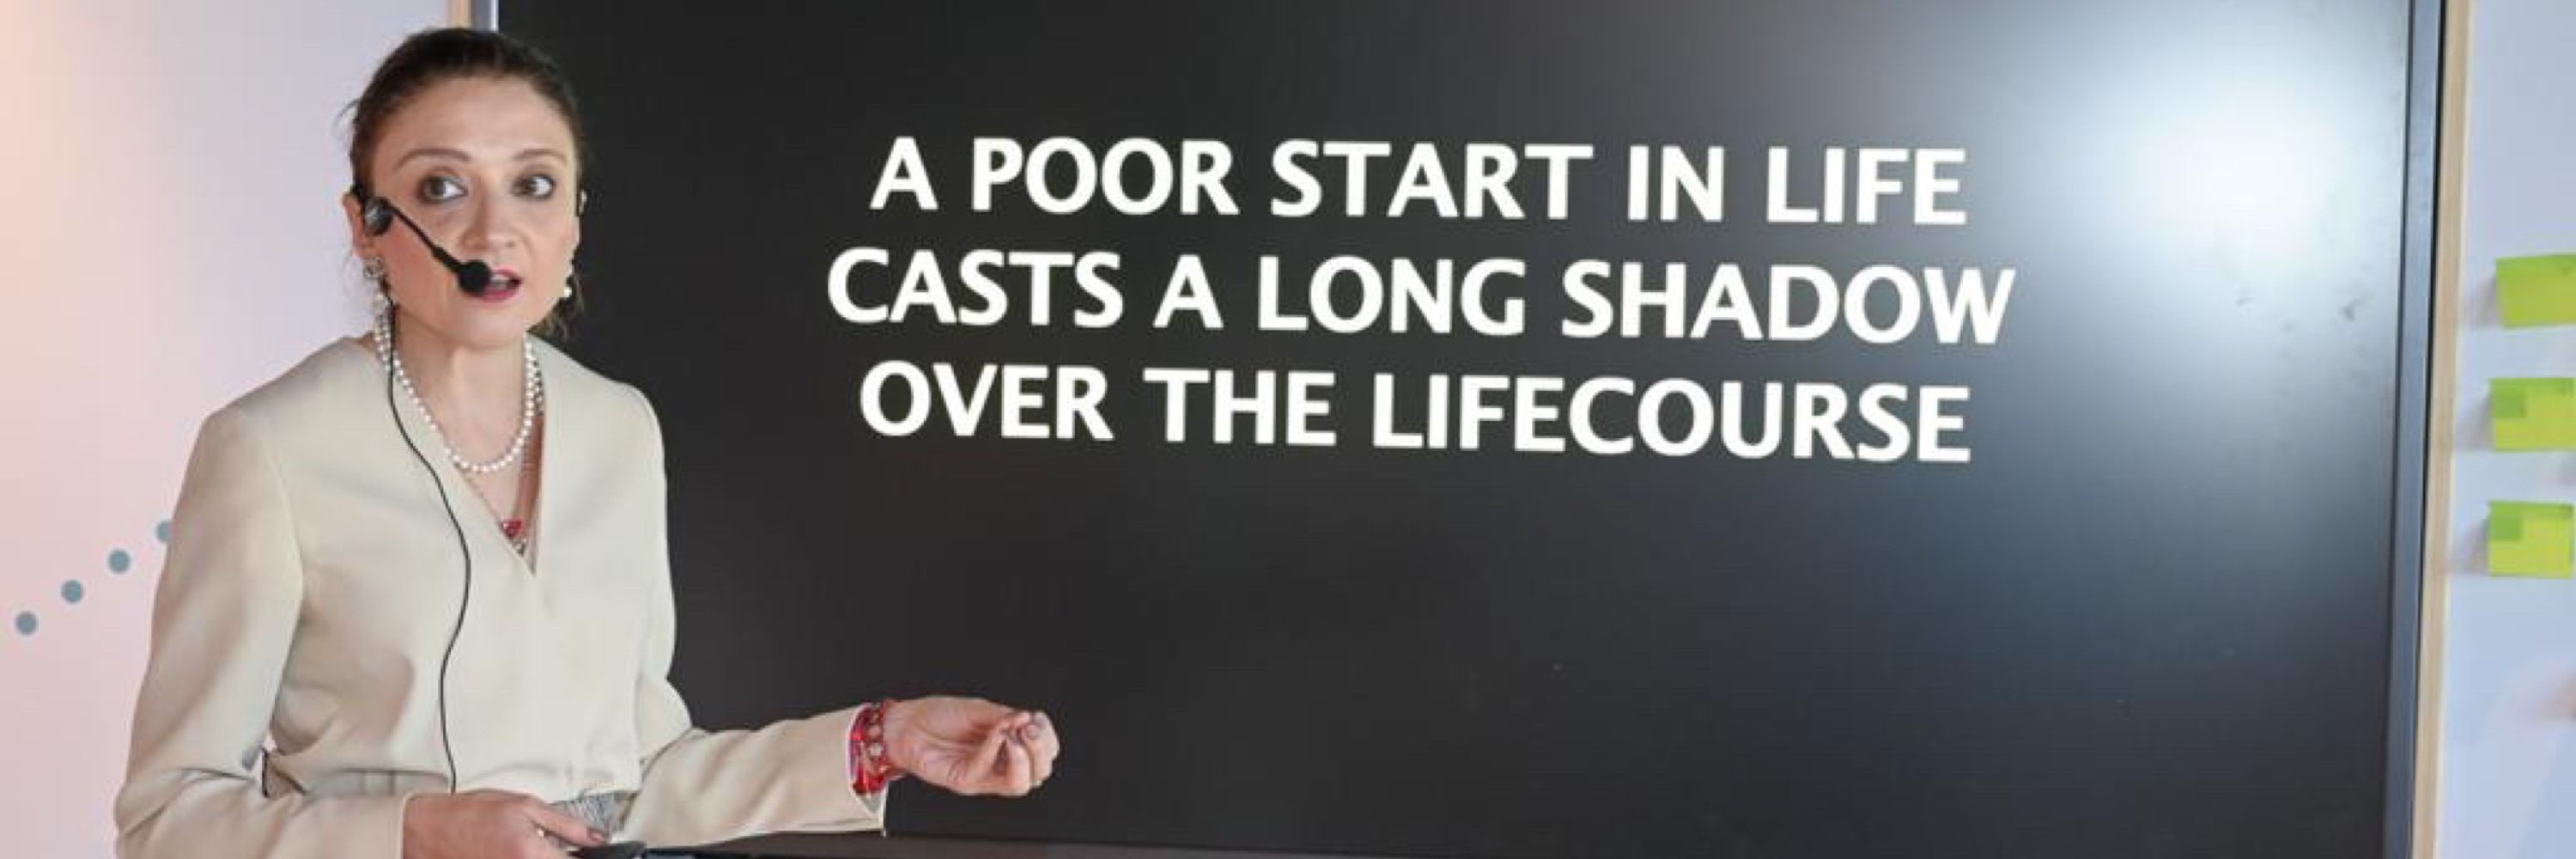
🧭 A clear North–South divide emerges and widens with age — also for more severe disabilities — a pattern that may reflect both later diagnosis in areas with weaker health systems and the cumulative effects of poorer living conditions in the South.
(3/n)
(3/n)


October 15, 2025 at 1:05 AM
🧭 A clear North–South divide emerges and widens with age — also for more severe disabilities — a pattern that may reflect both later diagnosis in areas with weaker health systems and the cumulative effects of poorer living conditions in the South.
(3/n)
(3/n)
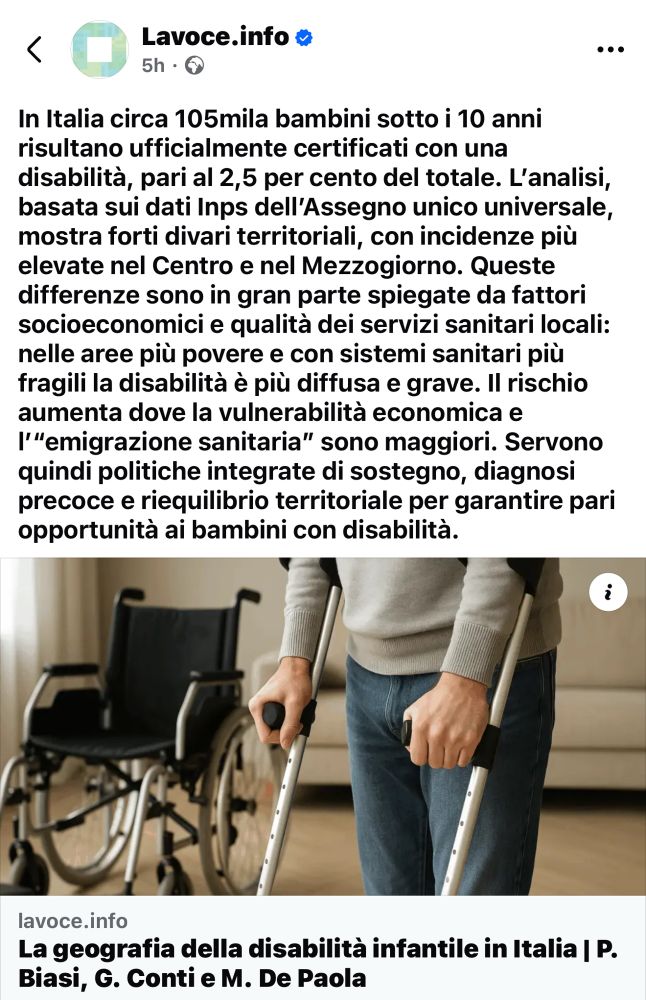
📍 For the first time, we provide a nationally representative map of child disability in Italy: 105,000 children (2.5%) are officially certified as disabled. (2/n)
October 15, 2025 at 1:05 AM
📍 For the first time, we provide a nationally representative map of child disability in Italy: 105,000 children (2.5%) are officially certified as disabled. (2/n)