


Nathan Yau
@flowingdata.com
Playing with data, visualizing it for humans at flowingdata.com
Difference charts to show the differences between different groups, which show difference in days.
November 5, 2025 at 5:44 PM
Difference charts to show the differences between different groups, which show difference in days.
Halloween logicals, still the best 10/31 venn

October 31, 2025 at 10:52 PM
Halloween logicals, still the best 10/31 venn
If we define middle-class income based on median, a la @pewresearch.org, what qualifies as middle income changes by state and household size flowingdata.com/2025/10/23/m...
October 28, 2025 at 4:51 PM
If we define middle-class income based on median, a la @pewresearch.org, what qualifies as middle income changes by state and household size flowingdata.com/2025/10/23/m...
California pulls to the top for most expensive and Arkansas pulls down for lowest cost of living overall

October 16, 2025 at 8:50 PM
California pulls to the top for most expensive and Arkansas pulls down for lowest cost of living overall
October 16, 2025 at 7:40 PM
Vermont, New Hampshire, and Montana, I was not familiar.

October 2, 2025 at 8:59 PM
Vermont, New Hampshire, and Montana, I was not familiar.

With our old friend the beeswarm, we get a bottom-heavy distribution with bumps at the round numbers, about every $20k up to $100k in median salary. Then the jobs grow sparse.

September 9, 2025 at 3:59 PM
With our old friend the beeswarm, we get a bottom-heavy distribution with bumps at the round numbers, about every $20k up to $100k in median salary. Then the jobs grow sparse.
Still have this hanging out on the wall

August 20, 2025 at 4:32 PM
Still have this hanging out on the wall
My favorite bit is the stacks with a Sankey flourish and water lines to indicate flow. This could've easily been five simple stacked bar multiples, but this little part shows that they care.

July 29, 2025 at 4:56 PM
My favorite bit is the stacks with a Sankey flourish and water lines to indicate flow. This could've easily been five simple stacked bar multiples, but this little part shows that they care.
They went with the @scottreinhard.bsky.social flare, using 3-D elevation scottreinhard.com/Mapping-and-...

July 29, 2025 at 4:51 PM
They went with the @scottreinhard.bsky.social flare, using 3-D elevation scottreinhard.com/Mapping-and-...
Notes of the 1870 Statistical Atlas of the United States, especially in the titles www.loc.gov/item/05019329/


July 29, 2025 at 4:44 PM
Notes of the 1870 Statistical Atlas of the United States, especially in the titles www.loc.gov/item/05019329/
If you see this, quote post with a robot that isn’t from Star Wars, Star Trek, Dr Who and Transformers

July 10, 2025 at 3:18 AM
If you see this, quote post with a robot that isn’t from Star Wars, Star Trek, Dr Who and Transformers
National Weather Service, very important.

July 7, 2025 at 5:42 PM
National Weather Service, very important.
Neal Agarwal took it the other direction with an elevator to space neal.fun/space-elevat...

June 24, 2025 at 7:56 PM
Neal Agarwal took it the other direction with an elevator to space neal.fun/space-elevat...
In 2010, Bill Marsh used a similar method to show the depths of the ocean in the context of the Deepwater Horizon oil well archive.nytimes.com/www.nytimes....

June 24, 2025 at 7:53 PM
In 2010, Bill Marsh used a similar method to show the depths of the ocean in the context of the Deepwater Horizon oil well archive.nytimes.com/www.nytimes....
A long graphic shows the scale and depth of the bunker-buster bombs. Scroll and scroll more, past the height of a 22-story building www.nytimes.com/interactive/...

June 24, 2025 at 7:47 PM
A long graphic shows the scale and depth of the bunker-buster bombs. Scroll and scroll more, past the height of a 22-story building www.nytimes.com/interactive/...
The most common jobs by age and sex flowingdata.com/2024/10/02/p...

May 29, 2025 at 7:11 PM
The most common jobs by age and sex flowingdata.com/2024/10/02/p...
Upside Down World by @rsimmon.bsky.social is a reminder that there is no spoon. I mean there is no up. www.mapcenter.com/store/p/upsi...

May 22, 2025 at 10:52 PM
Upside Down World by @rsimmon.bsky.social is a reminder that there is no spoon. I mean there is no up. www.mapcenter.com/store/p/upsi...
World map with south on top and Brazil in center, from Brazil's stat agency. Do all countries do this?

May 15, 2025 at 4:08 PM
World map with south on top and Brazil in center, from Brazil's stat agency. Do all countries do this?
Takes me back to the Cox classic from 2011 on dress sizes, mixed with hurricane traces


May 8, 2025 at 8:40 PM
Takes me back to the Cox classic from 2011 on dress sizes, mixed with hurricane traces
Into the silhouette traces by @graphics.reuters.com to show Met Gala dress patterns over the years www.reuters.com/graphics/USA...

May 8, 2025 at 8:36 PM
Into the silhouette traces by @graphics.reuters.com to show Met Gala dress patterns over the years www.reuters.com/graphics/USA...
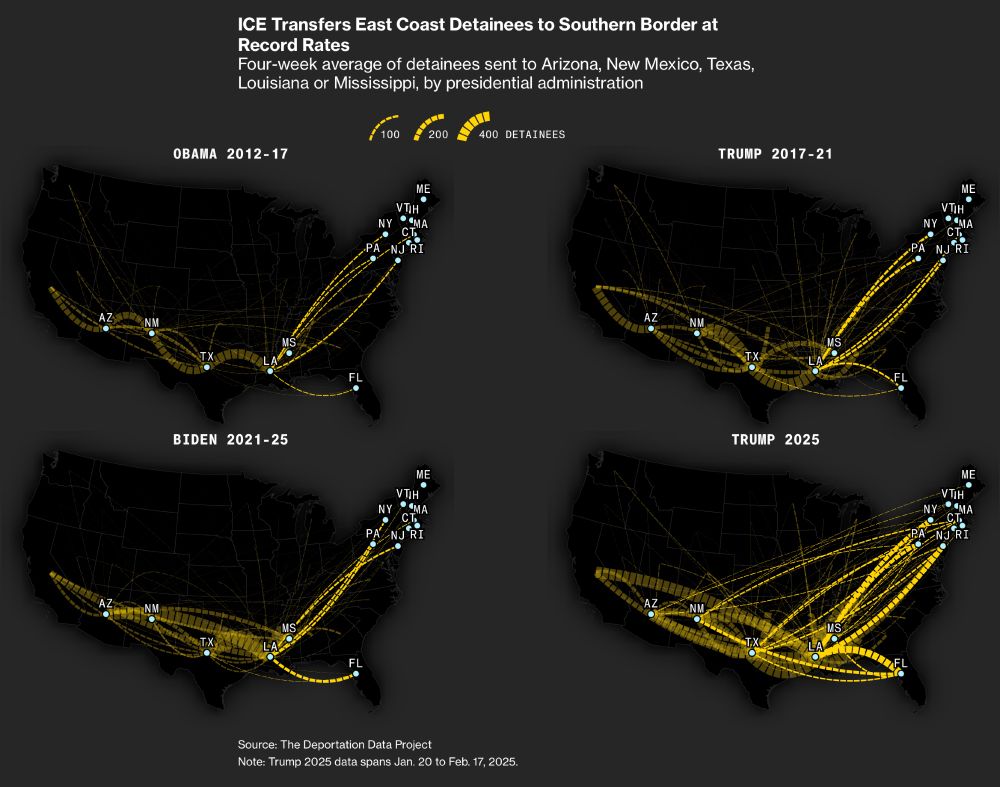
Bloomberg with the maps www.bloomberg.com/graphics/202...
May 2, 2025 at 4:21 PM
Bloomberg with the maps www.bloomberg.com/graphics/202...
Yeah... same in safari, chrome, and firefox. No ad blockers, etc

April 11, 2025 at 4:36 PM
Yeah... same in safari, chrome, and firefox. No ad blockers, etc