


Fernando Becerra
@fbecerra.bsky.social
Data analysis + visualization freelancer. Python and d3.js. Ph.D. in Astronomy and Astrophysics. www.fernandobecerra.com
Reposted by Fernando Becerra

With a huge thanks to @openclimatedata.net, LayerCake v9.0.0 is out with significant TypeScript additions, proper end-to-end tests and all-new, Svelte 5 components in the component gallery!
There will likely be improvements so please file an issue or a PR with any changes!
layercake.graphics
There will likely be improvements so please file an issue or a PR with any changes!
layercake.graphics

Layer Cake
A framework for mostly-reusable graphics with svelte
layercake.graphics
July 25, 2025 at 12:49 AM
With a huge thanks to @openclimatedata.net, LayerCake v9.0.0 is out with significant TypeScript additions, proper end-to-end tests and all-new, Svelte 5 components in the component gallery!
There will likely be improvements so please file an issue or a PR with any changes!
layercake.graphics
There will likely be improvements so please file an issue or a PR with any changes!
layercake.graphics
Reposted by Fernando Becerra

Restored at least the front page to clients.truth-and-beauty.net/oecd/better-... — working on the subpages in the new few days and weeks…
OECD Better Life Index
clients.truth-and-beauty.net
July 1, 2025 at 7:05 AM
Restored at least the front page to clients.truth-and-beauty.net/oecd/better-... — working on the subpages in the new few days and weeks…
Estimadxs, esta semana son los últimos días para inscribirse en el curso de visualización de datos en español. Toda la información en
inscripcion.dataista.studio
@johnguerra.bsky.social @albertocairo.com @carmen-tm.bsky.social
inscripcion.dataista.studio
@johnguerra.bsky.social @albertocairo.com @carmen-tm.bsky.social

Dataista: Inscripción cursos de visualización de datos
¡Gracias por tu interés en nuestros cursos de Visualización de Datos! A continuación, encontrarás los detalles del curso y los precios, así como las fechas y horarios disponibles. Por favor, seleccion...
inscripcion.dataista.studio
June 4, 2025 at 10:56 PM
Estimadxs, esta semana son los últimos días para inscribirse en el curso de visualización de datos en español. Toda la información en
inscripcion.dataista.studio
@johnguerra.bsky.social @albertocairo.com @carmen-tm.bsky.social
inscripcion.dataista.studio
@johnguerra.bsky.social @albertocairo.com @carmen-tm.bsky.social
¡Charla abierta de visualización de datos!
Como parte de la oferta de cursos 2025, @dataista-cl.bsky.social estará ofreciendo una clase abierta de visualización de datos e lunes 2 de junio a las 19:00 horas de Santiago.
Inscripción: forms.gle/rLHYfuDmJdEt...
Como parte de la oferta de cursos 2025, @dataista-cl.bsky.social estará ofreciendo una clase abierta de visualización de datos e lunes 2 de junio a las 19:00 horas de Santiago.
Inscripción: forms.gle/rLHYfuDmJdEt...

Charla abierta de Visualización de Datos
Como parte de nuestra oferta de cursos de Visualización de Datos 2025, estaremos dando una charla abierta sobre visualización de datos, mostrando las tendencias actuales y lo que es posible hacer usan...
forms.gle
May 23, 2025 at 4:36 PM
¡Charla abierta de visualización de datos!
Como parte de la oferta de cursos 2025, @dataista-cl.bsky.social estará ofreciendo una clase abierta de visualización de datos e lunes 2 de junio a las 19:00 horas de Santiago.
Inscripción: forms.gle/rLHYfuDmJdEt...
Como parte de la oferta de cursos 2025, @dataista-cl.bsky.social estará ofreciendo una clase abierta de visualización de datos e lunes 2 de junio a las 19:00 horas de Santiago.
Inscripción: forms.gle/rLHYfuDmJdEt...
Reposted by Fernando Becerra

A trick for fitting world maps on phones:
Stack two azimuthal equal-area projections, clipped at 90° longitude, each one rotated 180° from the other.
The bottom map covers the top's Antarctica, which reduces the total height and looks nice.
As seen in www.nytimes.com/2025/04/25/c...
Stack two azimuthal equal-area projections, clipped at 90° longitude, each one rotated 180° from the other.
The bottom map covers the top's Antarctica, which reduces the total height and looks nice.
As seen in www.nytimes.com/2025/04/25/c...

April 27, 2025 at 1:23 AM
A trick for fitting world maps on phones:
Stack two azimuthal equal-area projections, clipped at 90° longitude, each one rotated 180° from the other.
The bottom map covers the top's Antarctica, which reduces the total height and looks nice.
As seen in www.nytimes.com/2025/04/25/c...
Stack two azimuthal equal-area projections, clipped at 90° longitude, each one rotated 180° from the other.
The bottom map covers the top's Antarctica, which reduces the total height and looks nice.
As seen in www.nytimes.com/2025/04/25/c...
Interesadxs en cursos de analisis y visualizacion de datos **en español**? Con @dataista-cl.bsky.social estamos planeando algunos para marzo/abril! Si estas interesadx contactanos por interno!
Algunas reflexiones sobre enseñar #dataviz aca: www.linkedin.com/feed/update/...
@albertocairo.com
Algunas reflexiones sobre enseñar #dataviz aca: www.linkedin.com/feed/update/...
@albertocairo.com

Fernando Becerra on LinkedIn: #datascience #dataviz #datavisualization
Quiero contar algunos aprendizajes de haber dictado el curso de "Visualización de la información" por tres años seguidos y ademas compartir el material que…
www.linkedin.com
January 16, 2025 at 12:53 AM
Interesadxs en cursos de analisis y visualizacion de datos **en español**? Con @dataista-cl.bsky.social estamos planeando algunos para marzo/abril! Si estas interesadx contactanos por interno!
Algunas reflexiones sobre enseñar #dataviz aca: www.linkedin.com/feed/update/...
@albertocairo.com
Algunas reflexiones sobre enseñar #dataviz aca: www.linkedin.com/feed/update/...
@albertocairo.com
Reposted by Fernando Becerra

Exciting news! From next year on we at @spiegel.de are going to train a data & visual journalist (Volontariat).
🎓 Data journalism training via the Lede program & in our team
🪄 Work on projects together with some of the best data journalists in Germany
...
➡️ jobs.spiegelgruppe.de/Vacancies/12...
🎓 Data journalism training via the Lede program & in our team
🪄 Work on projects together with some of the best data journalists in Germany
...
➡️ jobs.spiegelgruppe.de/Vacancies/12...

December 9, 2024 at 11:39 AM
Exciting news! From next year on we at @spiegel.de are going to train a data & visual journalist (Volontariat).
🎓 Data journalism training via the Lede program & in our team
🪄 Work on projects together with some of the best data journalists in Germany
...
➡️ jobs.spiegelgruppe.de/Vacancies/12...
🎓 Data journalism training via the Lede program & in our team
🪄 Work on projects together with some of the best data journalists in Germany
...
➡️ jobs.spiegelgruppe.de/Vacancies/12...
Reposted by Fernando Becerra

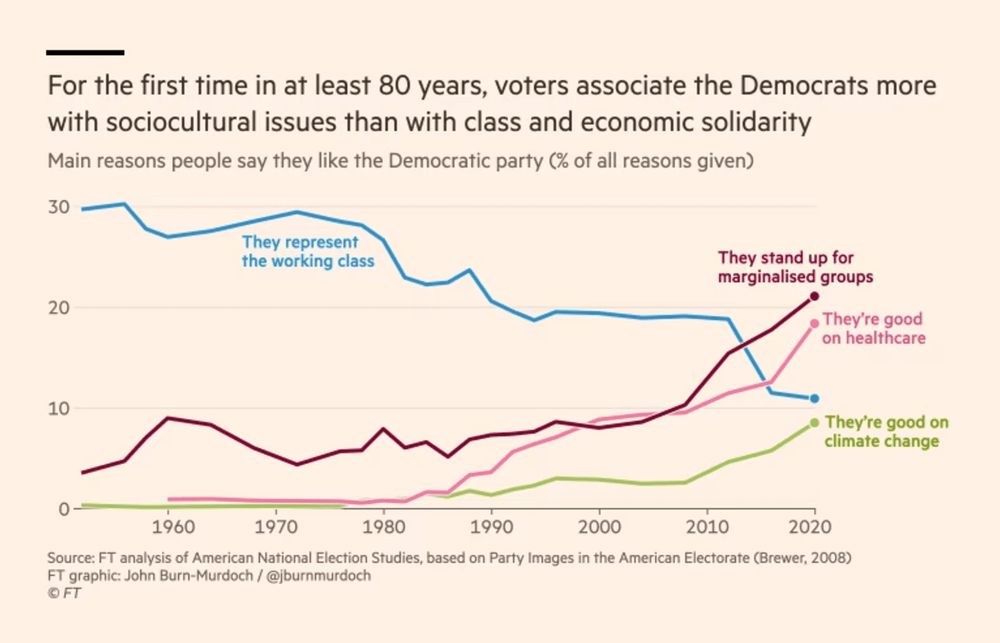
Trying something new:
A 🧵 on a topic I find many students struggle with: "why do their 📊 look more professional than my 📊?"
It's *lots* of tiny decisions that aren't the defaults in many libraries, so let's break down 1 simple graph by @jburnmurdoch.bsky.social
🔗 www.ft.com/content/73a1...
A 🧵 on a topic I find many students struggle with: "why do their 📊 look more professional than my 📊?"
It's *lots* of tiny decisions that aren't the defaults in many libraries, so let's break down 1 simple graph by @jburnmurdoch.bsky.social
🔗 www.ft.com/content/73a1...
November 20, 2024 at 5:09 PM
Trying something new:
A 🧵 on a topic I find many students struggle with: "why do their 📊 look more professional than my 📊?"
It's *lots* of tiny decisions that aren't the defaults in many libraries, so let's break down 1 simple graph by @jburnmurdoch.bsky.social
🔗 www.ft.com/content/73a1...
A 🧵 on a topic I find many students struggle with: "why do their 📊 look more professional than my 📊?"
It's *lots* of tiny decisions that aren't the defaults in many libraries, so let's break down 1 simple graph by @jburnmurdoch.bsky.social
🔗 www.ft.com/content/73a1...
Reposted by Fernando Becerra

Ready to learn how to use LiDAR for research in #forestry and natural resources using #R? This week I am releasing a 7-part series to help you get started! Share with anyone you know who wants to get started. Part 1 covers acquiring, & viewing LiDAR data! bit.ly/lidR-module1
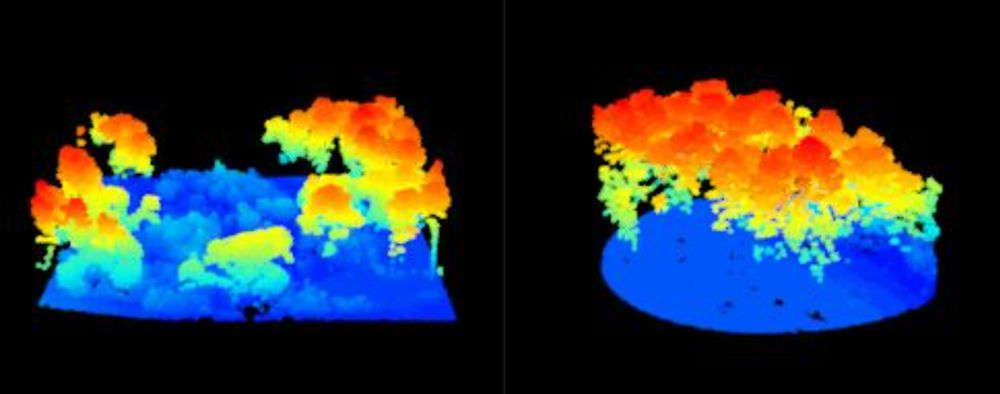
Module 1: Getting started with LiDAR processing for forestry and natural resources - The Jones Center at Ichauway Research Labs
If you are interested in learning to use LiDAR for forestry and natural resources, this tutorial can help you get started. You will learn to view large datasets, create raster products, map trees, and...
bit.ly
November 21, 2024 at 1:57 AM
Ready to learn how to use LiDAR for research in #forestry and natural resources using #R? This week I am releasing a 7-part series to help you get started! Share with anyone you know who wants to get started. Part 1 covers acquiring, & viewing LiDAR data! bit.ly/lidR-module1
Reposted by Fernando Becerra

My students always ask me what they can do as individuals for climate, and here’s what I tell them:
1. Vote for candidates that will do something about climate change
2. Ride a bike
3. Stop eating meat (or at least beef and dairy)
4. Fly less
1. Vote for candidates that will do something about climate change
2. Ride a bike
3. Stop eating meat (or at least beef and dairy)
4. Fly less
November 2, 2024 at 7:57 PM
My students always ask me what they can do as individuals for climate, and here’s what I tell them:
1. Vote for candidates that will do something about climate change
2. Ride a bike
3. Stop eating meat (or at least beef and dairy)
4. Fly less
1. Vote for candidates that will do something about climate change
2. Ride a bike
3. Stop eating meat (or at least beef and dairy)
4. Fly less
🎉 New viz! Today the ONE campaign launched the #TrillionsTracker, and I got to code this wonderful flowing Sankey diagram designed by @parabole.bsky.social.
You can see it in action here: data.one.org/TrillionsTra...
You can see it in action here: data.one.org/TrillionsTra...

September 26, 2024 at 12:38 AM
🎉 New viz! Today the ONE campaign launched the #TrillionsTracker, and I got to code this wonderful flowing Sankey diagram designed by @parabole.bsky.social.
You can see it in action here: data.one.org/TrillionsTra...
You can see it in action here: data.one.org/TrillionsTra...
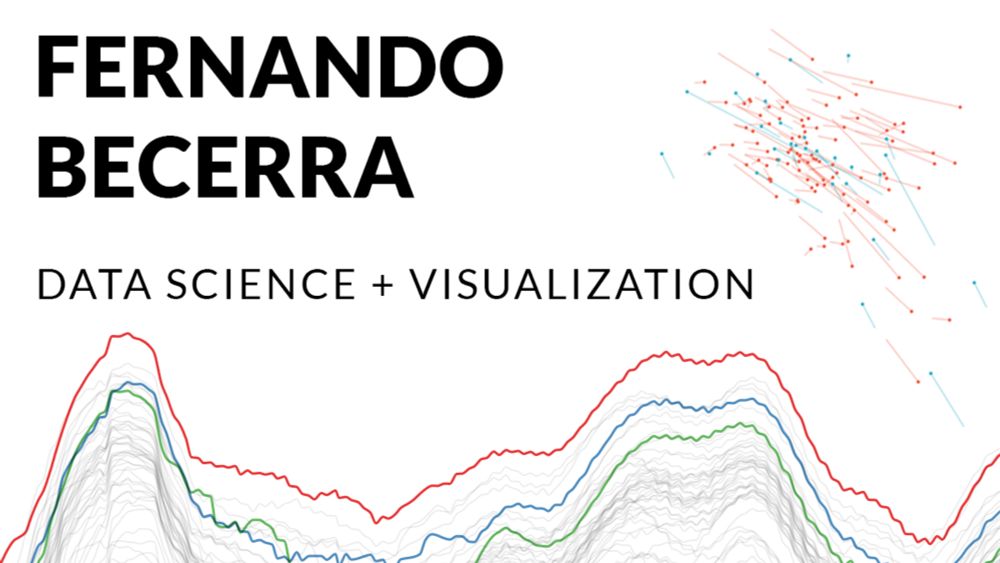
Since the dataviz community seems to be moving to this site, I'll introduce myself: I'm a data analysis and visualization freelancer based in Chile. I've done work for The New York Times, Urban Institute, USAFacts, Planet Labs, The Baltimore Banner, and more.
My portfolio: www.fernandobecerra.com
My portfolio: www.fernandobecerra.com
Fernando Becerra | Data Analysis + Visualization
Fernando Becerra is an astrophysicist turned data analyst and data visualization developer. His work is a mix of research, data science, analysis, and visualization in order to create interactive tool...
www.fernandobecerra.com
September 2, 2024 at 9:12 PM
Since the dataviz community seems to be moving to this site, I'll introduce myself: I'm a data analysis and visualization freelancer based in Chile. I've done work for The New York Times, Urban Institute, USAFacts, Planet Labs, The Baltimore Banner, and more.
My portfolio: www.fernandobecerra.com
My portfolio: www.fernandobecerra.com