


Eva Vivalt
@evavivalt.bsky.social
Assistant prof in economics at the University of Toronto, research on cash transfers and evidence-based decision-making, J-PAL affiliate. https://evavivalt.com/
Our panelists are great!
We have a paid forecaster panel that takes the majority of the surveys posted on the platform. And they do very well in comparison to other users.
We have a paid forecaster panel that takes the majority of the surveys posted on the platform. And they do very well in comparison to other users.

November 24, 2025 at 3:43 PM
Our panelists are great!
We have a paid forecaster panel that takes the majority of the surveys posted on the platform. And they do very well in comparison to other users.
We have a paid forecaster panel that takes the majority of the surveys posted on the platform. And they do very well in comparison to other users.
Interestingly, high self-reported confidence is associated with lower accuracy. This is dissimilar to most of the literature.
In our setting, we can track individual forecasters over time. And thus we can observe: this result is driven by overconfident forecasters.
In our setting, we can track individual forecasters over time. And thus we can observe: this result is driven by overconfident forecasters.

November 24, 2025 at 3:43 PM
Interestingly, high self-reported confidence is associated with lower accuracy. This is dissimilar to most of the literature.
In our setting, we can track individual forecasters over time. And thus we can observe: this result is driven by overconfident forecasters.
In our setting, we can track individual forecasters over time. And thus we can observe: this result is driven by overconfident forecasters.
First result: forecasters tend to overestimate treatment effects - but there is a lot of signal in the forecasts made.
This means that forecasts can be informative in power calculations or determining which interventions to trial.
This means that forecasts can be informative in power calculations or determining which interventions to trial.

November 24, 2025 at 3:43 PM
First result: forecasters tend to overestimate treatment effects - but there is a lot of signal in the forecasts made.
This means that forecasts can be informative in power calculations or determining which interventions to trial.
This means that forecasts can be informative in power calculations or determining which interventions to trial.
🚨 New working paper!
How well do people predict the results of studies?
@sdellavi.bsky.social and I leverage data from the first 100 studies to have been posted on the SSPP, containing 1,482 key questions, on which over 50,000 forecasts were placed. Some surprising results below.... 🧵👇
How well do people predict the results of studies?
@sdellavi.bsky.social and I leverage data from the first 100 studies to have been posted on the SSPP, containing 1,482 key questions, on which over 50,000 forecasts were placed. Some surprising results below.... 🧵👇

November 24, 2025 at 3:43 PM
🚨 New working paper!
How well do people predict the results of studies?
@sdellavi.bsky.social and I leverage data from the first 100 studies to have been posted on the SSPP, containing 1,482 key questions, on which over 50,000 forecasts were placed. Some surprising results below.... 🧵👇
How well do people predict the results of studies?
@sdellavi.bsky.social and I leverage data from the first 100 studies to have been posted on the SSPP, containing 1,482 key questions, on which over 50,000 forecasts were placed. Some surprising results below.... 🧵👇
3) We previously included quarterly regression results, but we obtained some updated administrative data and made some nicer plots. For example, here is an event study plot looking at employment status. 11/

September 2, 2025 at 8:38 PM
3) We previously included quarterly regression results, but we obtained some updated administrative data and made some nicer plots. For example, here is an event study plot looking at employment status. 11/
Yes, there are some negative impacts on labor supply and income excluding the transfers. People also do stuff with that money.
This second new figure helps illustrate the overall effects - and what doesn't move. 10/
This second new figure helps illustrate the overall effects - and what doesn't move. 10/

September 2, 2025 at 8:38 PM
Yes, there are some negative impacts on labor supply and income excluding the transfers. People also do stuff with that money.
This second new figure helps illustrate the overall effects - and what doesn't move. 10/
This second new figure helps illustrate the overall effects - and what doesn't move. 10/
We've updated a paper on the 3-year, $1000/month U.S. guaranteed income study.
New results, in 3 figures: 🧵
1) Subjective well-being significantly improved in the treatment group in year 1, but there were no significant differences between the treatment & control group after that. 1/
New results, in 3 figures: 🧵
1) Subjective well-being significantly improved in the treatment group in year 1, but there were no significant differences between the treatment & control group after that. 1/

September 2, 2025 at 8:38 PM
We've updated a paper on the 3-year, $1000/month U.S. guaranteed income study.
New results, in 3 figures: 🧵
1) Subjective well-being significantly improved in the treatment group in year 1, but there were no significant differences between the treatment & control group after that. 1/
New results, in 3 figures: 🧵
1) Subjective well-being significantly improved in the treatment group in year 1, but there were no significant differences between the treatment & control group after that. 1/
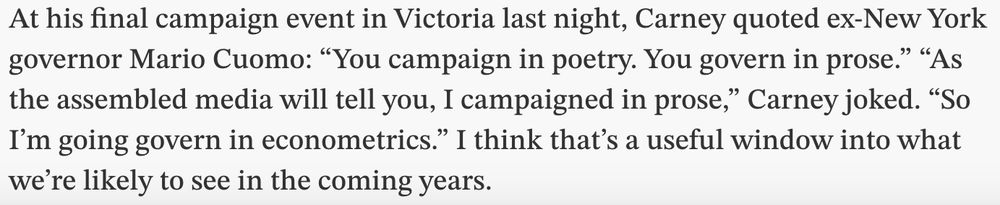
Nice quote! One of the reasons for the Social Science Prediction Platform. A few of the cash transfer evaluations (including our own) collected ex ante forecasts there. @sdellavi.bsky.social

August 27, 2025 at 3:23 PM
Nice quote! One of the reasons for the Social Science Prediction Platform. A few of the cash transfer evaluations (including our own) collected ex ante forecasts there. @sdellavi.bsky.social
Niche, but did you know there is a TTC shop? This is such a perfect fit for my interests (maps, public transit, puzzles) that I have to share. Probably other transit systems make them, too?

July 30, 2025 at 8:31 PM
Niche, but did you know there is a TTC shop? This is such a perfect fit for my interests (maps, public transit, puzzles) that I have to share. Probably other transit systems make them, too?
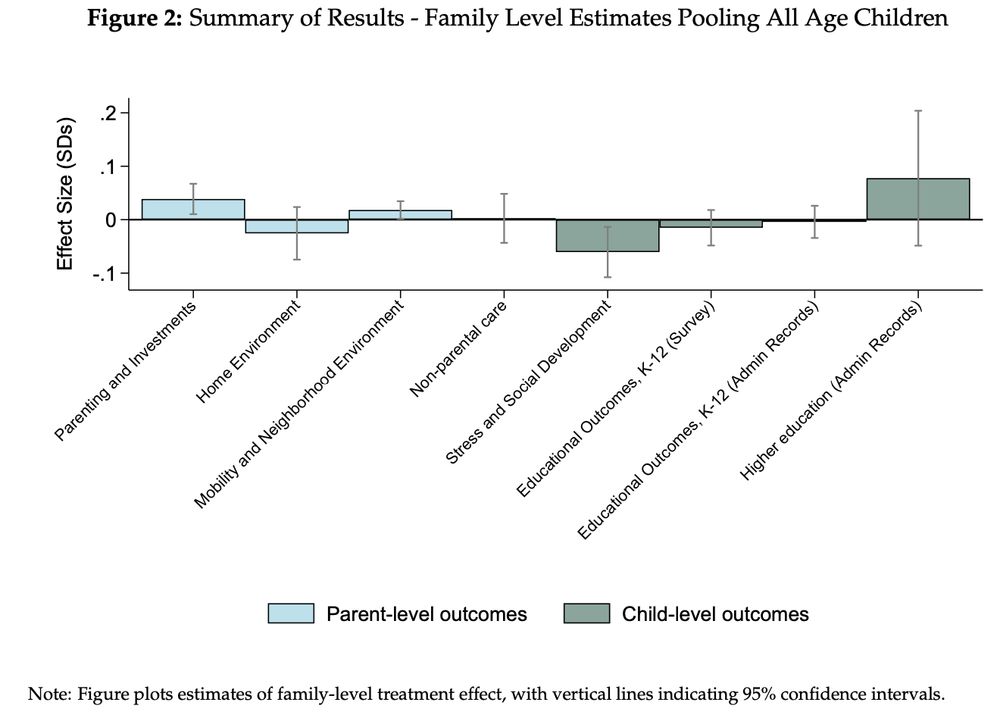
We also see no effects on food insecurity or non-parental care.
Here is an overall summary figure of the main index measures. We can reject even small changes for most outcomes: 15/
Here is an overall summary figure of the main index measures. We can reject even small changes for most outcomes: 15/
July 21, 2025 at 2:56 PM
We also see no effects on food insecurity or non-parental care.
Here is an overall summary figure of the main index measures. We can reject even small changes for most outcomes: 15/
Here is an overall summary figure of the main index measures. We can reject even small changes for most outcomes: 15/
If anything, conditional on a positive pregnancy test, there might be an increase in abortion - but it should be emphasized that this estimate is conditional (i.e., no longer causal) and does not survive false discovery rate corrections. 11/

July 21, 2025 at 2:56 PM
If anything, conditional on a positive pregnancy test, there might be an increase in abortion - but it should be emphasized that this estimate is conditional (i.e., no longer causal) and does not survive false discovery rate corrections. 11/
If you wanted to tell a negative story, you could worry about there maybe being some declines in math (also insignificant after adjusting for multiple hypothesis testing). Is math potentially a bellwether, compared to other subjects? 8/

July 21, 2025 at 2:56 PM
If you wanted to tell a negative story, you could worry about there maybe being some declines in math (also insignificant after adjusting for multiple hypothesis testing). Is math potentially a bellwether, compared to other subjects? 8/
If you wanted to tell a positive story, you could point to the (insignificant) increases in post-secondary enrollment for the small set of children for which we can observe these outcomes and hope that when more children age into it maybe it will be significant. 7/

July 21, 2025 at 2:56 PM
If you wanted to tell a positive story, you could point to the (insignificant) increases in post-secondary enrollment for the small set of children for which we can observe these outcomes and hope that when more children age into it maybe it will be significant. 7/
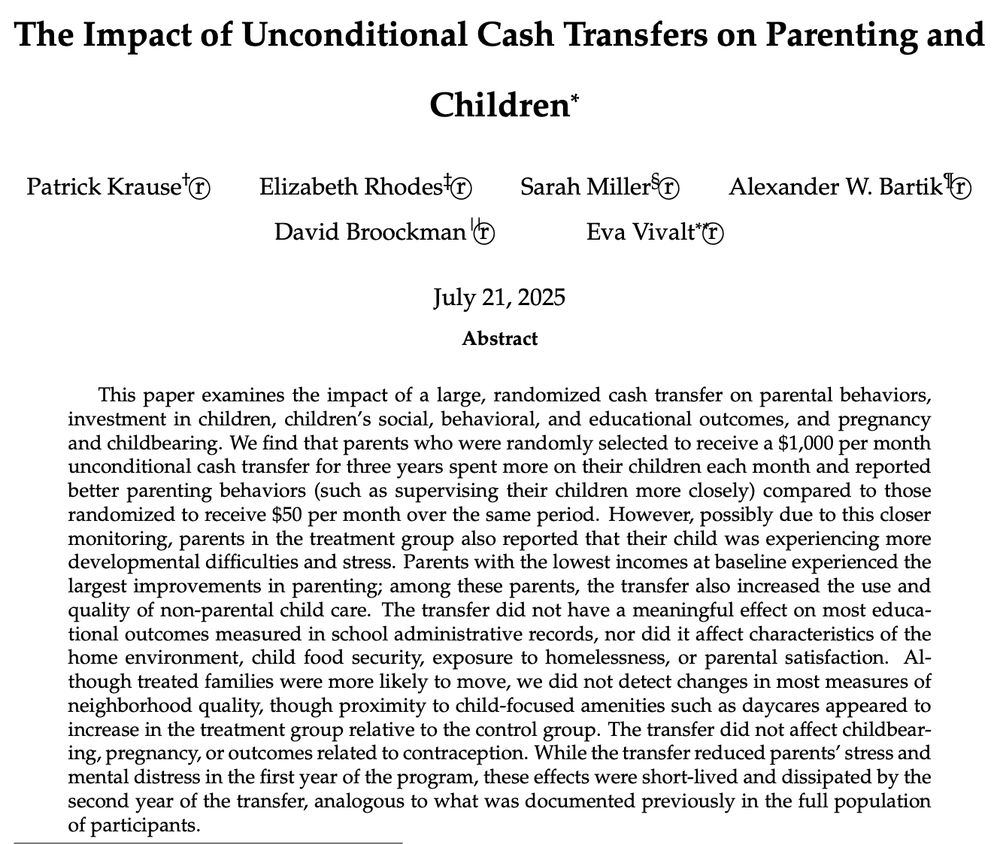
🚨 New NBER working paper: "The Impact of Unconditional Cash Transfers on Parenting and Children"
This paper estimates the effects of receiving a $1,000/month guaranteed income for 3 years, compared to a control group receiving $50/month, on children and parents in the US. 1/
This paper estimates the effects of receiving a $1,000/month guaranteed income for 3 years, compared to a control group receiving $50/month, on children and parents in the US. 1/
July 21, 2025 at 2:56 PM
🚨 New NBER working paper: "The Impact of Unconditional Cash Transfers on Parenting and Children"
This paper estimates the effects of receiving a $1,000/month guaranteed income for 3 years, compared to a control group receiving $50/month, on children and parents in the US. 1/
This paper estimates the effects of receiving a $1,000/month guaranteed income for 3 years, compared to a control group receiving $50/month, on children and parents in the US. 1/
Good day to dust off this old classic:

June 5, 2025 at 11:47 PM
Good day to dust off this old classic:
Apparently the language thing is not a joke. 😬 Should have called them goods surpluses rather than trade deficits.

April 7, 2025 at 3:31 AM
Apparently the language thing is not a joke. 😬 Should have called them goods surpluses rather than trade deficits.

This figure should never happen.

February 24, 2025 at 9:49 AM
This figure should never happen.
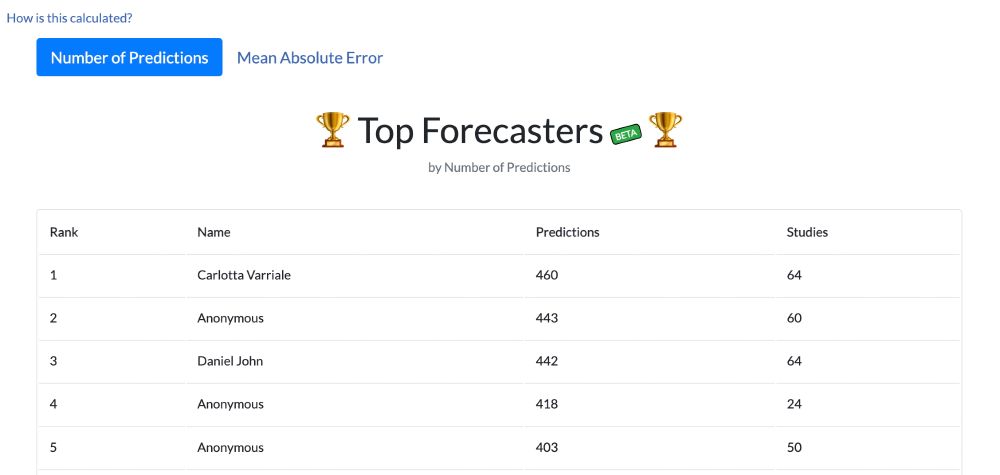
The Social Science Prediction Platform has a new feature: a leaderboard showcasing those who provided the most forecasts or were the most accurate. Forecasters can opt into displaying their name.
You can also see your own rank if logged in. Check it out! @socscipredict.bsky.social
You can also see your own rank if logged in. Check it out! @socscipredict.bsky.social
February 19, 2025 at 9:27 PM
The Social Science Prediction Platform has a new feature: a leaderboard showcasing those who provided the most forecasts or were the most accurate. Forecasters can opt into displaying their name.
You can also see your own rank if logged in. Check it out! @socscipredict.bsky.social
You can also see your own rank if logged in. Check it out! @socscipredict.bsky.social
We found that people over-update on research findings with large confidence intervals and under-update on research findings with small confidence intervals. 2/

January 21, 2025 at 9:57 PM
We found that people over-update on research findings with large confidence intervals and under-update on research findings with small confidence intervals. 2/
If anything, there may be a bit of churn in relationships with people outside the household, but this is not significant after accounting for multiple hypothesis testing. 44/

January 21, 2025 at 9:44 PM
If anything, there may be a bit of churn in relationships with people outside the household, but this is not significant after accounting for multiple hypothesis testing. 44/
Well, we were heartened to find the admin data largely support the survey results:
1. We see a similar time trend in both admin and survey data (effects growing over time). 34/
1. We see a similar time trend in both admin and survey data (effects growing over time). 34/


January 21, 2025 at 9:44 PM
Well, we were heartened to find the admin data largely support the survey results:
1. We see a similar time trend in both admin and survey data (effects growing over time). 34/
1. We see a similar time trend in both admin and survey data (effects growing over time). 34/
We did see significant increases in “precursors” to entrepreneurial activity: entrepreneurial orientation and intention. 27/

January 21, 2025 at 9:43 PM
We did see significant increases in “precursors” to entrepreneurial activity: entrepreneurial orientation and intention. 27/
Both measurements find a decrease in work hours.
In the mobile app, if you add up “market work” and “other income generating activities”, you get a noisily-estimated point estimate of -1.4 hours/week. The ATUS-style surveys show the same thing, more precisely estimated. 17/
In the mobile app, if you add up “market work” and “other income generating activities”, you get a noisily-estimated point estimate of -1.4 hours/week. The ATUS-style surveys show the same thing, more precisely estimated. 17/


January 21, 2025 at 9:43 PM
Both measurements find a decrease in work hours.
In the mobile app, if you add up “market work” and “other income generating activities”, you get a noisily-estimated point estimate of -1.4 hours/week. The ATUS-style surveys show the same thing, more precisely estimated. 17/
In the mobile app, if you add up “market work” and “other income generating activities”, you get a noisily-estimated point estimate of -1.4 hours/week. The ATUS-style surveys show the same thing, more precisely estimated. 17/