


Esteban Ortiz-Ospina
@eortizospina.bsky.social
Executive co-director @ourworldindata.org
Duolingo came out fully embracing AI in April, and it’s hard not to read their latest revenue growth numbers alongside this new report on the state of formal language learning in the UK


August 13, 2025 at 12:50 PM
Duolingo came out fully embracing AI in April, and it’s hard not to read their latest revenue growth numbers alongside this new report on the state of formal language learning in the UK
If you struggle to understand why/how people chat to ChatGPT for hours without any goal, just for fun, have a look at this conversation that someone posted on Reddit: www.reddit.com/r/ChatGPT/s/...
I’ll share the first couple of screenshots but click and read the whole thing, including comments.
I’ll share the first couple of screenshots but click and read the whole thing, including comments.


July 21, 2025 at 8:42 AM
If you struggle to understand why/how people chat to ChatGPT for hours without any goal, just for fun, have a look at this conversation that someone posted on Reddit: www.reddit.com/r/ChatGPT/s/...
I’ll share the first couple of screenshots but click and read the whole thing, including comments.
I’ll share the first couple of screenshots but click and read the whole thing, including comments.
OWID maps recently got a revamp. A key improvement: it’s now much easier to zoom and explore on mobile. Select a country or region, then pinch and pan to dive in 🪄
Fantastic work by @sophiamersmann.bsky.social and the team!
In this video @parriagadap.bsky.social gives a quick demo
Fantastic work by @sophiamersmann.bsky.social and the team!
In this video @parriagadap.bsky.social gives a quick demo
July 4, 2025 at 8:34 PM
OWID maps recently got a revamp. A key improvement: it’s now much easier to zoom and explore on mobile. Select a country or region, then pinch and pan to dive in 🪄
Fantastic work by @sophiamersmann.bsky.social and the team!
In this video @parriagadap.bsky.social gives a quick demo
Fantastic work by @sophiamersmann.bsky.social and the team!
In this video @parriagadap.bsky.social gives a quick demo
This is a key chart: how levels of drinking water services are defined and how many people fall on each “rung” of the ladder

July 4, 2025 at 8:07 PM
This is a key chart: how levels of drinking water services are defined and how many people fall on each “rung” of the ladder
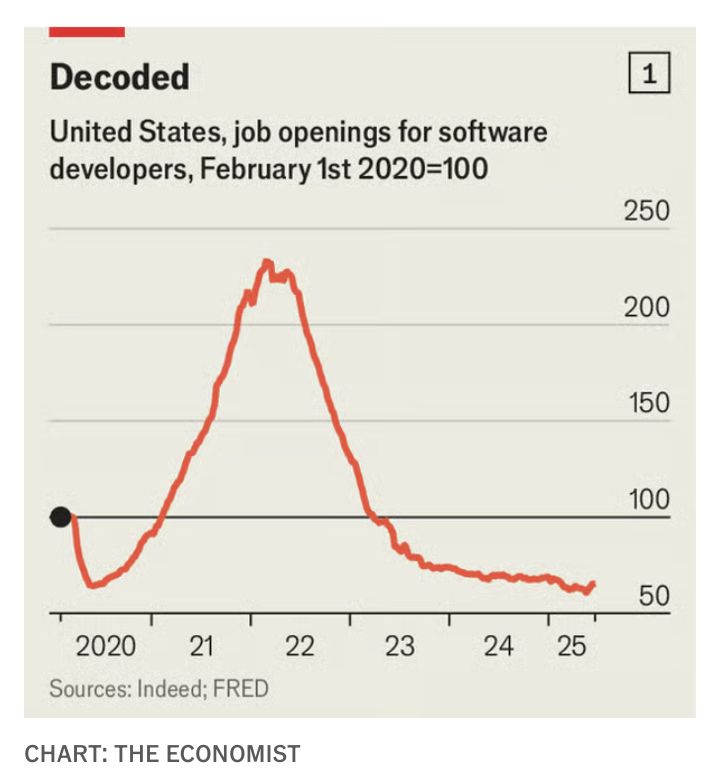
“In America job postings for software developers have dropped by more than two-thirds since the beginning of 2022, according to data from Indeed, a recruitment site.” From www.economist.com/business/202...
July 4, 2025 at 8:06 PM
“In America job postings for software developers have dropped by more than two-thirds since the beginning of 2022, according to data from Indeed, a recruitment site.” From www.economist.com/business/202...

May 16, 2025 at 11:44 PM
Colombia’s fertility rate was 1.6 births per woman in 2023 – the same as the UK or France.
In 1950 it was 6.4. That’s a 75% reduction. Comparable to China’s drop, which included the one-child policy.
It's a huge demographic change and I'm not sure we’ve fully grasped what it means for the country
In 1950 it was 6.4. That’s a 75% reduction. Comparable to China’s drop, which included the one-child policy.
It's a huge demographic change and I'm not sure we’ve fully grasped what it means for the country

May 13, 2025 at 1:00 AM
Colombia’s fertility rate was 1.6 births per woman in 2023 – the same as the UK or France.
In 1950 it was 6.4. That’s a 75% reduction. Comparable to China’s drop, which included the one-child policy.
It's a huge demographic change and I'm not sure we’ve fully grasped what it means for the country
In 1950 it was 6.4. That’s a 75% reduction. Comparable to China’s drop, which included the one-child policy.
It's a huge demographic change and I'm not sure we’ve fully grasped what it means for the country
This seems to be official data from The Port of Los Angeles (volumes.portoptimizer.com). For the week of May 4-10 it says -31% change from previous year

April 26, 2025 at 2:03 PM
This seems to be official data from The Port of Los Angeles (volumes.portoptimizer.com). For the week of May 4-10 it says -31% change from previous year
It takes 15–20 days to ship a container from China to LA. So ~30 days to Chicago. That means April tariffs start showing up in May.
Confusion, price hikes, demand shock, layoffs hit shipping and logistics... Even if tariffs are reversed, restarting supply chains will be slow and messy
Confusion, price hikes, demand shock, layoffs hit shipping and logistics... Even if tariffs are reversed, restarting supply chains will be slow and messy

April 25, 2025 at 4:57 PM
It takes 15–20 days to ship a container from China to LA. So ~30 days to Chicago. That means April tariffs start showing up in May.
Confusion, price hikes, demand shock, layoffs hit shipping and logistics... Even if tariffs are reversed, restarting supply chains will be slow and messy
Confusion, price hikes, demand shock, layoffs hit shipping and logistics... Even if tariffs are reversed, restarting supply chains will be slow and messy
Until seeing this chart I hadn't realised the post-WWII baby boom was actually part of a longer trend that had started before the end of the war. In the US and other countries birth rates started rising even in the late 1930s

March 27, 2025 at 9:02 AM
Until seeing this chart I hadn't realised the post-WWII baby boom was actually part of a longer trend that had started before the end of the war. In the US and other countries birth rates started rising even in the late 1930s
They can also try to figure what on earth is going on with left-handedness. There’s gotta be something out there

March 26, 2025 at 11:15 PM
They can also try to figure what on earth is going on with left-handedness. There’s gotta be something out there
Ever start taking a screenshot on Mac (Cmd-Shift-4), then panic because you anchored in the wrong place? Hit Spacebar—you can reposition the selection anywhere.
I repost this every now and then to pay it forward. Changed my life when I found out 😄
I repost this every now and then to pay it forward. Changed my life when I found out 😄
March 18, 2025 at 5:31 PM
Ever start taking a screenshot on Mac (Cmd-Shift-4), then panic because you anchored in the wrong place? Hit Spacebar—you can reposition the selection anywhere.
I repost this every now and then to pay it forward. Changed my life when I found out 😄
I repost this every now and then to pay it forward. Changed my life when I found out 😄
In 2000, Sierra Leone had the highest rate of maternal mortality in the world; but in two decades they've managed to lower these rates by 74%!
This is a huge achievement, though rates remain extremely high — rates in the safest countries are ~100x lower
From: ourworldindata.org/data-insight...
This is a huge achievement, though rates remain extremely high — rates in the safest countries are ~100x lower
From: ourworldindata.org/data-insight...

March 12, 2025 at 4:10 PM
In 2000, Sierra Leone had the highest rate of maternal mortality in the world; but in two decades they've managed to lower these rates by 74%!
This is a huge achievement, though rates remain extremely high — rates in the safest countries are ~100x lower
From: ourworldindata.org/data-insight...
This is a huge achievement, though rates remain extremely high — rates in the safest countries are ~100x lower
From: ourworldindata.org/data-insight...
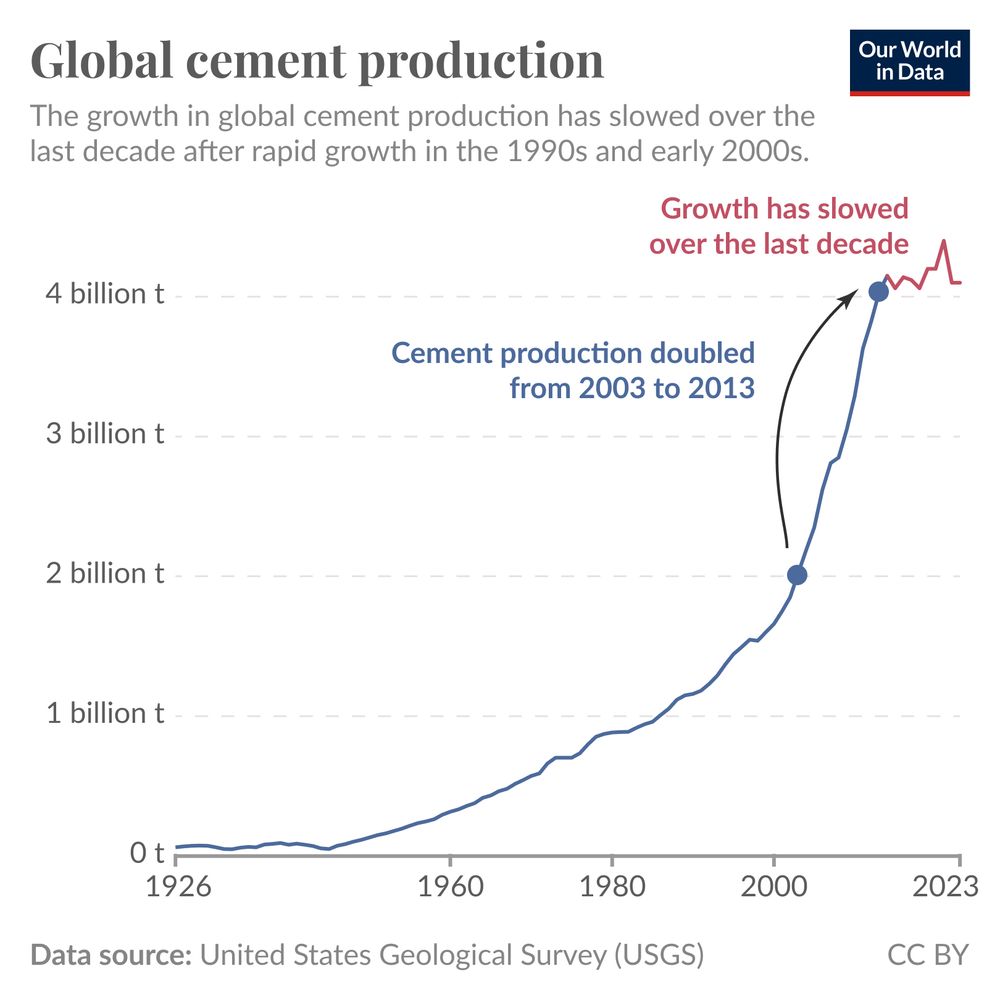
Global cement production grew rapidly for decades, but this growth has stalled.
China has been a key driver of this trend. They produce more than half of the world’s cement.
This matters. Cement production makes up around 7% of global CO2 emissions!
China has been a key driver of this trend. They produce more than half of the world’s cement.
This matters. Cement production makes up around 7% of global CO2 emissions!
January 16, 2025 at 11:42 PM
Global cement production grew rapidly for decades, but this growth has stalled.
China has been a key driver of this trend. They produce more than half of the world’s cement.
This matters. Cement production makes up around 7% of global CO2 emissions!
China has been a key driver of this trend. They produce more than half of the world’s cement.
This matters. Cement production makes up around 7% of global CO2 emissions!
Most int migrants move to a neighbouring country (e.g. Venezuelans to Colombia, Syrians to Turkey).
The chart shows this: It measures the shortest possible distance between borders of origin and destination. Zero distance (i.e. crossing neighbouring borders) is the most common.
The chart shows this: It measures the shortest possible distance between borders of origin and destination. Zero distance (i.e. crossing neighbouring borders) is the most common.

December 20, 2024 at 2:49 PM
Most int migrants move to a neighbouring country (e.g. Venezuelans to Colombia, Syrians to Turkey).
The chart shows this: It measures the shortest possible distance between borders of origin and destination. Zero distance (i.e. crossing neighbouring borders) is the most common.
The chart shows this: It measures the shortest possible distance between borders of origin and destination. Zero distance (i.e. crossing neighbouring borders) is the most common.
If you divide the national population by age into 10-year brackets, what's the most common group in each country?
In the UK, the largest group corresponds to people in their 50s.
From: ourworldindata.org/data-insight...
In the UK, the largest group corresponds to people in their 50s.
From: ourworldindata.org/data-insight...

December 13, 2024 at 6:47 PM
If you divide the national population by age into 10-year brackets, what's the most common group in each country?
In the UK, the largest group corresponds to people in their 50s.
From: ourworldindata.org/data-insight...
In the UK, the largest group corresponds to people in their 50s.
From: ourworldindata.org/data-insight...
In Japan the belief was that Children born in 1966 had the “fire horse” as their birth sign. “According to astrological predictions, women born that year would grow up to have a particularly difficult and possibly violent character.”
Next year of the fire horse is 2026!
Next year of the fire horse is 2026!

December 13, 2024 at 10:37 AM
In Japan the belief was that Children born in 1966 had the “fire horse” as their birth sign. “According to astrological predictions, women born that year would grow up to have a particularly difficult and possibly violent character.”
Next year of the fire horse is 2026!
Next year of the fire horse is 2026!
The whole list is fun. Here's the top 5

December 6, 2024 at 11:41 PM
The whole list is fun. Here's the top 5
According to UNESCO data nearly half of teenagers globally cannot read with comprehension
Chart source: ourworldindata.org/data-insight...
Chart source: ourworldindata.org/data-insight...

December 6, 2024 at 7:19 PM
According to UNESCO data nearly half of teenagers globally cannot read with comprehension
Chart source: ourworldindata.org/data-insight...
Chart source: ourworldindata.org/data-insight...
TIL - according to US Census Bureau the number of centenarians in the US is projected to rise to almost half a million in the next 30yrs
Source: www.pewresearch.org/short-reads/...
Source: www.pewresearch.org/short-reads/...

December 6, 2024 at 6:05 PM
TIL - according to US Census Bureau the number of centenarians in the US is projected to rise to almost half a million in the next 30yrs
Source: www.pewresearch.org/short-reads/...
Source: www.pewresearch.org/short-reads/...
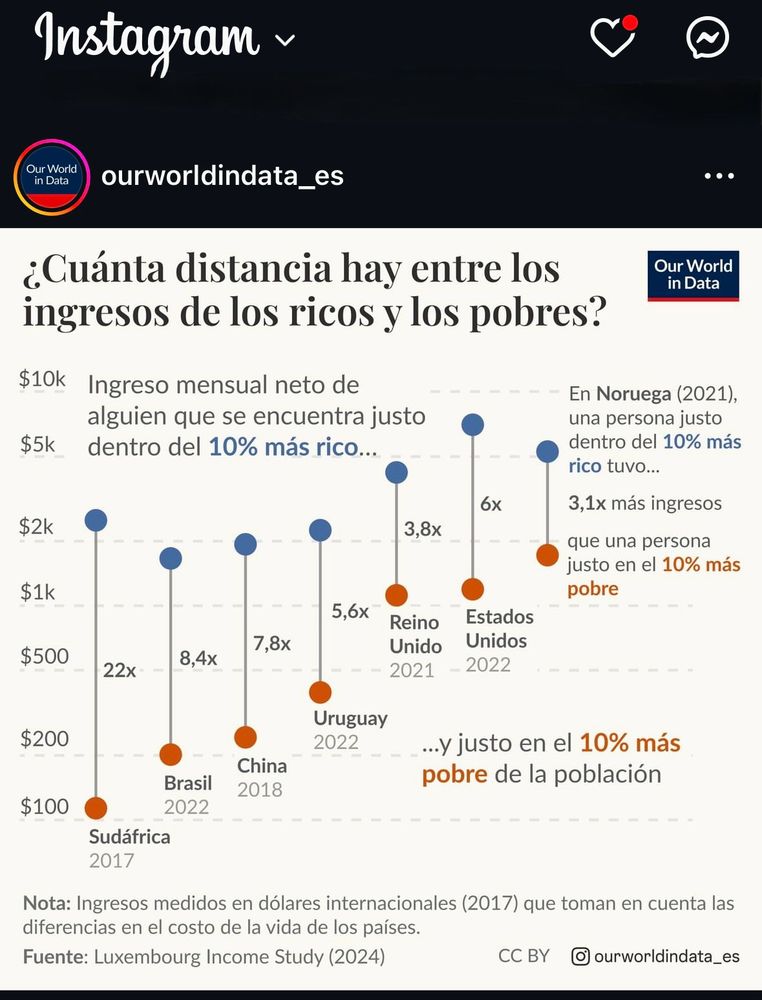
Estamos experimentando con publicar algunas gráficas de OWID en español.
Por ahora iniciamos con esta cuenta de instagram: www.instagram.com/ourworldinda...
La gráfica de hoy: distancia de ingresos entre el 10% más rico y el 10% más pobre (después de impuestos)
Por ahora iniciamos con esta cuenta de instagram: www.instagram.com/ourworldinda...
La gráfica de hoy: distancia de ingresos entre el 10% más rico y el 10% más pobre (después de impuestos)
November 29, 2024 at 11:38 PM
Estamos experimentando con publicar algunas gráficas de OWID en español.
Por ahora iniciamos con esta cuenta de instagram: www.instagram.com/ourworldinda...
La gráfica de hoy: distancia de ingresos entre el 10% más rico y el 10% más pobre (después de impuestos)
Por ahora iniciamos con esta cuenta de instagram: www.instagram.com/ourworldinda...
La gráfica de hoy: distancia de ingresos entre el 10% más rico y el 10% más pobre (después de impuestos)
Between 2001-2021, the Veteran Affairs Disability Compensation payments in the US *quadrupled*
Based on quasi-random assignment of recruits to units this paper finds deployment can't explain the rise in disability
payments, which is more likely driven by policy changes
www.nber.org/system/files...
Based on quasi-random assignment of recruits to units this paper finds deployment can't explain the rise in disability
payments, which is more likely driven by policy changes
www.nber.org/system/files...

November 28, 2024 at 7:36 PM
Between 2001-2021, the Veteran Affairs Disability Compensation payments in the US *quadrupled*
Based on quasi-random assignment of recruits to units this paper finds deployment can't explain the rise in disability
payments, which is more likely driven by policy changes
www.nber.org/system/files...
Based on quasi-random assignment of recruits to units this paper finds deployment can't explain the rise in disability
payments, which is more likely driven by policy changes
www.nber.org/system/files...
The global per capita food production of 49 different fruits, vegetables, and nuts from 1961 to 2022
A very pretty and interesting chart by @maxroser.bsky.social
A very pretty and interesting chart by @maxroser.bsky.social

November 27, 2024 at 2:14 AM
The global per capita food production of 49 different fruits, vegetables, and nuts from 1961 to 2022
A very pretty and interesting chart by @maxroser.bsky.social
A very pretty and interesting chart by @maxroser.bsky.social
A diferencia de otras regiones, en Brazil y otros países de Latam la deforestación y el cambio de uso de la tierra dominan el aumento de emisiones. Más que combustibles fósiles. Por dos razones: altas tasas de deforestación + red eléctrica relativamente limpia, dominada por energía hidroeléctrica

November 23, 2024 at 1:34 AM
A diferencia de otras regiones, en Brazil y otros países de Latam la deforestación y el cambio de uso de la tierra dominan el aumento de emisiones. Más que combustibles fósiles. Por dos razones: altas tasas de deforestación + red eléctrica relativamente limpia, dominada por energía hidroeléctrica
Today’s chart: Which countries have fertility rates above or below the “replacement level”?

November 21, 2024 at 9:08 PM
Today’s chart: Which countries have fertility rates above or below the “replacement level”?