


Ian Johnson 🔬🤖
@enjalot.bsky.social
Data Visualization and Machine Learning
Building Latent Scope to visualize unstructured data through the lens of ML
github.com/enjalot/latent-scope
Building Latent Scope to visualize unstructured data through the lens of ML
github.com/enjalot/latent-scope
implemented a new rendering component for latent scope's scatter plot. had to replace regl-scatterplot with d3-zoom + regl shaders so we could support mobile

January 23, 2025 at 12:37 AM
implemented a new rendering component for latent scope's scatter plot. had to replace regl-scatterplot with d3-zoom + regl shaders so we could support mobile
am i missing something for handling image data in parquet files?
I can load a dataset from HF like:
dataset = load_dataset("Marqo/marqo-ge-sample", split='google_shopping')
df = pd.DataFrame(dataset)
but i need to convert the images to bytes if I want to do:
df.to_parquet("sample.parquet")
I can load a dataset from HF like:
dataset = load_dataset("Marqo/marqo-ge-sample", split='google_shopping')
df = pd.DataFrame(dataset)
but i need to convert the images to bytes if I want to do:
df.to_parquet("sample.parquet")

December 10, 2024 at 7:51 PM
am i missing something for handling image data in parquet files?
I can load a dataset from HF like:
dataset = load_dataset("Marqo/marqo-ge-sample", split='google_shopping')
df = pd.DataFrame(dataset)
but i need to convert the images to bytes if I want to do:
df.to_parquet("sample.parquet")
I can load a dataset from HF like:
dataset = load_dataset("Marqo/marqo-ge-sample", split='google_shopping')
df = pd.DataFrame(dataset)
but i need to convert the images to bytes if I want to do:
df.to_parquet("sample.parquet")
the algorithm is not some deity but a landscape, the feed is an uber ride across the manifold, only the windows are blacked out. what if you had a map of the algorithm? what if the UX of the feed let you look out of the window?
musing with @infowetrust.com
image from distill.pub/2017/aia/
musing with @infowetrust.com
image from distill.pub/2017/aia/

December 5, 2024 at 1:33 AM
the algorithm is not some deity but a landscape, the feed is an uber ride across the manifold, only the windows are blacked out. what if you had a map of the algorithm? what if the UX of the feed let you look out of the window?
musing with @infowetrust.com
image from distill.pub/2017/aia/
musing with @infowetrust.com
image from distill.pub/2017/aia/
I've organized and participated in many unconferences in the past, and they are always the most intense exchange of ideas and information that I've experienced. Given the energy we're seeing in the registration this one is poised to be no different!
register today!
hiddenstates.org
register today!
hiddenstates.org

November 26, 2024 at 6:23 PM
I've organized and participated in many unconferences in the past, and they are always the most intense exchange of ideas and information that I've experienced. Given the energy we're seeing in the registration this one is poised to be no different!
register today!
hiddenstates.org
register today!
hiddenstates.org
Hidden States is happening next week in SF!
It's a one-day unconference gathering researchers, designers, prototypers and engineers interested in pushing the boundaries of AI interfaces, going below the API and working with the hidden states.
hiddenstates.org
It's a one-day unconference gathering researchers, designers, prototypers and engineers interested in pushing the boundaries of AI interfaces, going below the API and working with the hidden states.
hiddenstates.org

November 26, 2024 at 6:23 PM
Hidden States is happening next week in SF!
It's a one-day unconference gathering researchers, designers, prototypers and engineers interested in pushing the boundaries of AI interfaces, going below the API and working with the hidden states.
hiddenstates.org
It's a one-day unconference gathering researchers, designers, prototypers and engineers interested in pushing the boundaries of AI interfaces, going below the API and working with the hidden states.
hiddenstates.org
If you do this with enough data you start to get a map of the patterns found in your dataset.
When you embed new data, like the question for a RAG query, you can see where on the map it lands.
When you embed new data, like the question for a RAG query, you can see where on the map it lands.


November 21, 2024 at 7:29 PM
If you do this with enough data you start to get a map of the patterns found in your dataset.
When you embed new data, like the question for a RAG query, you can see where on the map it lands.
When you embed new data, like the question for a RAG query, you can see where on the map it lands.
You can map more and more points, a less similar point will show up a little further away.
As you add more points a map starts to form, with clusters of similar data spread out before you
As you add more points a map starts to form, with clusters of similar data spread out before you


November 21, 2024 at 7:29 PM
You can map more and more points, a less similar point will show up a little further away.
As you add more points a map starts to form, with clusters of similar data spread out before you
As you add more points a map starts to form, with clusters of similar data spread out before you
We have another tool we can use to make sense of the patterns found in our embeddings.
We can use UMAP to place similar embeddings close together in 2D space. So two passages that have similar high-dimensional representations will show up close together in 2D
We can use UMAP to place similar embeddings close together in 2D space. So two passages that have similar high-dimensional representations will show up close together in 2D

November 21, 2024 at 7:29 PM
We have another tool we can use to make sense of the patterns found in our embeddings.
We can use UMAP to place similar embeddings close together in 2D space. So two passages that have similar high-dimensional representations will show up close together in 2D
We can use UMAP to place similar embeddings close together in 2D space. So two passages that have similar high-dimensional representations will show up close together in 2D
This is the basis of the retrieval in RAG. We embed a question or prompt, and we find the dataset representations that are most similar to the question.

November 21, 2024 at 7:23 PM
This is the basis of the retrieval in RAG. We embed a question or prompt, and we find the dataset representations that are most similar to the question.
We may not be able to make sense of those patterns directly by looking at the representations, but we do have some tools to help us
The first tool that is most familiar is cosine similarity. It allows us to see how similar two high-dimensional vectors are.
The first tool that is most familiar is cosine similarity. It allows us to see how similar two high-dimensional vectors are.

November 21, 2024 at 7:23 PM
We may not be able to make sense of those patterns directly by looking at the representations, but we do have some tools to help us
The first tool that is most familiar is cosine similarity. It allows us to see how similar two high-dimensional vectors are.
The first tool that is most familiar is cosine similarity. It allows us to see how similar two high-dimensional vectors are.
So now we can shine a piece of data through the lens and get back a representation (embedding)
This representation has some special properties, namely that it "represents" the patterns the model has found in the data.
We can get a representation for any data (that our model can handle)
This representation has some special properties, namely that it "represents" the patterns the model has found in the data.
We can get a representation for any data (that our model can handle)


November 21, 2024 at 7:23 PM
So now we can shine a piece of data through the lens and get back a representation (embedding)
This representation has some special properties, namely that it "represents" the patterns the model has found in the data.
We can get a representation for any data (that our model can handle)
This representation has some special properties, namely that it "represents" the patterns the model has found in the data.
We can get a representation for any data (that our model can handle)
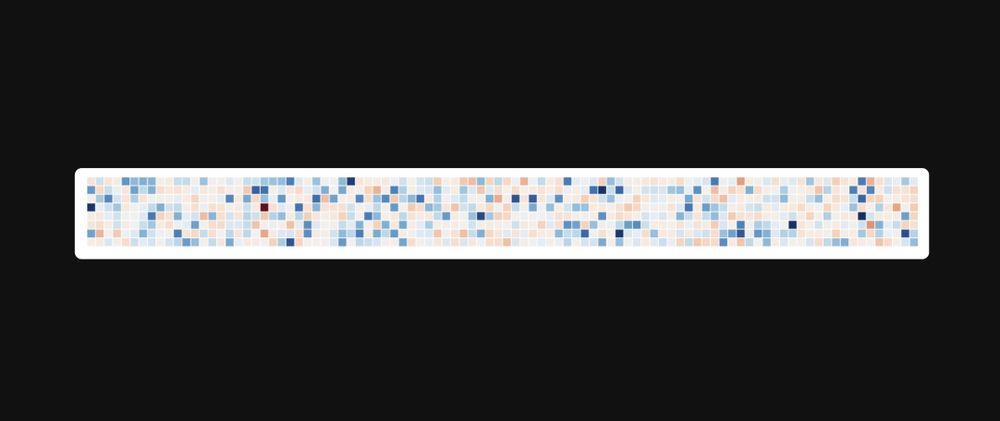
I like to represent those vectors as these little grids. Since as humans we can't make much sense of what the numbers mean in this form we might as well make them a little easier to look at.
November 21, 2024 at 7:23 PM
I like to represent those vectors as these little grids. Since as humans we can't make much sense of what the numbers mean in this form we might as well make them a little easier to look at.
If we think of the model as a lens, you shine your chunk through and get a representation (a long list of numbers).
That list of numbers is an embedding AKA latent vector. For a given model its always the same length (dimensionality)
That list of numbers is an embedding AKA latent vector. For a given model its always the same length (dimensionality)

November 21, 2024 at 7:23 PM
If we think of the model as a lens, you shine your chunk through and get a representation (a long list of numbers).
That list of numbers is an embedding AKA latent vector. For a given model its always the same length (dimensionality)
That list of numbers is an embedding AKA latent vector. For a given model its always the same length (dimensionality)
then you take your model and encode each chunk

November 21, 2024 at 7:23 PM
then you take your model and encode each chunk
The hidden states are often known as embeddings, they are the main output you get from BERT models and Sentence Transformers. They are what powers the "R" in RAG
The basic idea is you take your text and chunk it into pieces
The basic idea is you take your text and chunk it into pieces

November 21, 2024 at 7:23 PM
The hidden states are often known as embeddings, they are the main output you get from BERT models and Sentence Transformers. They are what powers the "R" in RAG
The basic idea is you take your text and chunk it into pieces
The basic idea is you take your text and chunk it into pieces
One way I've been thinking about ML models for some time is as a lens.
The weights are crystalized patterns whose structure emerges from the crushing pressures of backpropagation.
By shining a piece of data through this lens you see the patterns diffracted in the hidden states.
The weights are crystalized patterns whose structure emerges from the crushing pressures of backpropagation.
By shining a piece of data through this lens you see the patterns diffracted in the hidden states.
November 21, 2024 at 7:23 PM
One way I've been thinking about ML models for some time is as a lens.
The weights are crystalized patterns whose structure emerges from the crushing pressures of backpropagation.
By shining a piece of data through this lens you see the patterns diffracted in the hidden states.
The weights are crystalized patterns whose structure emerges from the crushing pressures of backpropagation.
By shining a piece of data through this lens you see the patterns diffracted in the hidden states.
UMAP of the counties of course 😁
pretty geographically correlated (counties from the same state end up in similar clusters, or share clusters with nearby states)
pretty geographically correlated (counties from the same state end up in similar clusters, or share clusters with nearby states)

November 19, 2024 at 9:13 PM
UMAP of the counties of course 😁
pretty geographically correlated (counties from the same state end up in similar clusters, or share clusters with nearby states)
pretty geographically correlated (counties from the same state end up in similar clusters, or share clusters with nearby states)
oops, transparent PNG doesn't work well on here eh?

November 15, 2024 at 5:01 PM
oops, transparent PNG doesn't work well on here eh?
Now I'm building Latent Interfaces, an applied research lab for advanced data visualization. It pulls together all of my past interests and skills, from microscopes to making maps, exploiting linear algebra to making data understandable.
read more details here: enjalot.substack.com
read more details here: enjalot.substack.com

November 15, 2024 at 4:56 PM
Now I'm building Latent Interfaces, an applied research lab for advanced data visualization. It pulls together all of my past interests and skills, from microscopes to making maps, exploiting linear algebra to making data understandable.
read more details here: enjalot.substack.com
read more details here: enjalot.substack.com
Way back in 2003 I was making java applets like:
micro.magnet.fsu.edu/primer/java/...
Even before that I was behind the microscope after school getting paid in computer parts for taking pictures of pond life (my first NVIDIA GPU in 2001!)
micro.magnet.fsu.edu/primer/java/...
Even before that I was behind the microscope after school getting paid in computer parts for taking pictures of pond life (my first NVIDIA GPU in 2001!)

November 15, 2024 at 4:56 PM
Way back in 2003 I was making java applets like:
micro.magnet.fsu.edu/primer/java/...
Even before that I was behind the microscope after school getting paid in computer parts for taking pictures of pond life (my first NVIDIA GPU in 2001!)
micro.magnet.fsu.edu/primer/java/...
Even before that I was behind the microscope after school getting paid in computer parts for taking pictures of pond life (my first NVIDIA GPU in 2001!)
I went to undergrad for Applied Math (and Mandarin Chinese) then got a Master's in Scientific Computing (basically linear algebra + distributed/parallel computing) graduating in 2011 right before the latest deep learning explosion.
Throughout school I worked part-time making GIS web maps.
Throughout school I worked part-time making GIS web maps.


November 15, 2024 at 4:56 PM
I went to undergrad for Applied Math (and Mandarin Chinese) then got a Master's in Scientific Computing (basically linear algebra + distributed/parallel computing) graduating in 2011 right before the latest deep learning explosion.
Throughout school I worked part-time making GIS web maps.
Throughout school I worked part-time making GIS web maps.
from 2012-2022 I co-organized the d3.js meetup in the SF Bay Area, working at various startups until joining Google from 2016-2020 and Observable from 2020 -2022
I've written a good bit about data visualization with d3.js and building community here:
medium.com/@enjalot
I've written a good bit about data visualization with d3.js and building community here:
medium.com/@enjalot

November 15, 2024 at 4:56 PM
from 2012-2022 I co-organized the d3.js meetup in the SF Bay Area, working at various startups until joining Google from 2016-2020 and Observable from 2020 -2022
I've written a good bit about data visualization with d3.js and building community here:
medium.com/@enjalot
I've written a good bit about data visualization with d3.js and building community here:
medium.com/@enjalot
allow me to reintroduce myself!
I'm a prototyper and Data Alchemist interested in using machine learning for data visualization.
I'm building github.com/enjalot/late... using the lessons learned from co-authoring these 4 distill.pub papers
I'm a prototyper and Data Alchemist interested in using machine learning for data visualization.
I'm building github.com/enjalot/late... using the lessons learned from co-authoring these 4 distill.pub papers


November 15, 2024 at 4:56 PM
allow me to reintroduce myself!
I'm a prototyper and Data Alchemist interested in using machine learning for data visualization.
I'm building github.com/enjalot/late... using the lessons learned from co-authoring these 4 distill.pub papers
I'm a prototyper and Data Alchemist interested in using machine learning for data visualization.
I'm building github.com/enjalot/late... using the lessons learned from co-authoring these 4 distill.pub papers