https://sites.google.com/site/edugca/
It has just been published in the BIS Working Paper series.
Read it here: bis.org/publ/work1288.…
It has just been published in the BIS Working Paper series.
Read it here: bis.org/publ/work1288.…
From 1965 to 2023, this new measure also enhanced inflation forecasting in the United States. 📈 (8/10)
From 1965 to 2023, this new measure also enhanced inflation forecasting in the United States. 📈 (8/10)
If r falls after a hike, the gap suggests policy is easing when the central bank is actually tightening! (5
7/10) #rStar
If r falls after a hike, the gap suggests policy is easing when the central bank is actually tightening! (5
7/10) #rStar
↑i ⇒ ↑r ⇒ ↓↓ Investment (if it is very sensitive) ⇒ ↓↓y ⇒ ↓↓π ⇒ ↓ i ⇒ ↓r
The initial hike is overwhelmed by the fall in π expectations, reversing interest rates. The real rate ends up lower, even as inflation falls! (4/10)
↑i ⇒ ↑r ⇒ ↓↓ Investment (if it is very sensitive) ⇒ ↓↓y ⇒ ↓↓π ⇒ ↓ i ⇒ ↓r
The initial hike is overwhelmed by the fall in π expectations, reversing interest rates. The real rate ends up lower, even as inflation falls! (4/10)
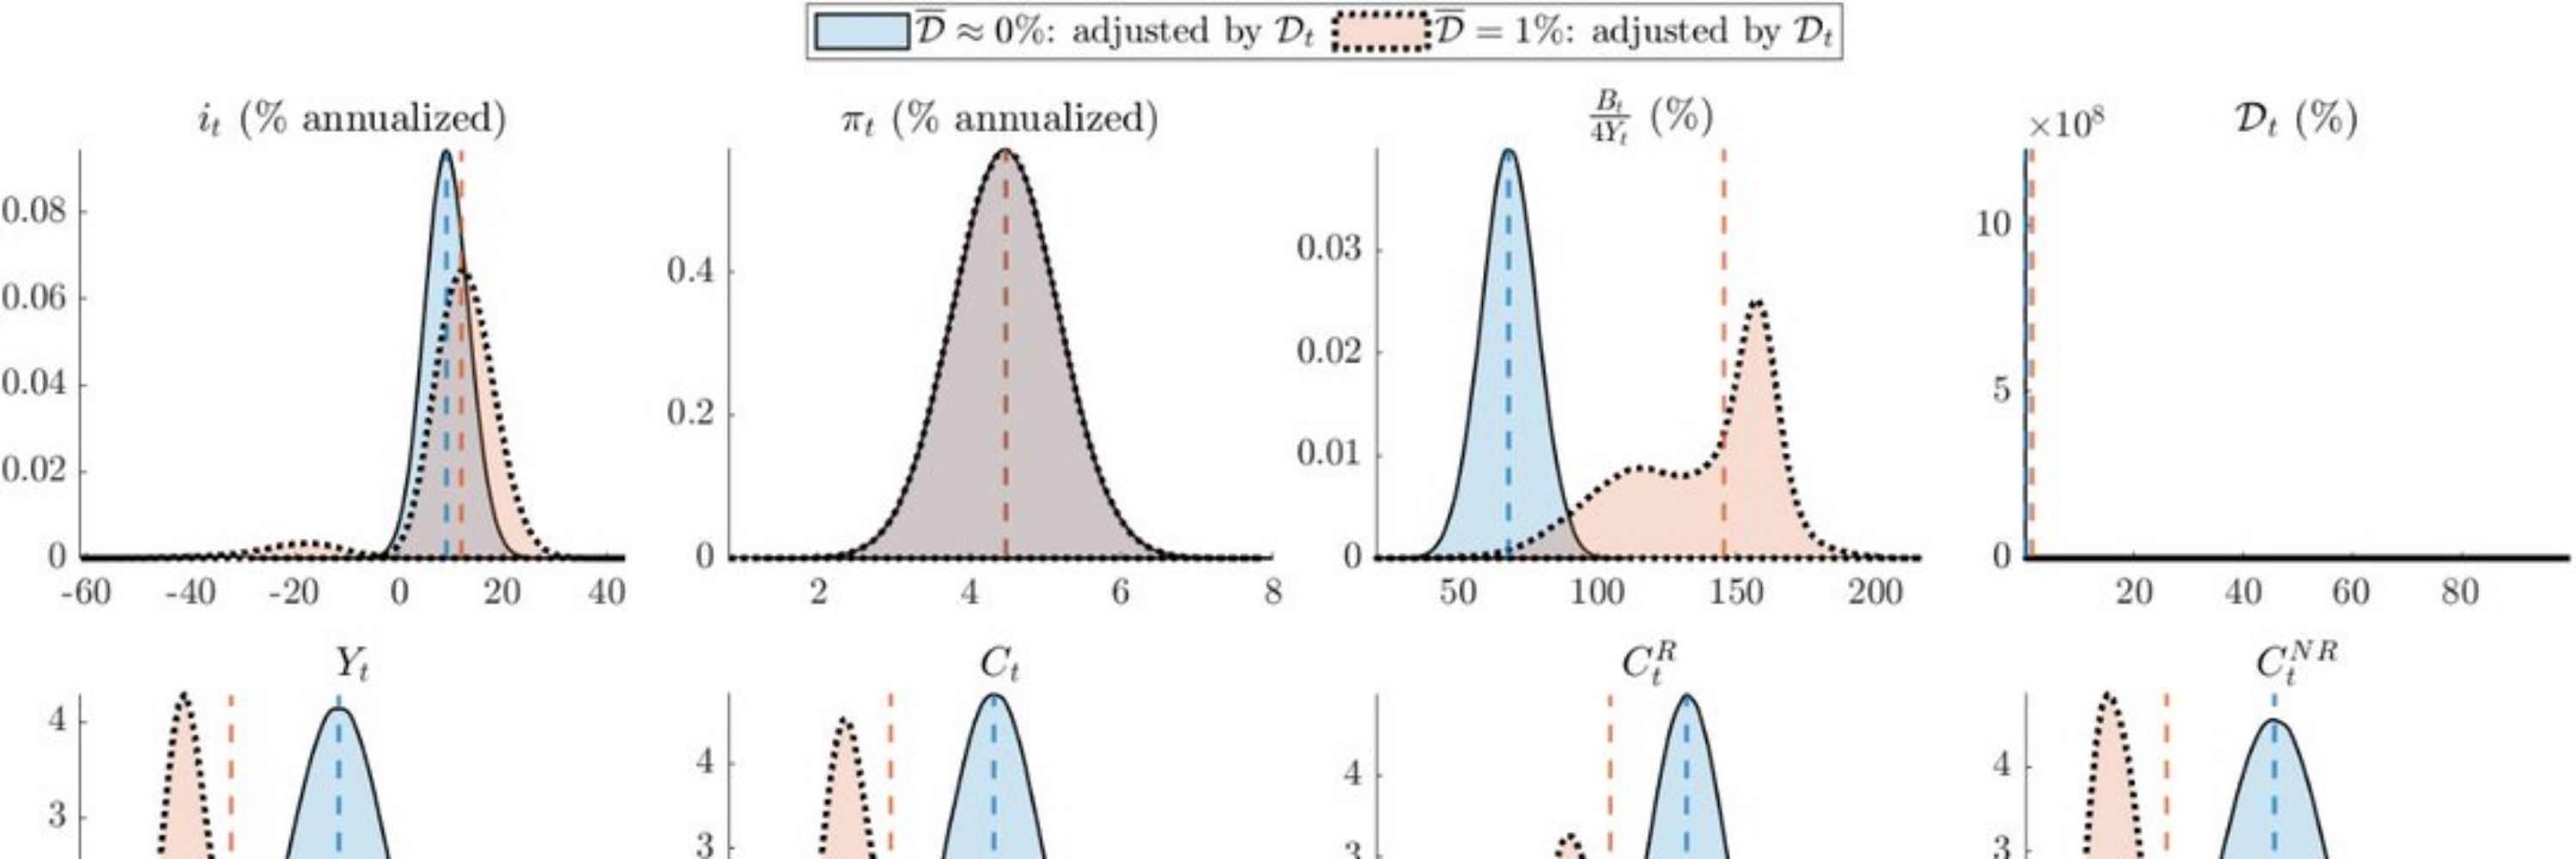
In extreme scenarios, a policy rate hike can cause such a sharp drop in demand & inflation expectations that interest rates collapse. (3/10)

In extreme scenarios, a policy rate hike can cause such a sharp drop in demand & inflation expectations that interest rates collapse. (3/10)
The Fed hikes rates (↑i) → real rates rise (↑r, if prices are sticky) → consumption falls (↓c) → output falls (↓y) → inflation falls (↓π).
It all works through higher real borrowing costs. (2/10)
The Fed hikes rates (↑i) → real rates rise (↑r, if prices are sticky) → consumption falls (↓c) → output falls (↓y) → inflation falls (↓π).
It all works through higher real borrowing costs. (2/10)

