


John Russell
@drjohnrussell.com
Senior Director, Data and Assessment at KIPP NYC, Adjunct at American Museum of Natural History. Passionate about STEM, data, education and students.
#TidyTuesday (2025 W40)
Just love an excuse to do an animation... this map shows the location of Eurobasketball teams, with a gif highlighting the country of the team that won.
#rstats
Code: github.com/drjohnrussel...
Just love an excuse to do an animation... this map shows the location of Eurobasketball teams, with a gif highlighting the country of the team that won.
#rstats
Code: github.com/drjohnrussel...
October 9, 2025 at 1:20 AM
#TidyTuesday (2025 W40)
Just love an excuse to do an animation... this map shows the location of Eurobasketball teams, with a gif highlighting the country of the team that won.
#rstats
Code: github.com/drjohnrussel...
Just love an excuse to do an animation... this map shows the location of Eurobasketball teams, with a gif highlighting the country of the team that won.
#rstats
Code: github.com/drjohnrussel...
#TidyTuesday (2025 W39)
Used the ggmap package to make an inset for the graph, and noticed that there seems to be two seasons of observations. Fun dataset, I'm curious whether the increase in cranes is an observer effect, or an actual increase!
#rstats
Code: github.com/drjohnrussel...
Used the ggmap package to make an inset for the graph, and noticed that there seems to be two seasons of observations. Fun dataset, I'm curious whether the increase in cranes is an observer effect, or an actual increase!
#rstats
Code: github.com/drjohnrussel...

October 4, 2025 at 6:30 PM
#TidyTuesday (2025 W39)
Used the ggmap package to make an inset for the graph, and noticed that there seems to be two seasons of observations. Fun dataset, I'm curious whether the increase in cranes is an observer effect, or an actual increase!
#rstats
Code: github.com/drjohnrussel...
Used the ggmap package to make an inset for the graph, and noticed that there seems to be two seasons of observations. Fun dataset, I'm curious whether the increase in cranes is an observer effect, or an actual increase!
#rstats
Code: github.com/drjohnrussel...
#TidyTuesday (2025 W38)
I had heard about the age effect in chess, and wanted to see it for myself - took the top 20 chess players at each age to show how chess, like other sports, very much peaks (also, there are some old chess players still around!)
#rstats
Code: github.com/drjohnrussel...
I had heard about the age effect in chess, and wanted to see it for myself - took the top 20 chess players at each age to show how chess, like other sports, very much peaks (also, there are some old chess players still around!)
#rstats
Code: github.com/drjohnrussel...

September 27, 2025 at 11:40 PM
#TidyTuesday (2025 W38)
I had heard about the age effect in chess, and wanted to see it for myself - took the top 20 chess players at each age to show how chess, like other sports, very much peaks (also, there are some old chess players still around!)
#rstats
Code: github.com/drjohnrussel...
I had heard about the age effect in chess, and wanted to see it for myself - took the top 20 chess players at each age to show how chess, like other sports, very much peaks (also, there are some old chess players still around!)
#rstats
Code: github.com/drjohnrussel...
#TidyTuesday (2025 W37)
Went into cleaning mode this week, filtering out common pantry ingredients and instructions to find the most common other calls for ingredients that are given.
#rstats
Code: github.com/drjohnrussel...
Went into cleaning mode this week, filtering out common pantry ingredients and instructions to find the most common other calls for ingredients that are given.
#rstats
Code: github.com/drjohnrussel...

September 20, 2025 at 12:00 PM
#TidyTuesday (2025 W37)
Went into cleaning mode this week, filtering out common pantry ingredients and instructions to find the most common other calls for ingredients that are given.
#rstats
Code: github.com/drjohnrussel...
Went into cleaning mode this week, filtering out common pantry ingredients and instructions to find the most common other calls for ingredients that are given.
#rstats
Code: github.com/drjohnrussel...
#TidyTuesday (2025 W36)
The Henley Passport index is interesting because it allows ties, which was a nice challenge for a ranking plot using the ggflags package to see which passports allow one to travel to the most countries.
#rstats
Code: github.com/drjohnrussel...
The Henley Passport index is interesting because it allows ties, which was a nice challenge for a ranking plot using the ggflags package to see which passports allow one to travel to the most countries.
#rstats
Code: github.com/drjohnrussel...

September 11, 2025 at 1:45 AM
#TidyTuesday (2025 W36)
The Henley Passport index is interesting because it allows ties, which was a nice challenge for a ranking plot using the ggflags package to see which passports allow one to travel to the most countries.
#rstats
Code: github.com/drjohnrussel...
The Henley Passport index is interesting because it allows ties, which was a nice challenge for a ranking plot using the ggflags package to see which passports allow one to travel to the most countries.
#rstats
Code: github.com/drjohnrussel...
#TidyTuesday (2025 W35)
We often think of distributions among categories, but spatial and temporal distributions are also important for exploration. It's also interesting to think, as a citizen science project, about issues of selection bias.
#rstats
Code: drjohnrussell.com/posts/2025-0...
We often think of distributions among categories, but spatial and temporal distributions are also important for exploration. It's also interesting to think, as a citizen science project, about issues of selection bias.
#rstats
Code: drjohnrussell.com/posts/2025-0...

September 1, 2025 at 11:00 PM
#TidyTuesday (2025 W35)
We often think of distributions among categories, but spatial and temporal distributions are also important for exploration. It's also interesting to think, as a citizen science project, about issues of selection bias.
#rstats
Code: drjohnrussell.com/posts/2025-0...
We often think of distributions among categories, but spatial and temporal distributions are also important for exploration. It's also interesting to think, as a citizen science project, about issues of selection bias.
#rstats
Code: drjohnrussell.com/posts/2025-0...
code is too short to make into a post, but can be found in this screenshot

August 30, 2025 at 4:14 PM
code is too short to make into a post, but can be found in this screenshot
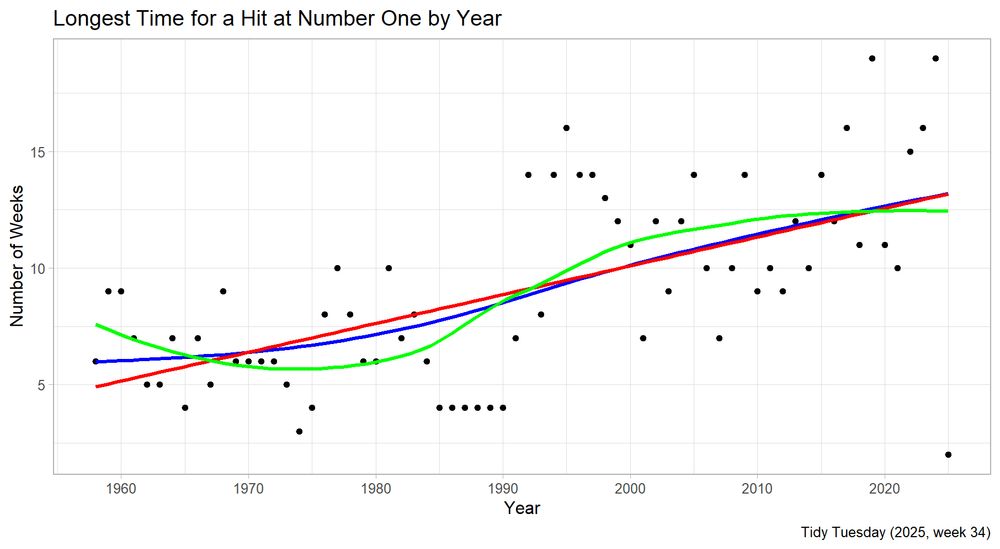
#TidyTuesday (2025 W34)
I wondered if the maximum time that a song spent as a Number One Hit had changed over time. What is interesting is that different models tell different stories, with the GAM (blue) and LM (red) mostly agreeing, but the loess (green) being pulled down in the middle.
#rstats
I wondered if the maximum time that a song spent as a Number One Hit had changed over time. What is interesting is that different models tell different stories, with the GAM (blue) and LM (red) mostly agreeing, but the loess (green) being pulled down in the middle.
#rstats
August 30, 2025 at 4:14 PM
#TidyTuesday (2025 W34)
I wondered if the maximum time that a song spent as a Number One Hit had changed over time. What is interesting is that different models tell different stories, with the GAM (blue) and LM (red) mostly agreeing, but the loess (green) being pulled down in the middle.
#rstats
I wondered if the maximum time that a song spent as a Number One Hit had changed over time. What is interesting is that different models tell different stories, with the GAM (blue) and LM (red) mostly agreeing, but the loess (green) being pulled down in the middle.
#rstats
#TidyTuesday (2025 W33)
I'm in Edinburgh for the fringe, so this was timely!
Many thanks to @nrennie.bsky.social for curating this dataset of Scottish Munros. Loch Ness & Loch Lochy serve as a dividing line because of the underlying fault system!
#rstats
Code: drjohnrussell.com/posts/2025-0...
I'm in Edinburgh for the fringe, so this was timely!
Many thanks to @nrennie.bsky.social for curating this dataset of Scottish Munros. Loch Ness & Loch Lochy serve as a dividing line because of the underlying fault system!
#rstats
Code: drjohnrussell.com/posts/2025-0...

August 21, 2025 at 8:19 AM
#TidyTuesday (2025 W33)
I'm in Edinburgh for the fringe, so this was timely!
Many thanks to @nrennie.bsky.social for curating this dataset of Scottish Munros. Loch Ness & Loch Lochy serve as a dividing line because of the underlying fault system!
#rstats
Code: drjohnrussell.com/posts/2025-0...
I'm in Edinburgh for the fringe, so this was timely!
Many thanks to @nrennie.bsky.social for curating this dataset of Scottish Munros. Loch Ness & Loch Lochy serve as a dividing line because of the underlying fault system!
#rstats
Code: drjohnrussell.com/posts/2025-0...
Day 30(!) of #30DayChartChallenge (national geographic)
Mapping our animal friends (and their repercussions) in NYC using NYCOpenData and the tigris and socrata #rstats packages. Interesting that it doesn't quite correlate.
github.com/drjohnrussel...
Mapping our animal friends (and their repercussions) in NYC using NYCOpenData and the tigris and socrata #rstats packages. Interesting that it doesn't quite correlate.
github.com/drjohnrussel...

April 30, 2025 at 1:14 AM
Day 30(!) of #30DayChartChallenge (national geographic)
Mapping our animal friends (and their repercussions) in NYC using NYCOpenData and the tigris and socrata #rstats packages. Interesting that it doesn't quite correlate.
github.com/drjohnrussel...
Mapping our animal friends (and their repercussions) in NYC using NYCOpenData and the tigris and socrata #rstats packages. Interesting that it doesn't quite correlate.
github.com/drjohnrussel...
Day 29 of #30DayChallenge (extraterrestrial)
Borrowing a dataset that my co-teacher uses, it is amazing to look at the ways in which exoplanets are discovered, and to understand that, within the astronomer's toolkit, different methods preference different exoplanets.
github.com/drjohnrussel...
Borrowing a dataset that my co-teacher uses, it is amazing to look at the ways in which exoplanets are discovered, and to understand that, within the astronomer's toolkit, different methods preference different exoplanets.
github.com/drjohnrussel...

April 29, 2025 at 7:23 PM
Day 29 of #30DayChallenge (extraterrestrial)
Borrowing a dataset that my co-teacher uses, it is amazing to look at the ways in which exoplanets are discovered, and to understand that, within the astronomer's toolkit, different methods preference different exoplanets.
github.com/drjohnrussel...
Borrowing a dataset that my co-teacher uses, it is amazing to look at the ways in which exoplanets are discovered, and to understand that, within the astronomer's toolkit, different methods preference different exoplanets.
github.com/drjohnrussel...
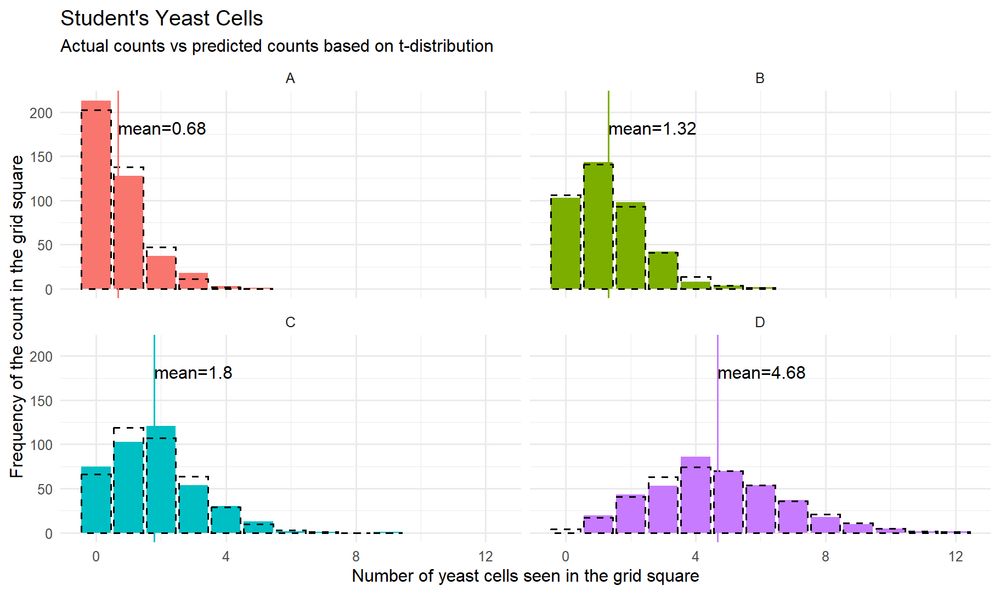
Day 28 of #30DayChartChallenge (inclusion)
W Gosset was only allowed to write if he did not include beer, Guinness, or their own surname - and as such, Student was born. In his first paper, he predicted the distribution of cells in 4 grids. Both graphed using #rstats
github.com/drjohnrussel...
W Gosset was only allowed to write if he did not include beer, Guinness, or their own surname - and as such, Student was born. In his first paper, he predicted the distribution of cells in 4 grids. Both graphed using #rstats
github.com/drjohnrussel...
April 28, 2025 at 2:42 AM
Day 28 of #30DayChartChallenge (inclusion)
W Gosset was only allowed to write if he did not include beer, Guinness, or their own surname - and as such, Student was born. In his first paper, he predicted the distribution of cells in 4 grids. Both graphed using #rstats
github.com/drjohnrussel...
W Gosset was only allowed to write if he did not include beer, Guinness, or their own surname - and as such, Student was born. In his first paper, he predicted the distribution of cells in 4 grids. Both graphed using #rstats
github.com/drjohnrussel...
Day 27 of #30DayChartChallenge (noise)
H. Waite's data (1915) on whorls and loops on the right hands of 2000 people became a case for Pearson's work on independence.
I love how the most common number of loops or whorls is different than the most common number of both.
github.com/drjohnrussel...
H. Waite's data (1915) on whorls and loops on the right hands of 2000 people became a case for Pearson's work on independence.
I love how the most common number of loops or whorls is different than the most common number of both.
github.com/drjohnrussel...

April 27, 2025 at 10:20 AM
Day 27 of #30DayChartChallenge (noise)
H. Waite's data (1915) on whorls and loops on the right hands of 2000 people became a case for Pearson's work on independence.
I love how the most common number of loops or whorls is different than the most common number of both.
github.com/drjohnrussel...
H. Waite's data (1915) on whorls and loops on the right hands of 2000 people became a case for Pearson's work on independence.
I love how the most common number of loops or whorls is different than the most common number of both.
github.com/drjohnrussel...
Day 26 of #30DayChartChallenge (monochrome)
In 1954 in 272 counties with the highest incidence of polio, the vaccine was tested, affecting ~1.6m elementary children.
There were two different designs, an RCT (using a placebo), and a matching study. Both succeeded.
Code: github.com/drjohnrussel...
In 1954 in 272 counties with the highest incidence of polio, the vaccine was tested, affecting ~1.6m elementary children.
There were two different designs, an RCT (using a placebo), and a matching study. Both succeeded.
Code: github.com/drjohnrussel...

April 26, 2025 at 10:53 AM
Day 26 of #30DayChartChallenge (monochrome)
In 1954 in 272 counties with the highest incidence of polio, the vaccine was tested, affecting ~1.6m elementary children.
There were two different designs, an RCT (using a placebo), and a matching study. Both succeeded.
Code: github.com/drjohnrussel...
In 1954 in 272 counties with the highest incidence of polio, the vaccine was tested, affecting ~1.6m elementary children.
There were two different designs, an RCT (using a placebo), and a matching study. Both succeeded.
Code: github.com/drjohnrussel...
Day 25 of #30DayChartChallenge, going back to @datavisfriendly.bsky.social's HistData package in #rstats
William Farr tested many theories around the Cholera epidemic of 1849, including a seasonal effect using a time series in conjunction with meteorological data.
github.com/drjohnrussel...
William Farr tested many theories around the Cholera epidemic of 1849, including a seasonal effect using a time series in conjunction with meteorological data.
github.com/drjohnrussel...

April 25, 2025 at 4:01 PM
Day 25 of #30DayChartChallenge, going back to @datavisfriendly.bsky.social's HistData package in #rstats
William Farr tested many theories around the Cholera epidemic of 1849, including a seasonal effect using a time series in conjunction with meteorological data.
github.com/drjohnrussel...
William Farr tested many theories around the Cholera epidemic of 1849, including a seasonal effect using a time series in conjunction with meteorological data.
github.com/drjohnrussel...
Day 24 of #30DayChartChallenge (WHO)
The @ropensci.org rgho package lets you easily see and download Global Health Observatory data in #rstats. I found a few datasets on road traffic fatalities, showing that cars are most deadly... to other cars around the world.
github.com/drjohnrussel...
The @ropensci.org rgho package lets you easily see and download Global Health Observatory data in #rstats. I found a few datasets on road traffic fatalities, showing that cars are most deadly... to other cars around the world.
github.com/drjohnrussel...

April 24, 2025 at 10:10 AM
Day 24 of #30DayChartChallenge (WHO)
The @ropensci.org rgho package lets you easily see and download Global Health Observatory data in #rstats. I found a few datasets on road traffic fatalities, showing that cars are most deadly... to other cars around the world.
github.com/drjohnrussel...
The @ropensci.org rgho package lets you easily see and download Global Health Observatory data in #rstats. I found a few datasets on road traffic fatalities, showing that cars are most deadly... to other cars around the world.
github.com/drjohnrussel...
Day 23 of #30DayChartChallenge (log)
While J. Kepler did not prove his third law (planet's orbital period^2 is proportional to semi-major axis^3) using data visualization, it pops in a log-log plot. #rstats using exoplanet data from @ropensci.org exoplanets package
github.com/drjohnrussel...
While J. Kepler did not prove his third law (planet's orbital period^2 is proportional to semi-major axis^3) using data visualization, it pops in a log-log plot. #rstats using exoplanet data from @ropensci.org exoplanets package
github.com/drjohnrussel...

April 23, 2025 at 10:08 AM
Day 23 of #30DayChartChallenge (log)
While J. Kepler did not prove his third law (planet's orbital period^2 is proportional to semi-major axis^3) using data visualization, it pops in a log-log plot. #rstats using exoplanet data from @ropensci.org exoplanets package
github.com/drjohnrussel...
While J. Kepler did not prove his third law (planet's orbital period^2 is proportional to semi-major axis^3) using data visualization, it pops in a log-log plot. #rstats using exoplanet data from @ropensci.org exoplanets package
github.com/drjohnrussel...
Day 22 of #30DayChartChallenge (stars), done in #rstats
J. Herschel made what @datavisfriendly.bsky.social points out as the earliest known scatter plot, using points and a smoothed curve to show that binary stars in Virgo were orbiting each other.
Code: github.com/drjohnrussel...
J. Herschel made what @datavisfriendly.bsky.social points out as the earliest known scatter plot, using points and a smoothed curve to show that binary stars in Virgo were orbiting each other.
Code: github.com/drjohnrussel...

April 22, 2025 at 9:59 AM
Day 22 of #30DayChartChallenge (stars), done in #rstats
J. Herschel made what @datavisfriendly.bsky.social points out as the earliest known scatter plot, using points and a smoothed curve to show that binary stars in Virgo were orbiting each other.
Code: github.com/drjohnrussel...
J. Herschel made what @datavisfriendly.bsky.social points out as the earliest known scatter plot, using points and a smoothed curve to show that binary stars in Virgo were orbiting each other.
Code: github.com/drjohnrussel...
Redoing some CITI training for IRB and this question is hitting a little differently than it used to...

April 21, 2025 at 6:09 PM
Redoing some CITI training for IRB and this question is hitting a little differently than it used to...
Day 21 of #30DayChartChallenge (fossils)
It's easy using @ropensci.org's paleobioDB to find and plot Mesosaurus, a fossil important to the history of Plate Tectonics.
By showing the fossils on each side of the Atlantic, Wegener theorized existence of Pangea.
Code: github.com/drjohnrussel...
It's easy using @ropensci.org's paleobioDB to find and plot Mesosaurus, a fossil important to the history of Plate Tectonics.
By showing the fossils on each side of the Atlantic, Wegener theorized existence of Pangea.
Code: github.com/drjohnrussel...

April 21, 2025 at 5:47 PM
Day 21 of #30DayChartChallenge (fossils)
It's easy using @ropensci.org's paleobioDB to find and plot Mesosaurus, a fossil important to the history of Plate Tectonics.
By showing the fossils on each side of the Atlantic, Wegener theorized existence of Pangea.
Code: github.com/drjohnrussel...
It's easy using @ropensci.org's paleobioDB to find and plot Mesosaurus, a fossil important to the history of Plate Tectonics.
By showing the fossils on each side of the Atlantic, Wegener theorized existence of Pangea.
Code: github.com/drjohnrussel...
Day 20 of #30DayChartChallenge (urbanization)
A. Parent-Duchalet's systematic look at prostitution was influenced by earlier work looking pragmatically at sewers, illuminating well the QuantCrit perspective that data is very much not inherently neutral. (1/2)
Code: github.com/drjohnrussel...
A. Parent-Duchalet's systematic look at prostitution was influenced by earlier work looking pragmatically at sewers, illuminating well the QuantCrit perspective that data is very much not inherently neutral. (1/2)
Code: github.com/drjohnrussel...

April 20, 2025 at 2:27 PM
Day 20 of #30DayChartChallenge (urbanization)
A. Parent-Duchalet's systematic look at prostitution was influenced by earlier work looking pragmatically at sewers, illuminating well the QuantCrit perspective that data is very much not inherently neutral. (1/2)
Code: github.com/drjohnrussel...
A. Parent-Duchalet's systematic look at prostitution was influenced by earlier work looking pragmatically at sewers, illuminating well the QuantCrit perspective that data is very much not inherently neutral. (1/2)
Code: github.com/drjohnrussel...
Feedback is a gift - wanted to think through how to do this by using alpha as a variable to reveal the graphs underneath as W Playfair was thinking about. New Day 19 of #30DayChartChallenge.
Code: github.com/drjohnrussel...
Code: github.com/drjohnrussel...

April 20, 2025 at 11:33 AM
Feedback is a gift - wanted to think through how to do this by using alpha as a variable to reveal the graphs underneath as W Playfair was thinking about. New Day 19 of #30DayChartChallenge.
Code: github.com/drjohnrussel...
Code: github.com/drjohnrussel...
Day 19 of #30DayChartChallenge (time series-smooth)
W Playfair's innovative use of charts included smoothing data over time series in order to show general effects over time. A reproduction in #rstats shows comparison of wages, cost of wheat, and monarch.
Code: github.com/drjohnrussel...
W Playfair's innovative use of charts included smoothing data over time series in order to show general effects over time. A reproduction in #rstats shows comparison of wages, cost of wheat, and monarch.
Code: github.com/drjohnrussel...

April 20, 2025 at 2:31 AM
Day 19 of #30DayChartChallenge (time series-smooth)
W Playfair's innovative use of charts included smoothing data over time series in order to show general effects over time. A reproduction in #rstats shows comparison of wages, cost of wheat, and monarch.
Code: github.com/drjohnrussel...
W Playfair's innovative use of charts included smoothing data over time series in order to show general effects over time. A reproduction in #rstats shows comparison of wages, cost of wheat, and monarch.
Code: github.com/drjohnrussel...
Day 18 of #30DayChartChallenge (theme: el pais)
El Pais' maps are without comparison, so for the chart I'm using @datavisfriendly.bsky.social's data in #rstats to recreate one of A. Guerry's maps of France. This one ranks departments of France by instruction.
Code: github.com/drjohnrussel...
El Pais' maps are without comparison, so for the chart I'm using @datavisfriendly.bsky.social's data in #rstats to recreate one of A. Guerry's maps of France. This one ranks departments of France by instruction.
Code: github.com/drjohnrussel...

April 18, 2025 at 3:13 PM
Day 18 of #30DayChartChallenge (theme: el pais)
El Pais' maps are without comparison, so for the chart I'm using @datavisfriendly.bsky.social's data in #rstats to recreate one of A. Guerry's maps of France. This one ranks departments of France by instruction.
Code: github.com/drjohnrussel...
El Pais' maps are without comparison, so for the chart I'm using @datavisfriendly.bsky.social's data in #rstats to recreate one of A. Guerry's maps of France. This one ranks departments of France by instruction.
Code: github.com/drjohnrussel...
Day 17 of #30DayChartChallenge (birds)
There are no bird datasets in @datavisfriendly.bsky.social's HistData, but #rstats 4.5 release has Penguins! I imagine a lot of people will be doing PCA and such, but I hadn't seen an alluvial of the infamous Palmer Dataset.
github.com/drjohnrussel...
There are no bird datasets in @datavisfriendly.bsky.social's HistData, but #rstats 4.5 release has Penguins! I imagine a lot of people will be doing PCA and such, but I hadn't seen an alluvial of the infamous Palmer Dataset.
github.com/drjohnrussel...

April 17, 2025 at 12:51 AM
Day 17 of #30DayChartChallenge (birds)
There are no bird datasets in @datavisfriendly.bsky.social's HistData, but #rstats 4.5 release has Penguins! I imagine a lot of people will be doing PCA and such, but I hadn't seen an alluvial of the infamous Palmer Dataset.
github.com/drjohnrussel...
There are no bird datasets in @datavisfriendly.bsky.social's HistData, but #rstats 4.5 release has Penguins! I imagine a lot of people will be doing PCA and such, but I hadn't seen an alluvial of the infamous Palmer Dataset.
github.com/drjohnrussel...