


Checking in to see if the world economies are missing the USA....answer is still "nope"

June 12, 2025 at 6:24 PM
Checking in to see if the world economies are missing the USA....answer is still "nope"
Yep, world is leaving us behind. Since inauguration:
>Black international developed markets (priced in USD)
>Blue S&P 500
>Orange US dollar index
They don't need us.
>Black international developed markets (priced in USD)
>Blue S&P 500
>Orange US dollar index
They don't need us.

May 24, 2025 at 12:48 PM
Yep, world is leaving us behind. Since inauguration:
>Black international developed markets (priced in USD)
>Blue S&P 500
>Orange US dollar index
They don't need us.
>Black international developed markets (priced in USD)
>Blue S&P 500
>Orange US dollar index
They don't need us.
The world doesn't miss US. Since the inauguration:
Black - world developed markets (in USD)
Blue - S&P500
Orange - US dollar index
Black - world developed markets (in USD)
Blue - S&P500
Orange - US dollar index
May 23, 2025 at 9:29 PM
The world doesn't miss US. Since the inauguration:
Black - world developed markets (in USD)
Blue - S&P500
Orange - US dollar index
Black - world developed markets (in USD)
Blue - S&P500
Orange - US dollar index
The World still doesn't miss the USA.
Change since the US presidential inauguration in USD. International developed markets black. S&P 500 blue. US dollar index orange.
Change since the US presidential inauguration in USD. International developed markets black. S&P 500 blue. US dollar index orange.
May 23, 2025 at 9:09 PM
The World still doesn't miss the USA.
Change since the US presidential inauguration in USD. International developed markets black. S&P 500 blue. US dollar index orange.
Change since the US presidential inauguration in USD. International developed markets black. S&P 500 blue. US dollar index orange.
Yep, international markets (black) doing quite well compared to the US (blue)
April 23, 2025 at 11:08 PM
Yep, international markets (black) doing quite well compared to the US (blue)
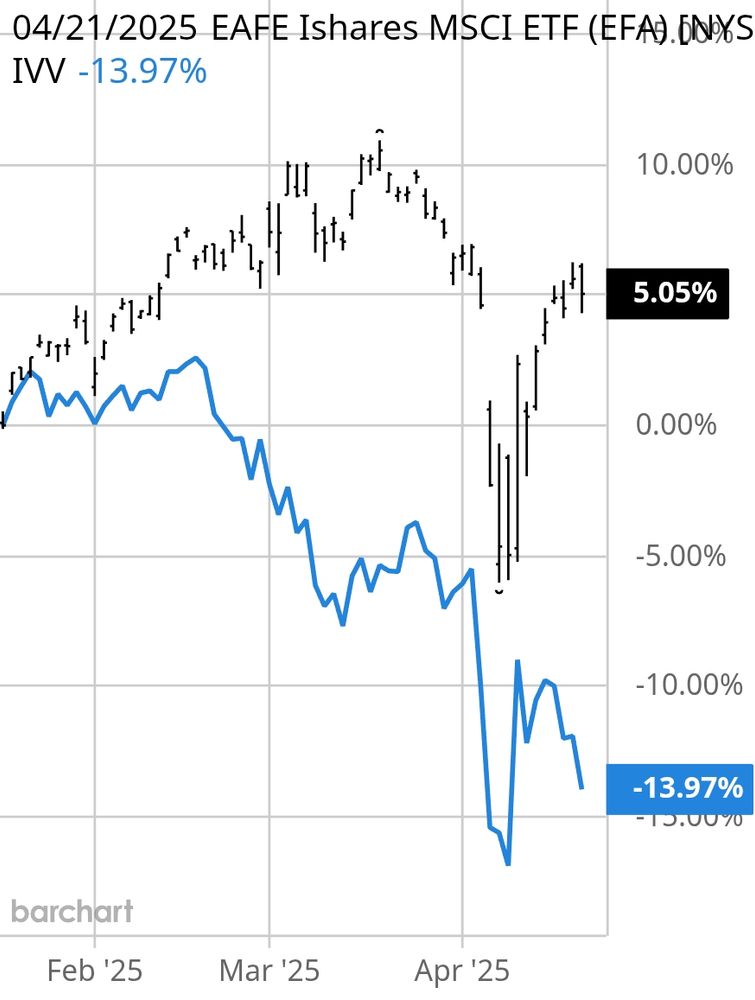
Foreign stock markets (black) priced in USD massively outperforming US (blue) since the inauguration.
April 21, 2025 at 10:36 PM
Foreign stock markets (black) priced in USD massively outperforming US (blue) since the inauguration.
Foreign stock markets (black) priced in USD massively outperforming US (blue) since the inauguration.
April 21, 2025 at 10:34 PM
Foreign stock markets (black) priced in USD massively outperforming US (blue) since the inauguration.
Foreign stock markets (black) priced in USD massively outperforming US (blue) since the inauguration.
April 21, 2025 at 10:28 PM
Foreign stock markets (black) priced in USD massively outperforming US (blue) since the inauguration.
Foreign stock markets (black) priced in USD massively outperforming US (blue) since the inauguration.
April 21, 2025 at 10:26 PM
Foreign stock markets (black) priced in USD massively outperforming US (blue) since the inauguration.
Foreign stock markets (black) priced in USD massively outperforming US (blue) since the inauguration.
April 21, 2025 at 10:17 PM
Foreign stock markets (black) priced in USD massively outperforming US (blue) since the inauguration.
International developed markets doing okay in USD. Outperforming the S&P 500 by about 19% in three months since the inauguration.
April 21, 2025 at 8:56 PM
International developed markets doing okay in USD. Outperforming the S&P 500 by about 19% in three months since the inauguration.
International developed markets up 5% (in USD) since inauguration. Outperforming the US by 19%....not doing too bad.
April 21, 2025 at 8:51 PM
International developed markets up 5% (in USD) since inauguration. Outperforming the US by 19%....not doing too bad.
I'm reminding myself how and why this nation was created.
If anyone has suggestions for other good reads, I'd appreciate your insights.
If anyone has suggestions for other good reads, I'd appreciate your insights.

April 15, 2025 at 1:55 AM
I'm reminding myself how and why this nation was created.
If anyone has suggestions for other good reads, I'd appreciate your insights.
If anyone has suggestions for other good reads, I'd appreciate your insights.
The Trump cult sheeple as they celebrate tariffs

April 3, 2025 at 12:59 AM
The Trump cult sheeple as they celebrate tariffs
For those who thought he was great for business:
Foreign ETF (EFA in black) vs US ETF (IVV in blue). 16% divergence in 8.5 weeks since the inauguration.
US markets trounced the world for over 15 years until January....
Foreign ETF (EFA in black) vs US ETF (IVV in blue). 16% divergence in 8.5 weeks since the inauguration.
US markets trounced the world for over 15 years until January....

March 20, 2025 at 8:40 PM
For those who thought he was great for business:
Foreign ETF (EFA in black) vs US ETF (IVV in blue). 16% divergence in 8.5 weeks since the inauguration.
US markets trounced the world for over 15 years until January....
Foreign ETF (EFA in black) vs US ETF (IVV in blue). 16% divergence in 8.5 weeks since the inauguration.
US markets trounced the world for over 15 years until January....
For those who thought he was great for the business:
Foreign ETF (EFA in black) vs US ETF (IVV in blue). 16% divergence in 8.5 weeks since the inauguration.
US markets trounced the world for over 15 years until January....
Foreign ETF (EFA in black) vs US ETF (IVV in blue). 16% divergence in 8.5 weeks since the inauguration.
US markets trounced the world for over 15 years until January....
March 20, 2025 at 5:23 PM
For those who thought he was great for the business:
Foreign ETF (EFA in black) vs US ETF (IVV in blue). 16% divergence in 8.5 weeks since the inauguration.
US markets trounced the world for over 15 years until January....
Foreign ETF (EFA in black) vs US ETF (IVV in blue). 16% divergence in 8.5 weeks since the inauguration.
US markets trounced the world for over 15 years until January....
Foreign ETF (EFA in black) vs US ETF (IVV in blue). 16% divergence in 8.5 weeks since the inauguration.
March 20, 2025 at 5:16 PM
Foreign ETF (EFA in black) vs US ETF (IVV in blue). 16% divergence in 8.5 weeks since the inauguration.
FOR OVER 15 YEARS, US stocks have TROUNCED international stocks.
I created this chart at barchart.com comparing two ETFs: international stocks (EFA) to US stocks (IVV). International stocks are outperforming US by 16% in nine weeks since the presidential inauguration...
(~90% per year rate trend)
I created this chart at barchart.com comparing two ETFs: international stocks (EFA) to US stocks (IVV). International stocks are outperforming US by 16% in nine weeks since the presidential inauguration...
(~90% per year rate trend)
March 19, 2025 at 11:06 PM
FOR OVER 15 YEARS, US stocks have TROUNCED international stocks.
I created this chart at barchart.com comparing two ETFs: international stocks (EFA) to US stocks (IVV). International stocks are outperforming US by 16% in nine weeks since the presidential inauguration...
(~90% per year rate trend)
I created this chart at barchart.com comparing two ETFs: international stocks (EFA) to US stocks (IVV). International stocks are outperforming US by 16% in nine weeks since the presidential inauguration...
(~90% per year rate trend)
Everything's fine, I have My Precious!

March 12, 2025 at 9:00 PM
Everything's fine, I have My Precious!


A wise man.
The Pale Blue Dot of Earth
The Pale Blue Dot of Earth

March 1, 2025 at 11:46 PM
A wise man.
The Pale Blue Dot of Earth
The Pale Blue Dot of Earth