Deniz Cem Önduygu
banner
dencemond.bsky.social
Deniz Cem Önduygu
@dencemond.bsky.social
(info, data, graphic) design, (evo, mol) biology, (history of) philosophy (bio, mind, ethics, art), memetics, evo algorithms, cog/neuro sci. https://www.denizcemonduygu.com
I thank Eren Pultar and Konda Research for helping me with the data collection. If you want to use these visualizations, you can cite this post (in Turkish): Önduygu, D.C. (2025). “İl Nüfusları 1927–2023”. www.denizcemonduygu.com/2025/05/il-n...
İl Nüfusları 1927–2023 - Deniz Cem Önduygu
Konda ile hazırladığımız Türkiye 101 projesinin ana temalarından biri kentleşme idi. Ben de bu bağlamda küçük boylarda...
www.denizcemonduygu.com
June 4, 2025 at 1:22 PM
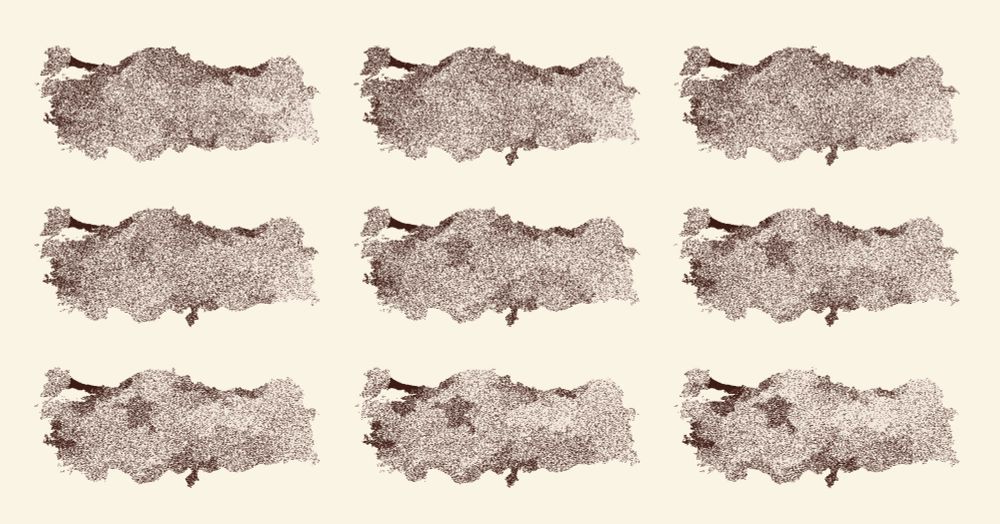
Insight: While working on this, I realized that when we use dots instead of color to represent population on a political map, we’re *visualizing* both the population and the density (population / land area). (It could work better with smaller unit areas than provinces.)
June 4, 2025 at 1:22 PM
And this is a static version that shows the absolute and proportional values for provinces in parallel.
June 4, 2025 at 1:22 PM
This version uses the absolute numbers to show the total population growth since 1927; each dot represents 3000 people.
June 4, 2025 at 1:22 PM
It may be explained by a mix of a naturalistic fallacy (1 is natural, 2 is not, so 2 is bad), a desire for control (it’s easier to control whether to get the vaccine), a distrust of science/medicine, a susceptibility to misinformation, etc. but it’s still too weird for me.
February 22, 2025 at 9:23 AM