


David Lam
@davidalam.bsky.social
Development economist and economic demographer, University of Michigan.
U Minnesota IPUMS has the DHS data. BUT web site says:
"Registration and access for IPUMS DHS is managed by The DHS Program, which is not reviewing new user applications or requests for expanded access from currently approved users at this time. IPUMS DHS data remain available to approved users."
"Registration and access for IPUMS DHS is managed by The DHS Program, which is not reviewing new user applications or requests for expanded access from currently approved users at this time. IPUMS DHS data remain available to approved users."
IPUMS-DHS
IPUMS-DHS facilitates analysis of Demographic and Health Surveys, administered in low- and middle-income countries since the 1980s.
www.idhsdata.org
February 26, 2025 at 5:43 PM
U Minnesota IPUMS has the DHS data. BUT web site says:
"Registration and access for IPUMS DHS is managed by The DHS Program, which is not reviewing new user applications or requests for expanded access from currently approved users at this time. IPUMS DHS data remain available to approved users."
"Registration and access for IPUMS DHS is managed by The DHS Program, which is not reviewing new user applications or requests for expanded access from currently approved users at this time. IPUMS DHS data remain available to approved users."
15) For details and many caveats, see the full paper in Population and Development Review (open access): doi.org/10.1111/padr...
<em>Population and Development Review</em> | Population Council Journal | Wiley Online Library
The UN projects that world population will peak at 10.3 billion in 2084, a 2.1 billion increase from 2024. Can the world provide food, water, and other resources to 10.3 billion people? How will addi...
doi.org
January 24, 2025 at 5:36 PM
15) For details and many caveats, see the full paper in Population and Development Review (open access): doi.org/10.1111/padr...
14) This is due to the combination of the steep income gradient in emissions and the fact that population growth will be heavily concentrated in the low-emissions lower-income countries, with higher income countries collectively experiencing population decline.
January 24, 2025 at 5:35 PM
14) This is due to the combination of the steep income gradient in emissions and the fact that population growth will be heavily concentrated in the low-emissions lower-income countries, with higher income countries collectively experiencing population decline.
13) Surprisingly, although UN projections imply the addition of over 2 billion people by 2084, projections of CO2 in 2084 are almost identical whether we assume that 2019 populations are constant or assume that every country follows UN projections.
January 24, 2025 at 5:34 PM
13) Surprisingly, although UN projections imply the addition of over 2 billion people by 2084, projections of CO2 in 2084 are almost identical whether we assume that 2019 populations are constant or assume that every country follows UN projections.
12) The emission-reducing impact of the 500 million population decline in high-emission higher income countries (UMICs and HICs, including China) offsets the emission-increasing impact of the 2.9 billion population increase in low-emission lower-income countries (LICs and LMICs).
January 24, 2025 at 5:34 PM
12) The emission-reducing impact of the 500 million population decline in high-emission higher income countries (UMICs and HICs, including China) offsets the emission-increasing impact of the 2.9 billion population increase in low-emission lower-income countries (LICs and LMICs).
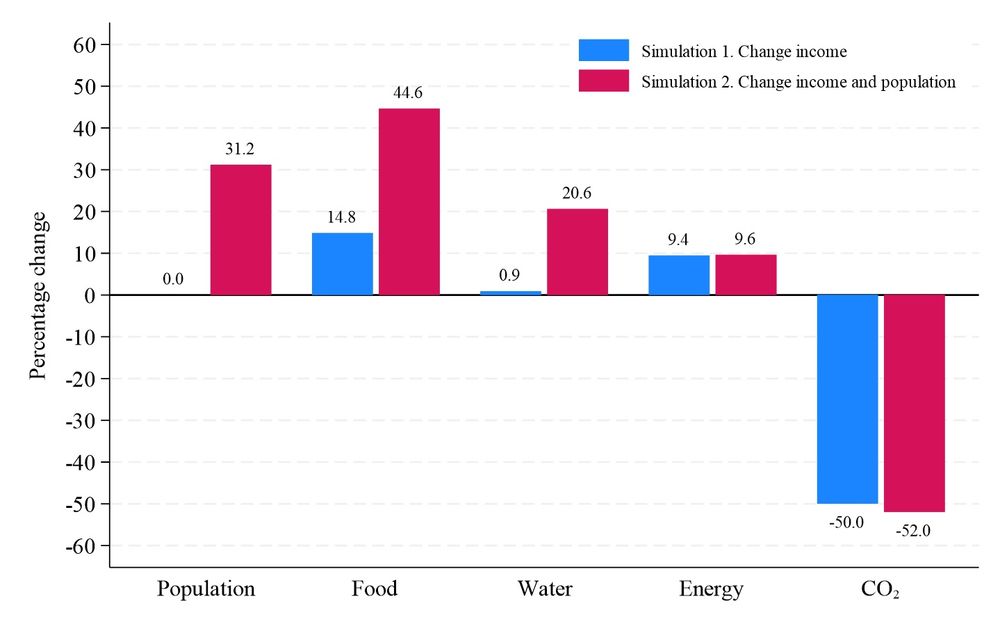
11) Population growth makes almost no difference for projections of energy and CO2. Global CO2 is projected to fall 50% in the absence of population change due to declines in energy/income intensity and carbon/energy intensity. Adding UN population projections, CO2 falls by 52%.
January 24, 2025 at 5:34 PM
11) Population growth makes almost no difference for projections of energy and CO2. Global CO2 is projected to fall 50% in the absence of population change due to declines in energy/income intensity and carbon/energy intensity. Adding UN population projections, CO2 falls by 52%.
10) Water consumption would increase only 1% due to income growth, but would increase 21% when UN population projections are added to the simulations.
January 24, 2025 at 5:33 PM
10) Water consumption would increase only 1% due to income growth, but would increase 21% when UN population projections are added to the simulations.
9) I simulate future trends with and without the UN projected population changes. Total world food consumption is projected to increase 15% by 2084 due to income growth alone. This increases to 45% when each country follows the median UN population projections.
January 24, 2025 at 5:33 PM
9) I simulate future trends with and without the UN projected population changes. Total world food consumption is projected to increase 15% by 2084 due to income growth alone. This increases to 45% when each country follows the median UN population projections.
8) I project world food, water, energy, and CO2 to 2084. Projected income growth is combined with income/consumption gradients for food and water, and is combined with projected declines in energy/income intensity and carbon/energy intensity for energy and CO2.
January 24, 2025 at 5:32 PM
8) I project world food, water, energy, and CO2 to 2084. Projected income growth is combined with income/consumption gradients for food and water, and is combined with projected declines in energy/income intensity and carbon/energy intensity for energy and CO2.
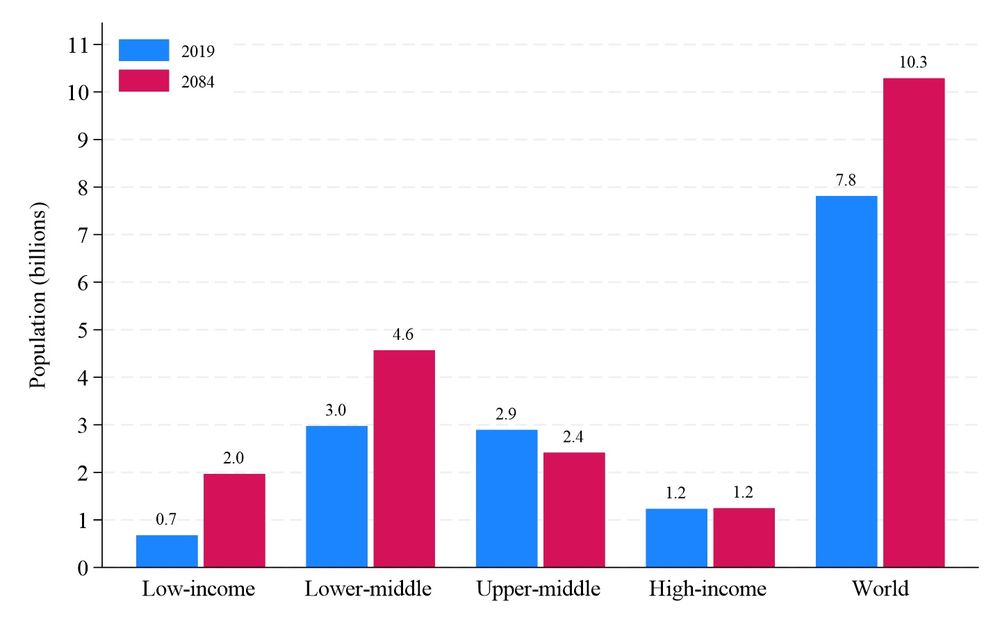
7) Second, population growth to 2084 is concentrated in low-income (LICs) and lower-middle-income (LMIC) countries, which collectively will add 2.9 billion people 2019-84. Upper-middle-income (UMIC) and high-income (HIC) countries will lose 0.5 billion, including a 600 million drop in China.
January 24, 2025 at 5:32 PM
7) Second, population growth to 2084 is concentrated in low-income (LICs) and lower-middle-income (LMIC) countries, which collectively will add 2.9 billion people 2019-84. Upper-middle-income (UMIC) and high-income (HIC) countries will lose 0.5 billion, including a 600 million drop in China.
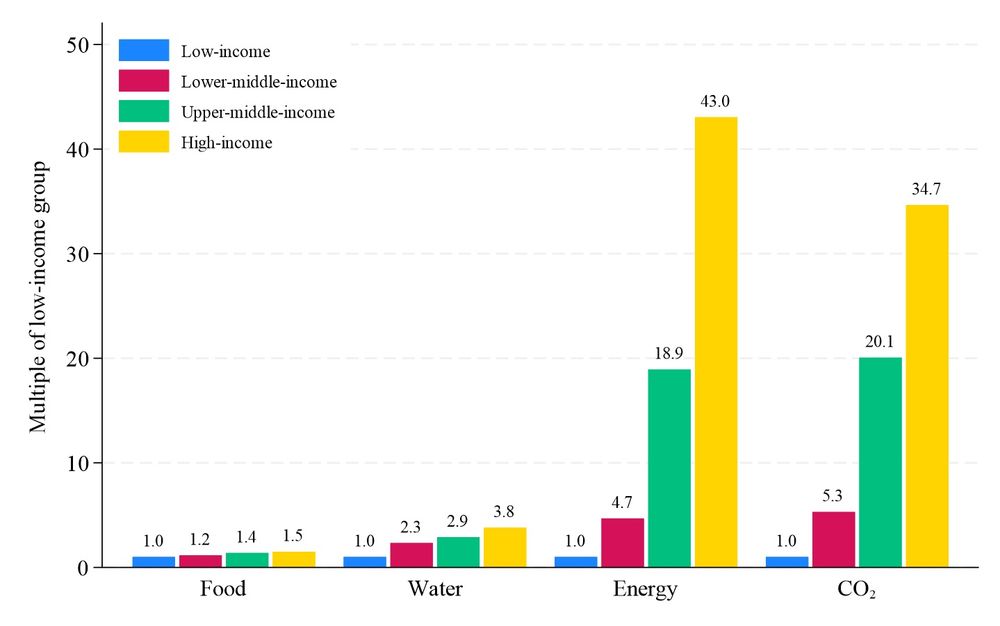
6) First, per capita consumption levels differ significantly by income level, with steeper gradients for energy and CO2 than for food and water. Food p/c is 1.5 times higher in high-income countries (HICs) than low-income countries (LICs), but CO2 p/c is 35 times higher in HICs than LICs.
January 24, 2025 at 5:31 PM
6) First, per capita consumption levels differ significantly by income level, with steeper gradients for energy and CO2 than for food and water. Food p/c is 1.5 times higher in high-income countries (HICs) than low-income countries (LICs), but CO2 p/c is 35 times higher in HICs than LICs.
5) Looking forward, I simulate the impact of UN population projections on food, water, energy, and CO2. I project from 2019 to 2084, using 2019 as the base year to avoid the impact of COVID. Results are summarized in a recent post on N-IUSSP. Three graphs explain the key points:

How will two billion more people affect food, water, energy, and CO2? - N-IUSSP
David Lam looks at the resource impact of the projected 2.1 billion increase in world population by 2084. He concludes that population change will increase demand for food and water, ... Read more
www.niussp.org
January 24, 2025 at 5:30 PM
5) Looking forward, I simulate the impact of UN population projections on food, water, energy, and CO2. I project from 2019 to 2084, using 2019 as the base year to avoid the impact of COVID. Results are summarized in a recent post on N-IUSSP. Three graphs explain the key points:
4) There are clear economic explanations for why food and resources have met the population challenge better than water and emissions. Food and most non-renewable resources are responsive to price signals caused by increasing demand. This is much less true for water and emissions.
January 24, 2025 at 5:29 PM
4) There are clear economic explanations for why food and resources have met the population challenge better than water and emissions. Food and most non-renewable resources are responsive to price signals caused by increasing demand. This is much less true for water and emissions.
3) The record of recent decades is less encouraging for water and greenhouse gases. Many countries face serious water shortages, and CO2 emissions have dramatically increased. Climate change is obviously a major challenge in coming decades.
January 24, 2025 at 5:29 PM
3) The record of recent decades is less encouraging for water and greenhouse gases. Many countries face serious water shortages, and CO2 emissions have dramatically increased. Climate change is obviously a major challenge in coming decades.
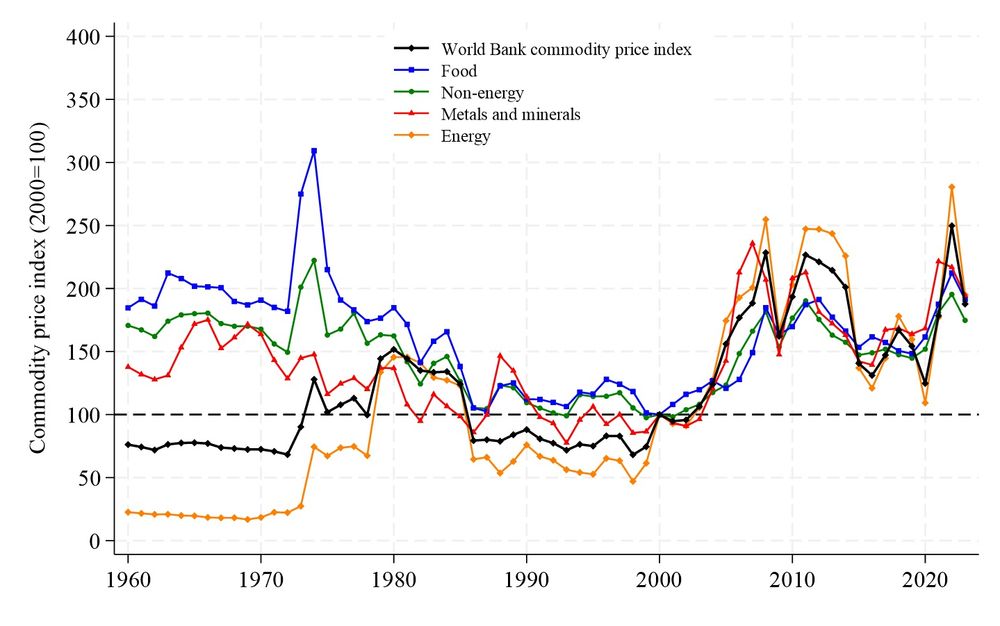
2) We have not had major shortages of non-renewable resources, in spite of adding over 5 billion people since 1960. Pre-COVID, real prices of most non-petroleum resources were around 1960s levels. After COVID spikes, prices are returning to 1960s levels.
January 24, 2025 at 5:28 PM
2) We have not had major shortages of non-renewable resources, in spite of adding over 5 billion people since 1960. Pre-COVID, real prices of most non-petroleum resources were around 1960s levels. After COVID spikes, prices are returning to 1960s levels.
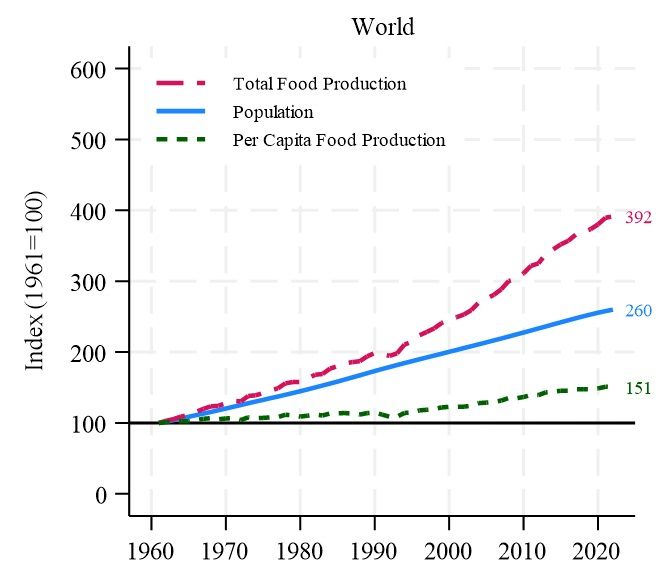
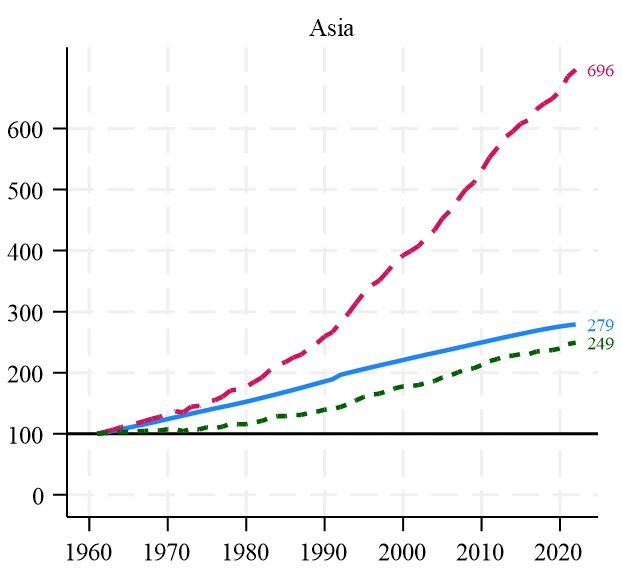
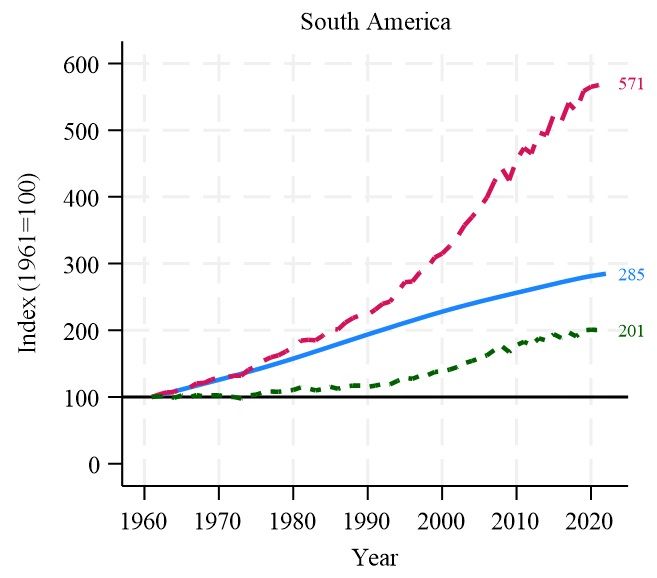
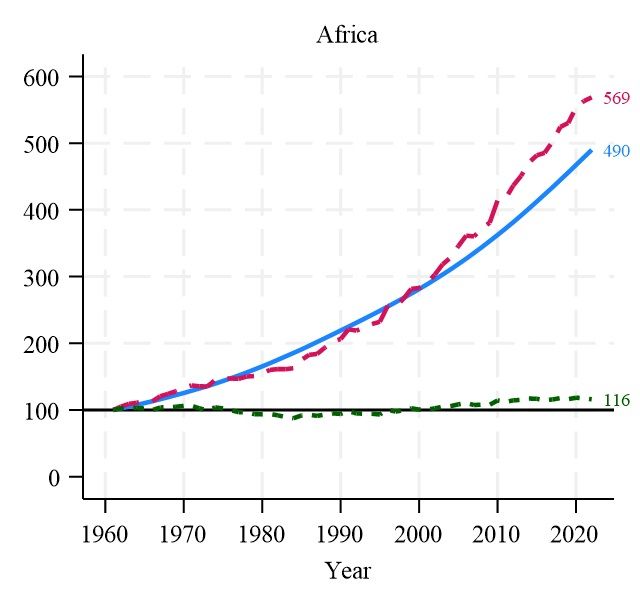
1)The last 60 years are encouraging regarding food and non-renewable resources. Food production per capita has risen in every region, though barely so in Africa. Population growth rates are falling everywhere, so food production does not need to grow as fast as in recent decades.
January 24, 2025 at 5:27 PM
1)The last 60 years are encouraging regarding food and non-renewable resources. Food production per capita has risen in every region, though barely so in Africa. Population growth rates are falling everywhere, so food production does not need to grow as fast as in recent decades.