


datavizpyr.com
@datavizpyr.bsky.social
Data Analysis to Visualisation with Python and R. Tune in for two DataViz tips per day - one in Python and and the second in R
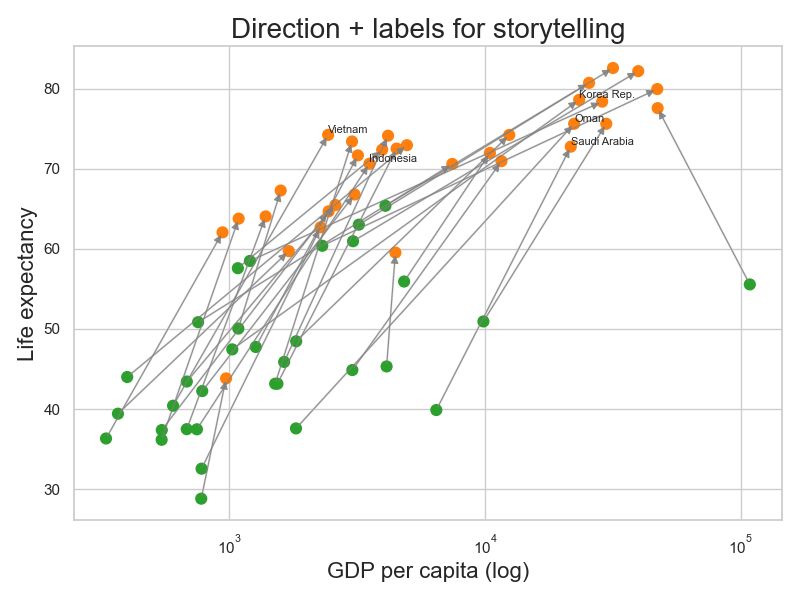
Want to connect paired data points in a scatter plot using Matplotlib? This step-by-step tutorial shows you how to draw lines between paired observations so you can easily visualize before–after / them-now comparison datavizpyr.com/connect-pair... #dataviz #python
September 5, 2025 at 5:01 PM
Want to connect paired data points in a scatter plot using Matplotlib? This step-by-step tutorial shows you how to draw lines between paired observations so you can easily visualize before–after / them-now comparison datavizpyr.com/connect-pair... #dataviz #python
