


KatieAK
@data-is-blue.bsky.social
Mostly a data viz lurker, with an offline life as a researcher and data visualisation practitioner. Mixing it up with my current project: https://www.mymatrescence.datais.blue/
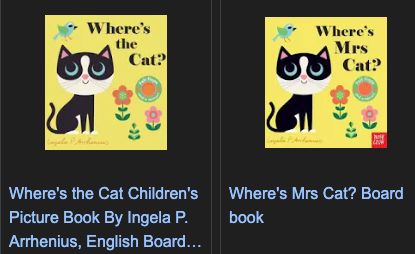
I love it! It brings to mind Ingela Arrhenius' animal lift the flap books, which were originally non-gendered but are inexplicably released in some markets (*cough*Australia*cough*) with gendered honorifics.
July 8, 2025 at 4:51 AM
I love it! It brings to mind Ingela Arrhenius' animal lift the flap books, which were originally non-gendered but are inexplicably released in some markets (*cough*Australia*cough*) with gendered honorifics.
I think it's useful! I am doing a lot of work generating word document survey analysis summaries using quarto which has been a real headache. Being able to look at other approaches is really helpful!
July 6, 2025 at 3:20 AM
I think it's useful! I am doing a lot of work generating word document survey analysis summaries using quarto which has been a real headache. Being able to look at other approaches is really helpful!
Thanks for a great presentation :) it made my day to get to watch something super relevant to what I'm working on at the moment during my standard working hours (unheard of!)
June 10, 2025 at 11:45 AM
Thanks for a great presentation :) it made my day to get to watch something super relevant to what I'm working on at the moment during my standard working hours (unheard of!)
There would be a pop of the highlight for each language and would draw more attention to languages with most bfrequent letters that aren't E (or would be a wall of bright green Es 😅)
May 22, 2025 at 12:15 PM
There would be a pop of the highlight for each language and would draw more attention to languages with most bfrequent letters that aren't E (or would be a wall of bright green Es 😅)
I like the experiment and the colour version more but maybe the colours could use some tweaking? It looks like the colours are an encoding of frequency across the entire dataset - maybe if the scale was frequency across the individual language the colour would add more to the visualisation?
May 22, 2025 at 12:15 PM
I like the experiment and the colour version more but maybe the colours could use some tweaking? It looks like the colours are an encoding of frequency across the entire dataset - maybe if the scale was frequency across the individual language the colour would add more to the visualisation?