


@data-dimes.bsky.social
Sports, Tech, Data – exploring the wide world of sports through the big world of numbers with a focus on women's leagues. Analytics, coding, and keeping the game exciting, not boring. 🚀📊🏀
One month into the WNBA season here’s a look at some early stat leaders (min. 100 mins played):
FG%: Aliyah Boston – 63%
3P%: Kennedy Burke – 63%
REB: Angel Reese – 12.1
AST: Caitlin Clark – 9.3
STL: Napheesa Collier – 2.3
PTS: Napheesa Collier – 25.5
FG%: Aliyah Boston – 63%
3P%: Kennedy Burke – 63%
REB: Angel Reese – 12.1
AST: Caitlin Clark – 9.3
STL: Napheesa Collier – 2.3
PTS: Napheesa Collier – 25.5
June 11, 2025 at 6:51 PM
One month into the WNBA season here’s a look at some early stat leaders (min. 100 mins played):
FG%: Aliyah Boston – 63%
3P%: Kennedy Burke – 63%
REB: Angel Reese – 12.1
AST: Caitlin Clark – 9.3
STL: Napheesa Collier – 2.3
PTS: Napheesa Collier – 25.5
FG%: Aliyah Boston – 63%
3P%: Kennedy Burke – 63%
REB: Angel Reese – 12.1
AST: Caitlin Clark – 9.3
STL: Napheesa Collier – 2.3
PTS: Napheesa Collier – 25.5
College Softball World Series Prediction!
Using 2025 season stats & a custom formula, here's how the top teams stack up:
1️⃣ Oklahoma: 64.65 CPS
2️⃣ Texas: 57.45 CPS
3️⃣ UCLA: 51.05 CPS
Our formula weighs batting average, runs/HR per game, and crucial pitching/defense (ERA, runs allowed per game).
Using 2025 season stats & a custom formula, here's how the top teams stack up:
1️⃣ Oklahoma: 64.65 CPS
2️⃣ Texas: 57.45 CPS
3️⃣ UCLA: 51.05 CPS
Our formula weighs batting average, runs/HR per game, and crucial pitching/defense (ERA, runs allowed per game).
May 28, 2025 at 7:42 PM
College Softball World Series Prediction!
Using 2025 season stats & a custom formula, here's how the top teams stack up:
1️⃣ Oklahoma: 64.65 CPS
2️⃣ Texas: 57.45 CPS
3️⃣ UCLA: 51.05 CPS
Our formula weighs batting average, runs/HR per game, and crucial pitching/defense (ERA, runs allowed per game).
Using 2025 season stats & a custom formula, here's how the top teams stack up:
1️⃣ Oklahoma: 64.65 CPS
2️⃣ Texas: 57.45 CPS
3️⃣ UCLA: 51.05 CPS
Our formula weighs batting average, runs/HR per game, and crucial pitching/defense (ERA, runs allowed per game).
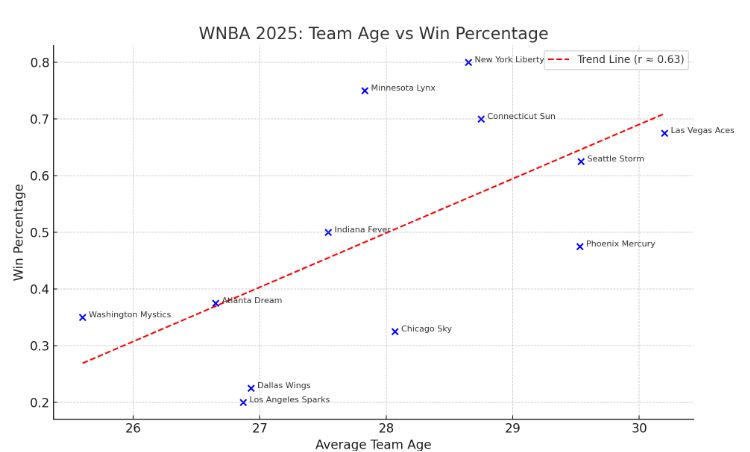
Is a more experienced roster in the WNBA actually important? In 2024, there was a moderate positive correlation (0.63) between average team age and win percentage. Seems like a slightly more experienced roster might offer a bit of an edge, but it's definitely not the only factor determining success!
May 21, 2025 at 7:42 PM
Is a more experienced roster in the WNBA actually important? In 2024, there was a moderate positive correlation (0.63) between average team age and win percentage. Seems like a slightly more experienced roster might offer a bit of an edge, but it's definitely not the only factor determining success!
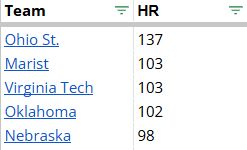
The NCAA Softball Tournament starts today!
Below is a look at some of the top teams heading into Regionals
Here are the averages among all teams:
• Batting Avg: .315
• Home Runs: 57
• ERA: 3.11
Below is a look at some of the top teams heading into Regionals
Here are the averages among all teams:
• Batting Avg: .315
• Home Runs: 57
• ERA: 3.11


May 15, 2025 at 4:45 PM
The NCAA Softball Tournament starts today!
Below is a look at some of the top teams heading into Regionals
Here are the averages among all teams:
• Batting Avg: .315
• Home Runs: 57
• ERA: 3.11
Below is a look at some of the top teams heading into Regionals
Here are the averages among all teams:
• Batting Avg: .315
• Home Runs: 57
• ERA: 3.11
As the #WNBA season tips off, a look at what it takes to be champions, by the numbers (average):
Win %: .746 (98 Comets set the bar at .900!)
FG%: 45% (16 Sparks shot a blistering 49%)
3P%: 36% (12 Fever were downtown queens at 40%)
Points: 80.9/game (09 Mercury scorched nets at 92.8)
Win %: .746 (98 Comets set the bar at .900!)
FG%: 45% (16 Sparks shot a blistering 49%)
3P%: 36% (12 Fever were downtown queens at 40%)
Points: 80.9/game (09 Mercury scorched nets at 92.8)
May 6, 2025 at 7:22 PM
As the #WNBA season tips off, a look at what it takes to be champions, by the numbers (average):
Win %: .746 (98 Comets set the bar at .900!)
FG%: 45% (16 Sparks shot a blistering 49%)
3P%: 36% (12 Fever were downtown queens at 40%)
Points: 80.9/game (09 Mercury scorched nets at 92.8)
Win %: .746 (98 Comets set the bar at .900!)
FG%: 45% (16 Sparks shot a blistering 49%)
3P%: 36% (12 Fever were downtown queens at 40%)
Points: 80.9/game (09 Mercury scorched nets at 92.8)
Which WNBA Draft pick has the most career win shares?
No surprise: Pick #1 leads by a lot.
📈 Avg WS for #1 pick: 35.2
📉 Avg WS for #2 pick: 16.3
The gap between picks 1 and 2 is massive.
No surprise: Pick #1 leads by a lot.
📈 Avg WS for #1 pick: 35.2
📉 Avg WS for #2 pick: 16.3
The gap between picks 1 and 2 is massive.

April 27, 2025 at 12:27 AM
Which WNBA Draft pick has the most career win shares?
No surprise: Pick #1 leads by a lot.
📈 Avg WS for #1 pick: 35.2
📉 Avg WS for #2 pick: 16.3
The gap between picks 1 and 2 is massive.
No surprise: Pick #1 leads by a lot.
📈 Avg WS for #1 pick: 35.2
📉 Avg WS for #2 pick: 16.3
The gap between picks 1 and 2 is massive.
Lowest-performing WNBA draft classes based on Avg Win Shares, Points, and Assists:
Lowest WS: 2023, 2024, 2022, 2020, 2000
Lowest Points: 2000, 2023, 2007, 2010, 2002
Lowest Assists: 2021, 2007, 2003, 2022, 2000
Even with a few strong players 2000 struggled in all 3 categories.
Lowest WS: 2023, 2024, 2022, 2020, 2000
Lowest Points: 2000, 2023, 2007, 2010, 2002
Lowest Assists: 2021, 2007, 2003, 2022, 2000
Even with a few strong players 2000 struggled in all 3 categories.
April 24, 2025 at 7:34 PM
Lowest-performing WNBA draft classes based on Avg Win Shares, Points, and Assists:
Lowest WS: 2023, 2024, 2022, 2020, 2000
Lowest Points: 2000, 2023, 2007, 2010, 2002
Lowest Assists: 2021, 2007, 2003, 2022, 2000
Even with a few strong players 2000 struggled in all 3 categories.
Lowest WS: 2023, 2024, 2022, 2020, 2000
Lowest Points: 2000, 2023, 2007, 2010, 2002
Lowest Assists: 2021, 2007, 2003, 2022, 2000
Even with a few strong players 2000 struggled in all 3 categories.
Best WNBA Draft Classes by the numbers (Avg Win Shares, Points, Assists):
Top in Win Shares: 2001, 2004, 1999, 2009, 2011
Top in Points: 2018, 1999, 2019, 2014, 2024
Top in Assists: 2024, 1999, 2014, 2018, 2020
1999 stands out w/ top 5 in all 3. Some notable names: Holdsclaw, Staley, Griffin.
Top in Win Shares: 2001, 2004, 1999, 2009, 2011
Top in Points: 2018, 1999, 2019, 2014, 2024
Top in Assists: 2024, 1999, 2014, 2018, 2020
1999 stands out w/ top 5 in all 3. Some notable names: Holdsclaw, Staley, Griffin.
April 23, 2025 at 7:17 PM
Best WNBA Draft Classes by the numbers (Avg Win Shares, Points, Assists):
Top in Win Shares: 2001, 2004, 1999, 2009, 2011
Top in Points: 2018, 1999, 2019, 2014, 2024
Top in Assists: 2024, 1999, 2014, 2018, 2020
1999 stands out w/ top 5 in all 3. Some notable names: Holdsclaw, Staley, Griffin.
Top in Win Shares: 2001, 2004, 1999, 2009, 2011
Top in Points: 2018, 1999, 2019, 2014, 2024
Top in Assists: 2024, 1999, 2014, 2018, 2020
1999 stands out w/ top 5 in all 3. Some notable names: Holdsclaw, Staley, Griffin.
Nico’s making waves in CFB this week 💰 But beyond the $$$, how does he stack up compared to other high paid SEC QBs?
Stats 2024 season:
🔸 Iamaleava: 19 TDs, 63.8%, 5 INT, 2616 yds (334 att)
🔸 Beck: 28 TDs, 64.7%, 12 INT, 3485 yds (448 att)
🔸 Lagway: 12 TDs, 59.9%, 9 INT, 1915 yds (192 att)
Stats 2024 season:
🔸 Iamaleava: 19 TDs, 63.8%, 5 INT, 2616 yds (334 att)
🔸 Beck: 28 TDs, 64.7%, 12 INT, 3485 yds (448 att)
🔸 Lagway: 12 TDs, 59.9%, 9 INT, 1915 yds (192 att)
April 15, 2025 at 3:56 PM
Nico’s making waves in CFB this week 💰 But beyond the $$$, how does he stack up compared to other high paid SEC QBs?
Stats 2024 season:
🔸 Iamaleava: 19 TDs, 63.8%, 5 INT, 2616 yds (334 att)
🔸 Beck: 28 TDs, 64.7%, 12 INT, 3485 yds (448 att)
🔸 Lagway: 12 TDs, 59.9%, 9 INT, 1915 yds (192 att)
Stats 2024 season:
🔸 Iamaleava: 19 TDs, 63.8%, 5 INT, 2616 yds (334 att)
🔸 Beck: 28 TDs, 64.7%, 12 INT, 3485 yds (448 att)
🔸 Lagway: 12 TDs, 59.9%, 9 INT, 1915 yds (192 att)
UCONN finished well within our champ criteria. PPG- 81.9, Opponent PPG-52.2, Points Differential- 29.50 and only 3 losses on the season.
Since 2000, every NCAA Women’s Basketball Champ has met these criteria:
✅ Avg. >70.9 PPG
✅ Allowed <67.8 PPG
✅ Point diff. ≥13.6
✅ ≤5 total losses
✅ Big 5 conf. (incl. Big East)
Here are the teams right now:
UConn
LSU
Notre Dame
Ohio State
Oklahoma State
South Carolina
USC
TCU
Texas
UCLA
✅ Avg. >70.9 PPG
✅ Allowed <67.8 PPG
✅ Point diff. ≥13.6
✅ ≤5 total losses
✅ Big 5 conf. (incl. Big East)
Here are the teams right now:
UConn
LSU
Notre Dame
Ohio State
Oklahoma State
South Carolina
USC
TCU
Texas
UCLA

April 8, 2025 at 2:38 PM
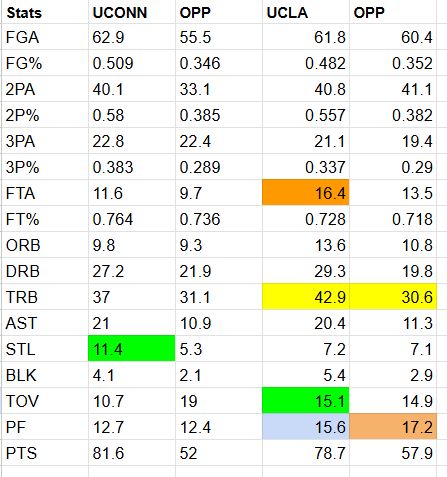
UCONN finished well within our champ criteria. PPG- 81.9, Opponent PPG-52.2, Points Differential- 29.50 and only 3 losses on the season.
UConn held UCLA below their season averages across the board in scoring and rebounding. UCLA shot just 38% from the field (season avg: 48%), got to the free throw line only 8 times (avg: 16.4), and grabbed 29 total rebounds (avg: 42.9). UConn also forced 19 turnovers—well above UCLA’s average of 15.
UConn vs. UCLA Matchup Insights
UConn = Elite offense (50.9% FG), but UCLA locks down inside (opp 38.2% 2P%).
UCLA dominates boards (+12 margin).
UConn forces TOs, UCLA TO prone.
UCLA gets to the FT line more.
UConn = Elite offense (50.9% FG), but UCLA locks down inside (opp 38.2% 2P%).
UCLA dominates boards (+12 margin).
UConn forces TOs, UCLA TO prone.
UCLA gets to the FT line more.
April 5, 2025 at 3:28 PM
UConn held UCLA below their season averages across the board in scoring and rebounding. UCLA shot just 38% from the field (season avg: 48%), got to the free throw line only 8 times (avg: 16.4), and grabbed 29 total rebounds (avg: 42.9). UConn also forced 19 turnovers—well above UCLA’s average of 15.
UConn vs. UCLA Matchup Insights
UConn = Elite offense (50.9% FG), but UCLA locks down inside (opp 38.2% 2P%).
UCLA dominates boards (+12 margin).
UConn forces TOs, UCLA TO prone.
UCLA gets to the FT line more.
UConn = Elite offense (50.9% FG), but UCLA locks down inside (opp 38.2% 2P%).
UCLA dominates boards (+12 margin).
UConn forces TOs, UCLA TO prone.
UCLA gets to the FT line more.
April 3, 2025 at 11:08 PM
UConn vs. UCLA Matchup Insights
UConn = Elite offense (50.9% FG), but UCLA locks down inside (opp 38.2% 2P%).
UCLA dominates boards (+12 margin).
UConn forces TOs, UCLA TO prone.
UCLA gets to the FT line more.
UConn = Elite offense (50.9% FG), but UCLA locks down inside (opp 38.2% 2P%).
UCLA dominates boards (+12 margin).
UConn forces TOs, UCLA TO prone.
UCLA gets to the FT line more.
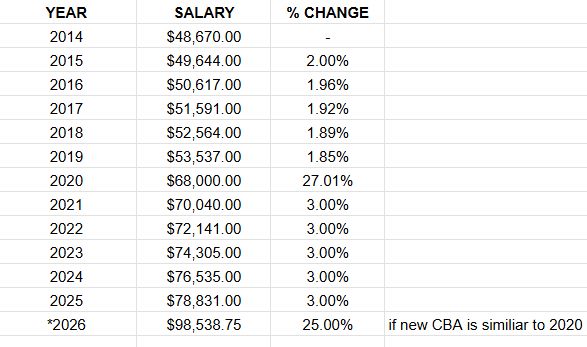
WNBA CBA Trends
Since 2014, Pick 1-4 rookie first year salaries increased 2-3% per year (when no new CBA). But in 2020, with a new CBA, the jump was 27%!
Top prospects staying in college for 2026 CBA talks could see a major 💰 boost if 2026 follows the 2020 negotiations!
Since 2014, Pick 1-4 rookie first year salaries increased 2-3% per year (when no new CBA). But in 2020, with a new CBA, the jump was 27%!
Top prospects staying in college for 2026 CBA talks could see a major 💰 boost if 2026 follows the 2020 negotiations!
March 26, 2025 at 6:40 PM
WNBA CBA Trends
Since 2014, Pick 1-4 rookie first year salaries increased 2-3% per year (when no new CBA). But in 2020, with a new CBA, the jump was 27%!
Top prospects staying in college for 2026 CBA talks could see a major 💰 boost if 2026 follows the 2020 negotiations!
Since 2014, Pick 1-4 rookie first year salaries increased 2-3% per year (when no new CBA). But in 2020, with a new CBA, the jump was 27%!
Top prospects staying in college for 2026 CBA talks could see a major 💰 boost if 2026 follows the 2020 negotiations!
🏀 NCAA Women's Tournament History:
🔹 76% of champions were No. 1 seeds
🔹 17% were No. 2 seeds
🔹 The highest seed to win? A No. 3 seed 👀 (LSU 2023, Tennessee 1997, UNC 1994)
🔹 76% of champions were No. 1 seeds
🔹 17% were No. 2 seeds
🔹 The highest seed to win? A No. 3 seed 👀 (LSU 2023, Tennessee 1997, UNC 1994)
March 22, 2025 at 11:33 PM
🏀 NCAA Women's Tournament History:
🔹 76% of champions were No. 1 seeds
🔹 17% were No. 2 seeds
🔹 The highest seed to win? A No. 3 seed 👀 (LSU 2023, Tennessee 1997, UNC 1994)
🔹 76% of champions were No. 1 seeds
🔹 17% were No. 2 seeds
🔹 The highest seed to win? A No. 3 seed 👀 (LSU 2023, Tennessee 1997, UNC 1994)
March Madness is here! Your chances of a perfect bracket? 1 in 147.5 quintillion—about 20 times the grains of sand on Earth. May the odds he ever in your favor.
March 20, 2025 at 10:56 AM
March Madness is here! Your chances of a perfect bracket? 1 in 147.5 quintillion—about 20 times the grains of sand on Earth. May the odds he ever in your favor.
Update after conference tournaments. These are the teams that still met the criteria:
UConn
LSU
Notre Dame
South Carolina
USC
TCU
Texas
UConn
LSU
Notre Dame
South Carolina
USC
TCU
Texas
Since 2000, every NCAA Women’s Basketball Champ has met these criteria:
✅ Avg. >70.9 PPG
✅ Allowed <67.8 PPG
✅ Point diff. ≥13.6
✅ ≤5 total losses
✅ Big 5 conf. (incl. Big East)
Here are the teams right now:
UConn
LSU
Notre Dame
Ohio State
Oklahoma State
South Carolina
USC
TCU
Texas
UCLA
✅ Avg. >70.9 PPG
✅ Allowed <67.8 PPG
✅ Point diff. ≥13.6
✅ ≤5 total losses
✅ Big 5 conf. (incl. Big East)
Here are the teams right now:
UConn
LSU
Notre Dame
Ohio State
Oklahoma State
South Carolina
USC
TCU
Texas
UCLA
March 12, 2025 at 4:16 PM
Update after conference tournaments. These are the teams that still met the criteria:
UConn
LSU
Notre Dame
South Carolina
USC
TCU
Texas
UConn
LSU
Notre Dame
South Carolina
USC
TCU
Texas
NCAA Softball Conference Play is Underway! Pitchers with 10+ appearances this season.
ERA:
Citlaly Gutierrez (Texas) – 0.45
Kaitlyn Felton (UCF) – 0.52
Meghan Golden (Grand Canyon) – 0.55
Strikeouts:
Ella Harrison (Rutgers) – 124
NiJaree Canady (Texas Tech) – 106
Maya Johnson (Belmont) – 106
ERA:
Citlaly Gutierrez (Texas) – 0.45
Kaitlyn Felton (UCF) – 0.52
Meghan Golden (Grand Canyon) – 0.55
Strikeouts:
Ella Harrison (Rutgers) – 124
NiJaree Canady (Texas Tech) – 106
Maya Johnson (Belmont) – 106
March 10, 2025 at 5:20 PM
NCAA Softball Conference Play is Underway! Pitchers with 10+ appearances this season.
ERA:
Citlaly Gutierrez (Texas) – 0.45
Kaitlyn Felton (UCF) – 0.52
Meghan Golden (Grand Canyon) – 0.55
Strikeouts:
Ella Harrison (Rutgers) – 124
NiJaree Canady (Texas Tech) – 106
Maya Johnson (Belmont) – 106
ERA:
Citlaly Gutierrez (Texas) – 0.45
Kaitlyn Felton (UCF) – 0.52
Meghan Golden (Grand Canyon) – 0.55
Strikeouts:
Ella Harrison (Rutgers) – 124
NiJaree Canady (Texas Tech) – 106
Maya Johnson (Belmont) – 106
Since 2000, every NCAA Women’s Basketball Champ has met these criteria:
✅ Avg. >70.9 PPG
✅ Allowed <67.8 PPG
✅ Point diff. ≥13.6
✅ ≤5 total losses
✅ Big 5 conf. (incl. Big East)
Here are the teams right now:
UConn
LSU
Notre Dame
Ohio State
Oklahoma State
South Carolina
USC
TCU
Texas
UCLA
✅ Avg. >70.9 PPG
✅ Allowed <67.8 PPG
✅ Point diff. ≥13.6
✅ ≤5 total losses
✅ Big 5 conf. (incl. Big East)
Here are the teams right now:
UConn
LSU
Notre Dame
Ohio State
Oklahoma State
South Carolina
USC
TCU
Texas
UCLA
March 5, 2025 at 4:22 PM
Since 2000, every NCAA Women’s Basketball Champ has met these criteria:
✅ Avg. >70.9 PPG
✅ Allowed <67.8 PPG
✅ Point diff. ≥13.6
✅ ≤5 total losses
✅ Big 5 conf. (incl. Big East)
Here are the teams right now:
UConn
LSU
Notre Dame
Ohio State
Oklahoma State
South Carolina
USC
TCU
Texas
UCLA
✅ Avg. >70.9 PPG
✅ Allowed <67.8 PPG
✅ Point diff. ≥13.6
✅ ≤5 total losses
✅ Big 5 conf. (incl. Big East)
Here are the teams right now:
UConn
LSU
Notre Dame
Ohio State
Oklahoma State
South Carolina
USC
TCU
Texas
UCLA
2023 Women's World Cup, the USWNT had just one player who didn't play for a club in the NWSL. However, by the 2025 SheBelieves Cup, that number grew to six players on the roster playing in other leagues.
Is this a sign of a trend where the NWSL is losing homegrown talent to other leagues?
Is this a sign of a trend where the NWSL is losing homegrown talent to other leagues?
March 4, 2025 at 6:34 PM
2023 Women's World Cup, the USWNT had just one player who didn't play for a club in the NWSL. However, by the 2025 SheBelieves Cup, that number grew to six players on the roster playing in other leagues.
Is this a sign of a trend where the NWSL is losing homegrown talent to other leagues?
Is this a sign of a trend where the NWSL is losing homegrown talent to other leagues?
Looking at career stats from Wade Trophy winners in the WNBA and compare them to the NCAA women’s basketball leaders this season. Here’s where PPG would rank!
Caitlin Clark – 28.4
Kelsey Plum – 25.4
Ta'Niya Latson (Florida State) - 25.4
JuJu Watkins (USC) - 24.4
Grace Larkin (South Dakota) - 24.3
Caitlin Clark – 28.4
Kelsey Plum – 25.4
Ta'Niya Latson (Florida State) - 25.4
JuJu Watkins (USC) - 24.4
Grace Larkin (South Dakota) - 24.3
March 3, 2025 at 4:50 PM
Looking at career stats from Wade Trophy winners in the WNBA and compare them to the NCAA women’s basketball leaders this season. Here’s where PPG would rank!
Caitlin Clark – 28.4
Kelsey Plum – 25.4
Ta'Niya Latson (Florida State) - 25.4
JuJu Watkins (USC) - 24.4
Grace Larkin (South Dakota) - 24.3
Caitlin Clark – 28.4
Kelsey Plum – 25.4
Ta'Niya Latson (Florida State) - 25.4
JuJu Watkins (USC) - 24.4
Grace Larkin (South Dakota) - 24.3
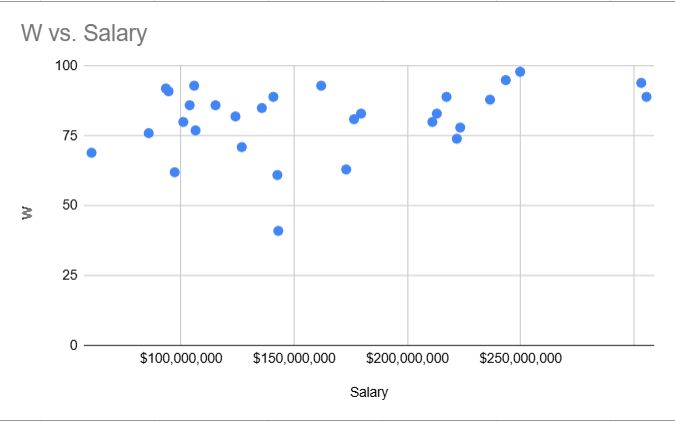
Even though the World Series Yankees and Dodgers were near the top for 2024 salaries, not every team got their return. In 2024, there was only a 0.315 correlation between salary spending and team wins. Spending big didn’t always guarantee success last season!
February 21, 2025 at 2:43 PM
Even though the World Series Yankees and Dodgers were near the top for 2024 salaries, not every team got their return. In 2024, there was only a 0.315 correlation between salary spending and team wins. Spending big didn’t always guarantee success last season!
Reposted

There were 3,484 points scored in the NBA on Wednesday, making it the 3rd highest-scoring night in league history. 🤯

February 13, 2025 at 8:52 PM
There were 3,484 points scored in the NBA on Wednesday, making it the 3rd highest-scoring night in league history. 🤯
Maybe our next project should be diving into the data to analyze how NIL deals are being distributed across athletes and sports.

From @theathletic.bsky.social: The Department of Education has rescinded Title IX guidance that stated NIL payments must be proportionate between a university’s male and female athletes. nyti.ms/40Z3Z4i

Department of Education rescinds Title IX guidance that NIL payments must be proportionate
How Title IX would factor into schools' revenue-sharing decisions has been a lingering question.
nyti.ms
February 13, 2025 at 1:26 AM
Maybe our next project should be diving into the data to analyze how NIL deals are being distributed across athletes and sports.
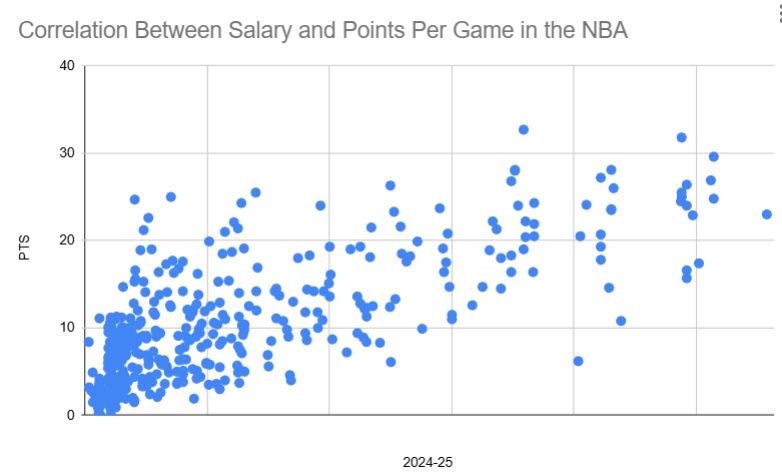
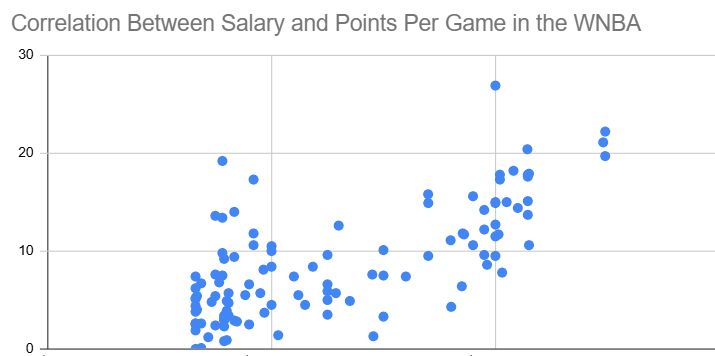
How do you get paid more in basketball? You better score!
The correlation between salary & points per game in the most recent season:
WNBA: 0.71
NBA: 0.74
In both leagues, the more you put up in points, the more likely you are to get the bigger paycheck!
The correlation between salary & points per game in the most recent season:
WNBA: 0.71
NBA: 0.74
In both leagues, the more you put up in points, the more likely you are to get the bigger paycheck!
February 12, 2025 at 9:52 PM
How do you get paid more in basketball? You better score!
The correlation between salary & points per game in the most recent season:
WNBA: 0.71
NBA: 0.74
In both leagues, the more you put up in points, the more likely you are to get the bigger paycheck!
The correlation between salary & points per game in the most recent season:
WNBA: 0.71
NBA: 0.74
In both leagues, the more you put up in points, the more likely you are to get the bigger paycheck!
2025 marks the 29th season for the WNBA, just like the NBA in 1978! Here’s how they compare in their 29th year:
WNBA Average Salary: $129,352
NBA Average Salary: $130,000
WNBA Teams: 13
NBA Teams : 22
WNBA TV Deals: $200M
NBA TV Deals : $18.5M
WNBA Avg Attendance : 9,807
NBA Avg Attendance: 7,800
WNBA Average Salary: $129,352
NBA Average Salary: $130,000
WNBA Teams: 13
NBA Teams : 22
WNBA TV Deals: $200M
NBA TV Deals : $18.5M
WNBA Avg Attendance : 9,807
NBA Avg Attendance: 7,800
February 7, 2025 at 8:56 PM
2025 marks the 29th season for the WNBA, just like the NBA in 1978! Here’s how they compare in their 29th year:
WNBA Average Salary: $129,352
NBA Average Salary: $130,000
WNBA Teams: 13
NBA Teams : 22
WNBA TV Deals: $200M
NBA TV Deals : $18.5M
WNBA Avg Attendance : 9,807
NBA Avg Attendance: 7,800
WNBA Average Salary: $129,352
NBA Average Salary: $130,000
WNBA Teams: 13
NBA Teams : 22
WNBA TV Deals: $200M
NBA TV Deals : $18.5M
WNBA Avg Attendance : 9,807
NBA Avg Attendance: 7,800