


Cong Yin
@cyinglobe.bsky.social
Postdoc in wildfires and climate extremes at UC Merced.
Homepage: https://xscience.netlify.app/
Homepage: https://xscience.netlify.app/
Reposted by Cong Yin
🔥 Our new research in @science.org shows that people are increasingly exposed to fires globally, driven by overlapping shifts in where #fires occur and where people live.
But changes in exposure vary hugely by region and are shaped by different population dynamics.👇
www.science.org/doi/10.1126/...
But changes in exposure vary hugely by region and are shaped by different population dynamics.👇
www.science.org/doi/10.1126/...

Increasing global human exposure to wildland fires despite declining burned area
Although half of Earth’s population resides in the wildland-urban interface, human exposure to wildland fires remains unquantified. We show that the population directly exposed to wildland fires incre...
www.science.org
August 22, 2025 at 10:18 AM
🔥 Our new research in @science.org shows that people are increasingly exposed to fires globally, driven by overlapping shifts in where #fires occur and where people live.
But changes in exposure vary hugely by region and are shaped by different population dynamics.👇
www.science.org/doi/10.1126/...
But changes in exposure vary hugely by region and are shaped by different population dynamics.👇
www.science.org/doi/10.1126/...
Reposted by Cong Yin
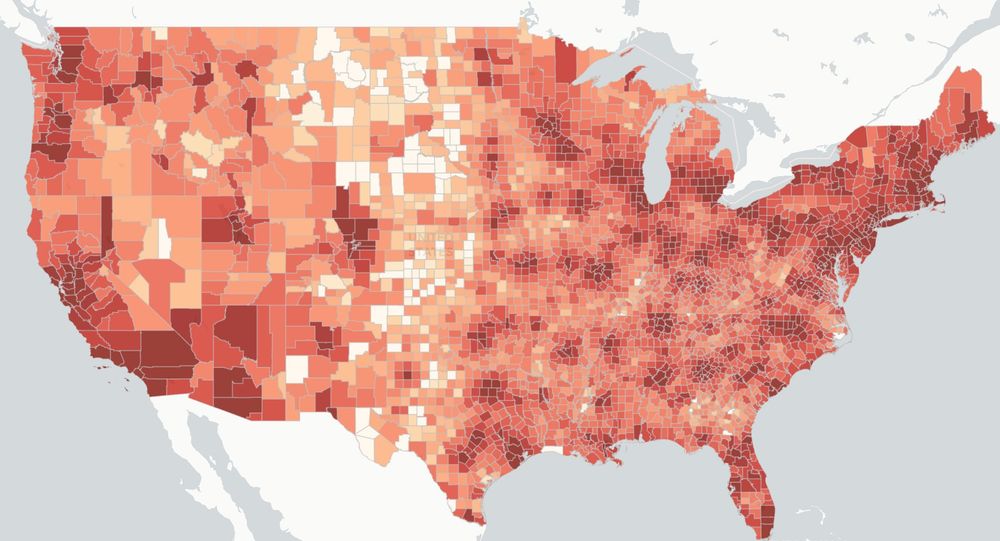
Working with an interdisciplinary team, we have developed a website to communicate how the White House's proposed cuts to health research would cause losses of $16B and 68,500 jobs.
Find out how your community may be impacted.
Explore more at SCIMaP: scienceimpacts.org
a 🧵
Find out how your community may be impacted.
Explore more at SCIMaP: scienceimpacts.org
a 🧵
March 28, 2025 at 2:15 AM
Working with an interdisciplinary team, we have developed a website to communicate how the White House's proposed cuts to health research would cause losses of $16B and 68,500 jobs.
Find out how your community may be impacted.
Explore more at SCIMaP: scienceimpacts.org
a 🧵
Find out how your community may be impacted.
Explore more at SCIMaP: scienceimpacts.org
a 🧵
Reposted by Cong Yin
WMO State of the Climate report (spoiler alert: it’s not great).
@hausfath.bsky.social and I have a short article in it looking at the contributions to the temperatures in 2023+2024.
wmo.int/sites/defaul...
@hausfath.bsky.social and I have a short article in it looking at the contributions to the temperatures in 2023+2024.
wmo.int/sites/defaul...
wmo.int
March 19, 2025 at 12:01 PM
WMO State of the Climate report (spoiler alert: it’s not great).
@hausfath.bsky.social and I have a short article in it looking at the contributions to the temperatures in 2023+2024.
wmo.int/sites/defaul...
@hausfath.bsky.social and I have a short article in it looking at the contributions to the temperatures in 2023+2024.
wmo.int/sites/defaul...
Reposted by Cong Yin

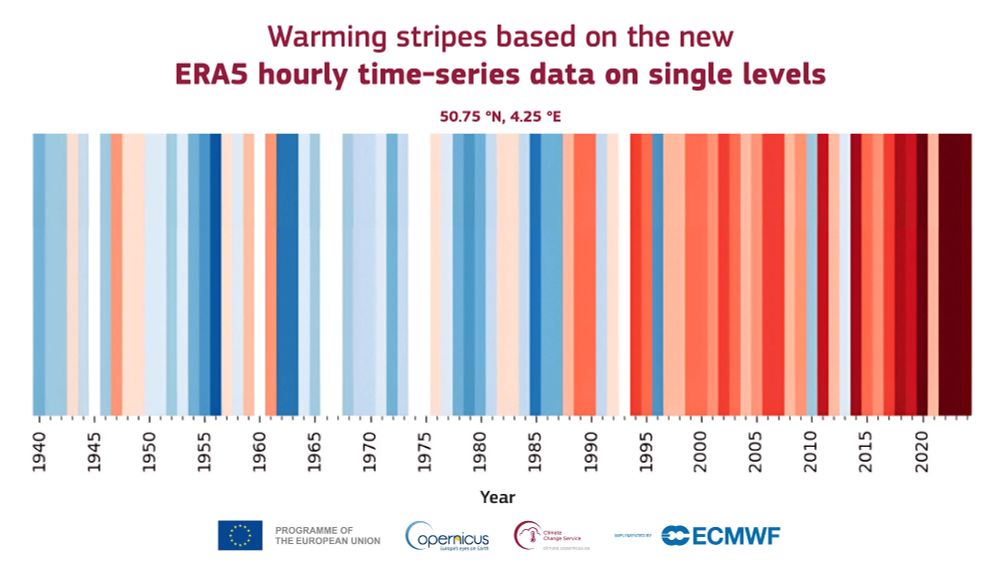
Out now! Available in the #C3S data store: ERA5 hourly time-series data on single levels from 1940 to present. As a regridded subset of the full #ERA5 dataset on native resolution, it is designed for retrieving long time-series for a single point.
👉 cds.climate.copernicus.eu/datasets/rea...
👉 cds.climate.copernicus.eu/datasets/rea...
March 19, 2025 at 8:57 AM
Out now! Available in the #C3S data store: ERA5 hourly time-series data on single levels from 1940 to present. As a regridded subset of the full #ERA5 dataset on native resolution, it is designed for retrieving long time-series for a single point.
👉 cds.climate.copernicus.eu/datasets/rea...
👉 cds.climate.copernicus.eu/datasets/rea...
Reposted by Cong Yin
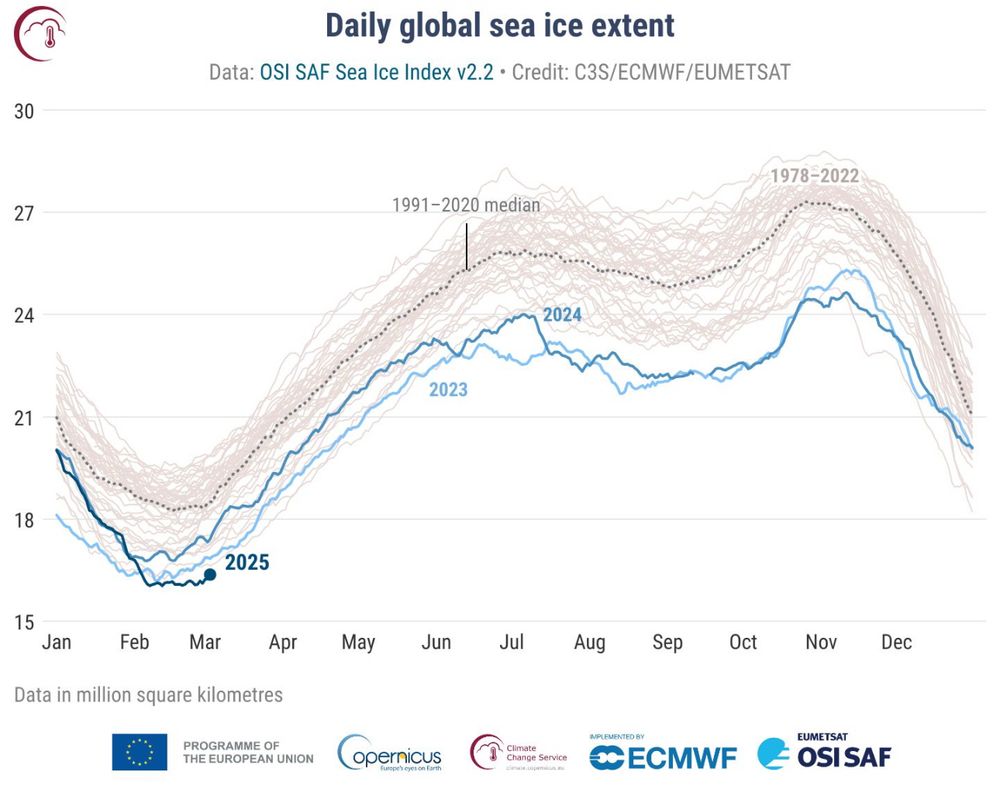
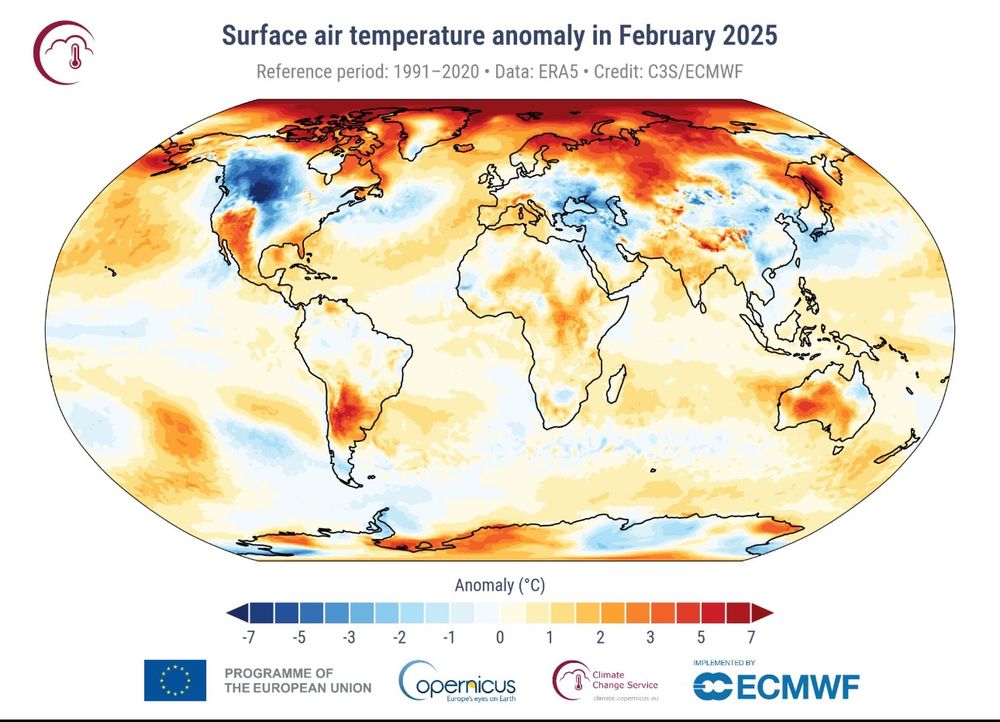
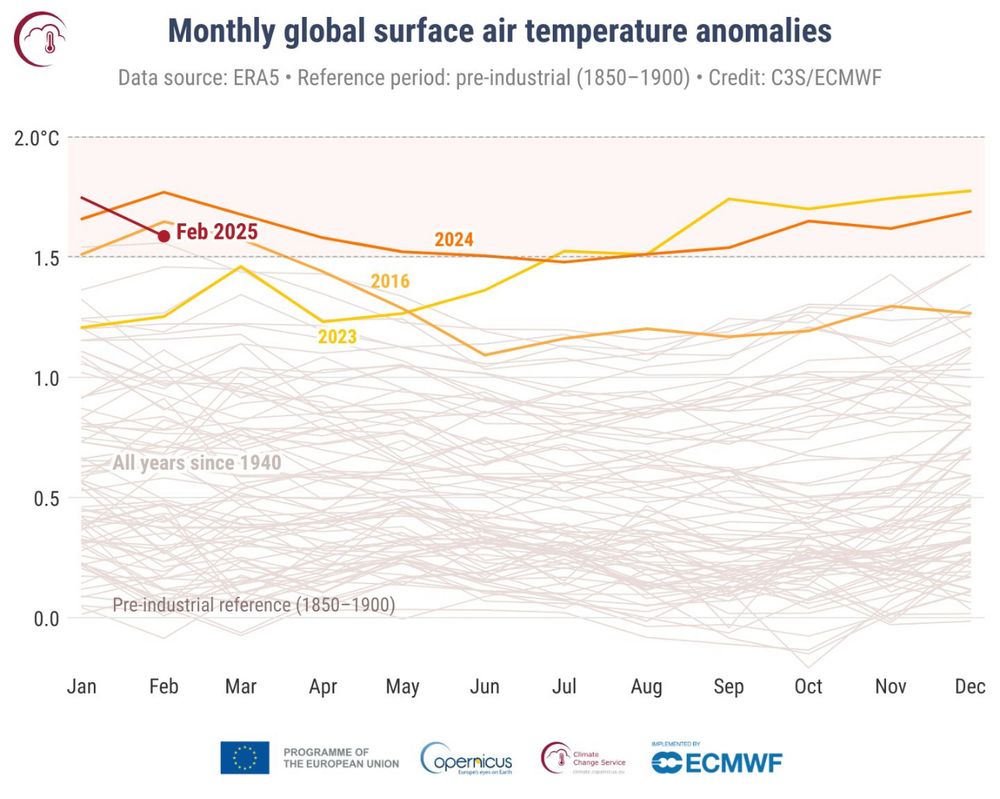
Latest @copernicusecmwf.bsky.social data shows
One of the consequences of a warmer world is melting sea ice.
📉 Daily global sea ice extent reached a new all-time minimum
🌡️ February 2025 was 3rd warmest February globally, 1.59°C above the 1850-1900 average
🌍🛰️🌡️⚒️🧪🌊 #ClimateAction
One of the consequences of a warmer world is melting sea ice.
📉 Daily global sea ice extent reached a new all-time minimum
🌡️ February 2025 was 3rd warmest February globally, 1.59°C above the 1850-1900 average
🌍🛰️🌡️⚒️🧪🌊 #ClimateAction
March 6, 2025 at 8:18 AM
Latest @copernicusecmwf.bsky.social data shows
One of the consequences of a warmer world is melting sea ice.
📉 Daily global sea ice extent reached a new all-time minimum
🌡️ February 2025 was 3rd warmest February globally, 1.59°C above the 1850-1900 average
🌍🛰️🌡️⚒️🧪🌊 #ClimateAction
One of the consequences of a warmer world is melting sea ice.
📉 Daily global sea ice extent reached a new all-time minimum
🌡️ February 2025 was 3rd warmest February globally, 1.59°C above the 1850-1900 average
🌍🛰️🌡️⚒️🧪🌊 #ClimateAction
Reposted by Cong Yin
New paper out led by @congyin.bsky.social providing a comprehensive toolbox for the standardised quantification and visualisation of various compound event types.
@iiasa.ac.at @columbiaclimate.bsky.social @lamontearth.bsky.social
@iiasa.ac.at @columbiaclimate.bsky.social @lamontearth.bsky.social
An integrated, interactive, and extensible platform for detecting and visualizing compound events. Our new paper in Scientific Data is now available: doi.org/10.1038/s415....
Thanks to my coauthors Mingfang Ting, @kornhuber.bsky.social, Radley M. Horton, Yaping Yang, and Yelin Jiang!
Thanks to my coauthors Mingfang Ting, @kornhuber.bsky.social, Radley M. Horton, Yaping Yang, and Yelin Jiang!

CETD, a global compound events detection and visualisation toolbox and dataset - Scientific Data
Scientific Data - CETD, a global compound events detection and visualisation toolbox and dataset
doi.org
March 3, 2025 at 9:26 PM
New paper out led by @congyin.bsky.social providing a comprehensive toolbox for the standardised quantification and visualisation of various compound event types.
@iiasa.ac.at @columbiaclimate.bsky.social @lamontearth.bsky.social
@iiasa.ac.at @columbiaclimate.bsky.social @lamontearth.bsky.social
An integrated, interactive, and extensible platform for detecting and visualizing compound events. Our new paper in Scientific Data is now available: doi.org/10.1038/s415....
Thanks to my coauthors Mingfang Ting, @kornhuber.bsky.social, Radley M. Horton, Yaping Yang, and Yelin Jiang!
Thanks to my coauthors Mingfang Ting, @kornhuber.bsky.social, Radley M. Horton, Yaping Yang, and Yelin Jiang!
CETD, a global compound events detection and visualisation toolbox and dataset - Scientific Data
Scientific Data - CETD, a global compound events detection and visualisation toolbox and dataset
doi.org
March 3, 2025 at 6:04 PM
An integrated, interactive, and extensible platform for detecting and visualizing compound events. Our new paper in Scientific Data is now available: doi.org/10.1038/s415....
Thanks to my coauthors Mingfang Ting, @kornhuber.bsky.social, Radley M. Horton, Yaping Yang, and Yelin Jiang!
Thanks to my coauthors Mingfang Ting, @kornhuber.bsky.social, Radley M. Horton, Yaping Yang, and Yelin Jiang!