


Copernicus ECMWF
@copernicusecmwf.bsky.social
The #CopernicusClimate Change Service (#C3S) & #CopernicusAtmosphere Monitoring Service (CAMS), implemented by @ecmwf.int on behalf of the European Commission.
🌡️ October 2025 was the third-warmest October on record, with 2025 set to be among the top 3 warmest years ever recorded. For the first time, the global average temperature for three consecutive years (2023-2025) could exceed 1.5°C.
#CopernicusClimate
#CopernicusClimate

November 10, 2025 at 4:16 PM
🌡️ October 2025 was the third-warmest October on record, with 2025 set to be among the top 3 warmest years ever recorded. For the first time, the global average temperature for three consecutive years (2023-2025) could exceed 1.5°C.
#CopernicusClimate
#CopernicusClimate
🧵
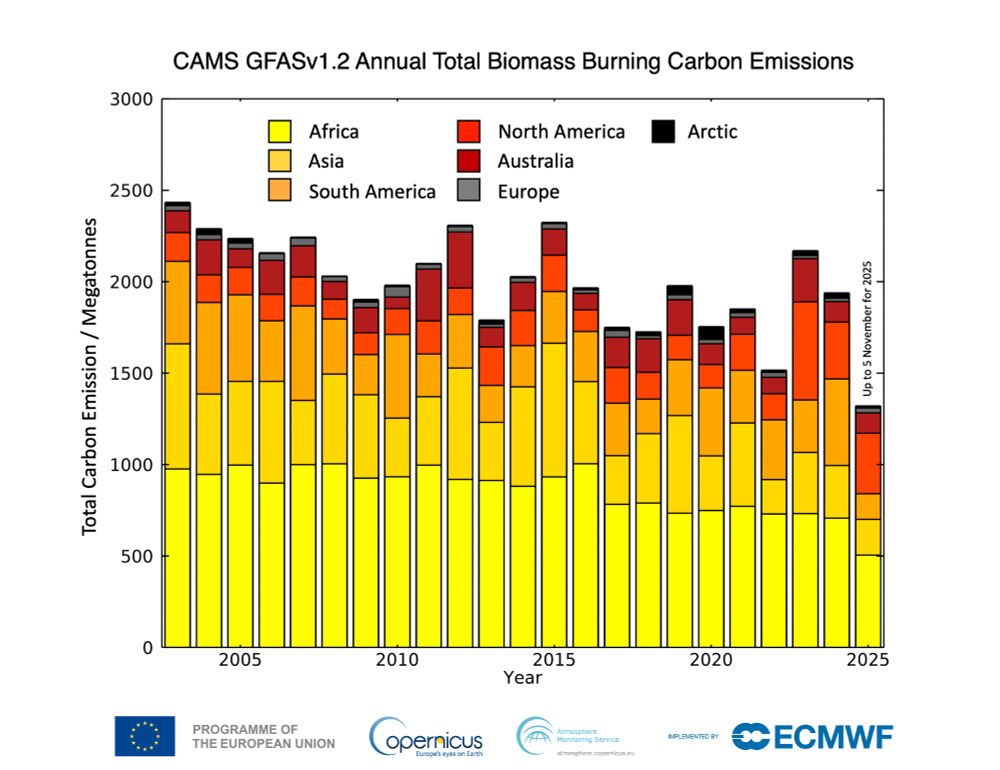
Global annual total estimated emissions of total carbon from biomass burning grouped by continental contributions from 2003 to 2025.
Global annual total estimated emissions of total carbon from biomass burning grouped by continental contributions from 2003 to 2025.
November 10, 2025 at 2:48 PM
🧵
Global annual total estimated emissions of total carbon from biomass burning grouped by continental contributions from 2003 to 2025.
Global annual total estimated emissions of total carbon from biomass burning grouped by continental contributions from 2003 to 2025.
🧵
Greenhouse gases are on a steady rise and saw their highest annual levels ever recorded in the atmosphere in 2024.
Greenhouse gases are on a steady rise and saw their highest annual levels ever recorded in the atmosphere in 2024.

November 10, 2025 at 2:47 PM
🧵
Greenhouse gases are on a steady rise and saw their highest annual levels ever recorded in the atmosphere in 2024.
Greenhouse gases are on a steady rise and saw their highest annual levels ever recorded in the atmosphere in 2024.
🧵
C3S data shows that every year since the Paris Agreement has ranked among the 10 warmest on record.
C3S data shows that every year since the Paris Agreement has ranked among the 10 warmest on record.

November 10, 2025 at 2:46 PM
🧵
C3S data shows that every year since the Paris Agreement has ranked among the 10 warmest on record.
C3S data shows that every year since the Paris Agreement has ranked among the 10 warmest on record.
A decade since the Paris Agreement, #COP30 opens amid record heat and rising greenhouse gases. @frabier.bsky.social , @ecmwf.int Director General, will highlight the value of strengthening global observing systems to improve #ClimateData, shaping decisions for our future.
⬇️
⬇️

November 10, 2025 at 10:04 AM
A decade since the Paris Agreement, #COP30 opens amid record heat and rising greenhouse gases. @frabier.bsky.social , @ecmwf.int Director General, will highlight the value of strengthening global observing systems to improve #ClimateData, shaping decisions for our future.
⬇️
⬇️
💧October 2025: Wetter-than-average in southeastern Europe, especially the Balkans, with above-average rainfall in parts of Scandinavia, France, Ireland and eastern Spain. Drier-than-average across most of Iberia, northern Italy, Iceland and northeastern Europe.
⬇️
⬇️
November 7, 2025 at 11:37 AM
💧October 2025: Wetter-than-average in southeastern Europe, especially the Balkans, with above-average rainfall in parts of Scandinavia, France, Ireland and eastern Spain. Drier-than-average across most of Iberia, northern Italy, Iceland and northeastern Europe.
⬇️
⬇️
❄ October 2025: Arctic sea ice extent ranked eighth-lowest for October in the 47-year satellite record at 12% below average, with especially low concentrations in the Eurasian sector. Antarctic extent was the third-lowest for October, 6% below average.
November 7, 2025 at 9:25 AM
❄ October 2025: Arctic sea ice extent ranked eighth-lowest for October in the 47-year satellite record at 12% below average, with especially low concentrations in the Eurasian sector. Antarctic extent was the third-lowest for October, 6% below average.
🌡️ 2025 on track to be among top three warmest years. The #C3S Climate Bulletin reports that October was 1.55°C above pre-industrial levels, making it the third-warmest October on record and the first monthly average above 1.5°C since April.
Explore the insights👉 climate.copernicus.eu/surface-air-...
Explore the insights👉 climate.copernicus.eu/surface-air-...
November 7, 2025 at 8:09 AM
🌡️ 2025 on track to be among top three warmest years. The #C3S Climate Bulletin reports that October was 1.55°C above pre-industrial levels, making it the third-warmest October on record and the first monthly average above 1.5°C since April.
Explore the insights👉 climate.copernicus.eu/surface-air-...
Explore the insights👉 climate.copernicus.eu/surface-air-...
New dataset: sea ice drift, tracked daily. Discover daily gridded data from satellite sensors showing how Arctic and Antarctic ice moves. Essential for tracking climate change impacts.
Access the new dataset: cds.climate.copernicus.eu/datasets/sat...
⬇️
Access the new dataset: cds.climate.copernicus.eu/datasets/sat...
⬇️

November 6, 2025 at 10:22 AM
New dataset: sea ice drift, tracked daily. Discover daily gridded data from satellite sensors showing how Arctic and Antarctic ice moves. Essential for tracking climate change impacts.
Access the new dataset: cds.climate.copernicus.eu/datasets/sat...
⬇️
Access the new dataset: cds.climate.copernicus.eu/datasets/sat...
⬇️
Have you explored our #CopernicusAtmosphere Methane Hotspot Explorer? Track methane hotspots and plumes, including emission rates, dates and locations and download the data.
Discover the app: apps.atmosphere.copernicus.eu/methane-expl...
Discover the app: apps.atmosphere.copernicus.eu/methane-expl...

November 5, 2025 at 10:52 AM
Have you explored our #CopernicusAtmosphere Methane Hotspot Explorer? Track methane hotspots and plumes, including emission rates, dates and locations and download the data.
Discover the app: apps.atmosphere.copernicus.eu/methane-expl...
Discover the app: apps.atmosphere.copernicus.eu/methane-expl...
How does the #cryosphere shape our climate, and how do we track its changes? Dr. Erik Loebel from #C3S shares a first-hand account on monitoring glaciers, ice sheets, sea ice and permafrost, and why it matters.
Read more: climate.copernicus.eu/c3s-behind-s...
Read more: climate.copernicus.eu/c3s-behind-s...

November 4, 2025 at 4:28 PM
How does the #cryosphere shape our climate, and how do we track its changes? Dr. Erik Loebel from #C3S shares a first-hand account on monitoring glaciers, ice sheets, sea ice and permafrost, and why it matters.
Read more: climate.copernicus.eu/c3s-behind-s...
Read more: climate.copernicus.eu/c3s-behind-s...
Exposure to thermal stress – whether from extreme heat or cold – poses risks to our health. The Thermal Trace app from #C3S helps everyone stay informed. Just select a date and location on the map, choose a variable & visualise or even download charts & data.
⬇️
⬇️
November 3, 2025 at 1:12 PM
Exposure to thermal stress – whether from extreme heat or cold – poses risks to our health. The Thermal Trace app from #C3S helps everyone stay informed. Just select a date and location on the map, choose a variable & visualise or even download charts & data.
⬇️
⬇️
💡 ECMWF invites tenders to enhance the #C3S Energy Service. Lot 1: Co-develop online seasonal demonstrators and tools with champion energy users; Lot 2: maintenance of operational services for the energy sector. Tenders for one or both Lots accepted. Deadline: 18/12/2025.
⬇️
⬇️

November 3, 2025 at 9:47 AM
💡 ECMWF invites tenders to enhance the #C3S Energy Service. Lot 1: Co-develop online seasonal demonstrators and tools with champion energy users; Lot 2: maintenance of operational services for the energy sector. Tenders for one or both Lots accepted. Deadline: 18/12/2025.
⬇️
⬇️
📈 #Arctic sea ice extent reached its annual minimum - #C3S
3️⃣https://bsky.app/profile/copernicusecmwf.bsky.social/post/3m46dzd26d22o
Read the article: climate.copernicus.eu/global-surfa...
3️⃣https://bsky.app/profile/copernicusecmwf.bsky.social/post/3m46dzd26d22o
Read the article: climate.copernicus.eu/global-surfa...

October 31, 2025 at 2:11 PM
📈 #Arctic sea ice extent reached its annual minimum - #C3S
3️⃣https://bsky.app/profile/copernicusecmwf.bsky.social/post/3m46dzd26d22o
Read the article: climate.copernicus.eu/global-surfa...
3️⃣https://bsky.app/profile/copernicusecmwf.bsky.social/post/3m46dzd26d22o
Read the article: climate.copernicus.eu/global-surfa...
📈 Sea surface temperature for 21 Oct. 2025 – @michaelemann.bsky.social /C3S Climate Pulse app
2️⃣https://bsky.app/profile/michaelemann.bsky.social/post/3m3wu633y5c2x
Explore the C3S Climate Pulse: pulse.climate.copernicus.eu
2️⃣https://bsky.app/profile/michaelemann.bsky.social/post/3m3wu633y5c2x
Explore the C3S Climate Pulse: pulse.climate.copernicus.eu

October 31, 2025 at 2:11 PM
📈 Sea surface temperature for 21 Oct. 2025 – @michaelemann.bsky.social /C3S Climate Pulse app
2️⃣https://bsky.app/profile/michaelemann.bsky.social/post/3m3wu633y5c2x
Explore the C3S Climate Pulse: pulse.climate.copernicus.eu
2️⃣https://bsky.app/profile/michaelemann.bsky.social/post/3m3wu633y5c2x
Explore the C3S Climate Pulse: pulse.climate.copernicus.eu
Three charts based on #CopernicusClimate data you shouldn’t miss this month:
📈 Climate warming stripes for global temperature in Sept. – @climatologist49.bsky.social
1️⃣ bsky.app/profile/clim...
📈 Climate warming stripes for global temperature in Sept. – @climatologist49.bsky.social
1️⃣ bsky.app/profile/clim...


October 31, 2025 at 2:10 PM
Three charts based on #CopernicusClimate data you shouldn’t miss this month:
📈 Climate warming stripes for global temperature in Sept. – @climatologist49.bsky.social
1️⃣ bsky.app/profile/clim...
📈 Climate warming stripes for global temperature in Sept. – @climatologist49.bsky.social
1️⃣ bsky.app/profile/clim...
🌍 It’s #WorldCitiesDay! The health of our cities depends on the quality of the air we breathe. Join us at the 5th EU Clean Air Forum (1–2 Dec, Bonn) co-hosted by @ecmwf.int & the @ec.europa.eu to discuss solutions for cleaner air & resilient urban environments.

October 31, 2025 at 1:21 PM
🌍 It’s #WorldCitiesDay! The health of our cities depends on the quality of the air we breathe. Join us at the 5th EU Clean Air Forum (1–2 Dec, Bonn) co-hosted by @ecmwf.int & the @ec.europa.eu to discuss solutions for cleaner air & resilient urban environments.
New in the Climate Data Store (CDS): the ERA5-Drought dataset, with monthly meteorological drought indicators across accumulation windows from 1, 3, 6, 12, 24, 36 & 48 months from 1940 to today. Supports both deterministic & ensemble products on a 0.25° grid.
More info ⬇️
More info ⬇️

October 31, 2025 at 9:42 AM
New in the Climate Data Store (CDS): the ERA5-Drought dataset, with monthly meteorological drought indicators across accumulation windows from 1, 3, 6, 12, 24, 36 & 48 months from 1940 to today. Supports both deterministic & ensemble products on a 0.25° grid.
More info ⬇️
More info ⬇️
🎥 Laurence Rouil, Director of CAMS, highlights key milestones and next steps for #CopernicusAtmosphere. From near real-time methane tracking to space-based and AI-powered forecasts, CAMS is advancing air quality insights for Europe and beyond.
⬇️
⬇️
October 30, 2025 at 3:42 PM
🎥 Laurence Rouil, Director of CAMS, highlights key milestones and next steps for #CopernicusAtmosphere. From near real-time methane tracking to space-based and AI-powered forecasts, CAMS is advancing air quality insights for Europe and beyond.
⬇️
⬇️
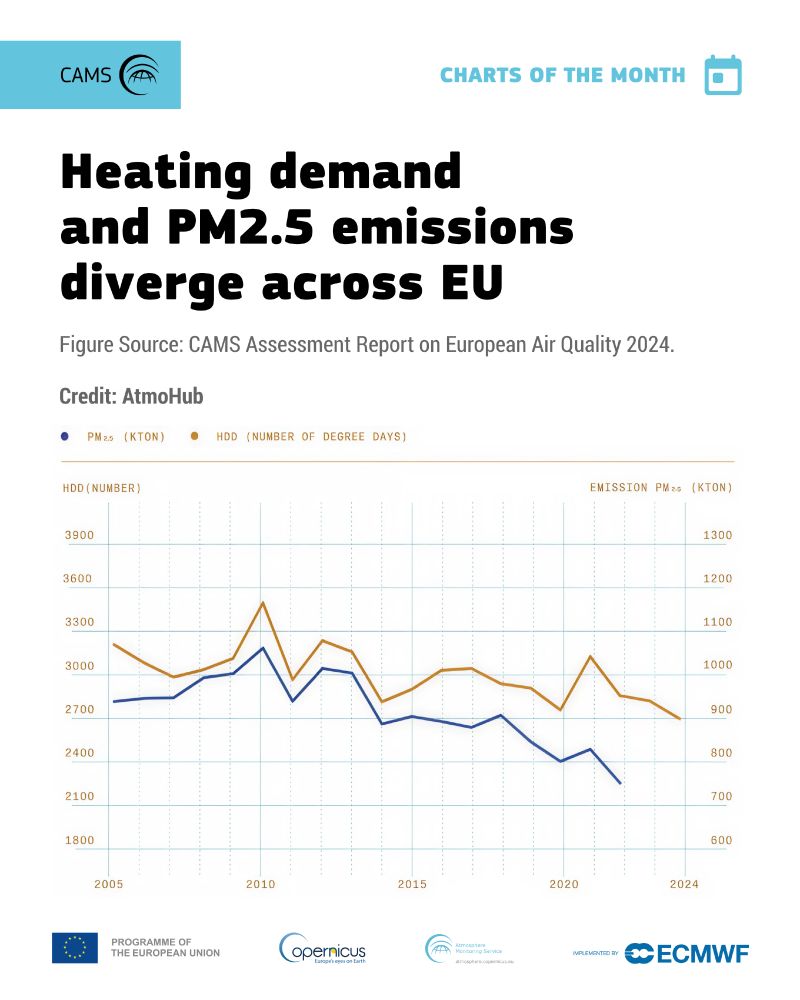
📉 Average number of Heating Degree Days (EU Member States) and trend in annual PM2.5 emissions – CAMS via AtmoHub
3️⃣ www.linkedin.com/posts/atmohu...
Read the report: atmosphere.copernicus.eu/sites/defaul...
3️⃣ www.linkedin.com/posts/atmohu...
Read the report: atmosphere.copernicus.eu/sites/defaul...

October 30, 2025 at 1:38 PM
📉 Average number of Heating Degree Days (EU Member States) and trend in annual PM2.5 emissions – CAMS via AtmoHub
3️⃣ www.linkedin.com/posts/atmohu...
Read the report: atmosphere.copernicus.eu/sites/defaul...
3️⃣ www.linkedin.com/posts/atmohu...
Read the report: atmosphere.copernicus.eu/sites/defaul...
📉 Global #wildfires emissions for September 2025 reveal seasonal tropical fires, fires in Canada & Iberian Peninsula – @mparrington.bsky.social
2️⃣ bsky.app/profile/mpar...
2️⃣ bsky.app/profile/mpar...
October 30, 2025 at 1:37 PM
📉 Global #wildfires emissions for September 2025 reveal seasonal tropical fires, fires in Canada & Iberian Peninsula – @mparrington.bsky.social
2️⃣ bsky.app/profile/mpar...
2️⃣ bsky.app/profile/mpar...
📉 Fires in Portugal and Spain during August leading to high surface concentrations of PM 2.5 - CAMS
Sources:
1️⃣ bsky.app/profile/cope...
Read the article: www.copernicus.eu/en/news/news...
Sources:
1️⃣ bsky.app/profile/cope...
Read the article: www.copernicus.eu/en/news/news...


October 30, 2025 at 1:37 PM
📉 Fires in Portugal and Spain during August leading to high surface concentrations of PM 2.5 - CAMS
Sources:
1️⃣ bsky.app/profile/cope...
Read the article: www.copernicus.eu/en/news/news...
Sources:
1️⃣ bsky.app/profile/cope...
Read the article: www.copernicus.eu/en/news/news...
📢 Call for tenders! Advance the #CopernicusAtmosphere system for tracking greenhouse gases. Improve land surface processes, including near real-time updates of vegetation (Leaf Area Index) and wetland area, enhancing (CO₂) and methane (CH₄) modelling.
Deadline: 15/01/2026
Deadline: 15/01/2026

October 29, 2025 at 9:29 AM
📢 Call for tenders! Advance the #CopernicusAtmosphere system for tracking greenhouse gases. Improve land surface processes, including near real-time updates of vegetation (Leaf Area Index) and wetland area, enhancing (CO₂) and methane (CH₄) modelling.
Deadline: 15/01/2026
Deadline: 15/01/2026

Arctic sea ice extent reached its annual minimum on 7 September 2025 at 5.07 million km² – the 14th lowest in the satellite record. Let's take a look at the past 12 months: 🧵
⬇️
⬇️

October 27, 2025 at 11:49 AM
Arctic sea ice extent reached its annual minimum on 7 September 2025 at 5.07 million km² – the 14th lowest in the satellite record. Let's take a look at the past 12 months: 🧵
⬇️
⬇️