


Constantin Ahlmann-Eltze
@const-ae.bsky.social
Postdoc at UCL with James Reading. Previously at EMBL working with Wolfgang Huber. Biostats, R, cancer immunology
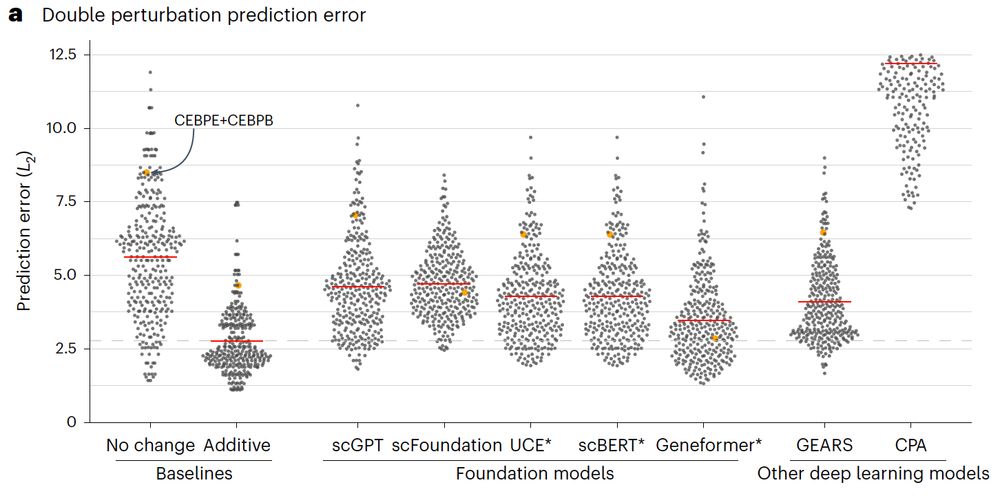
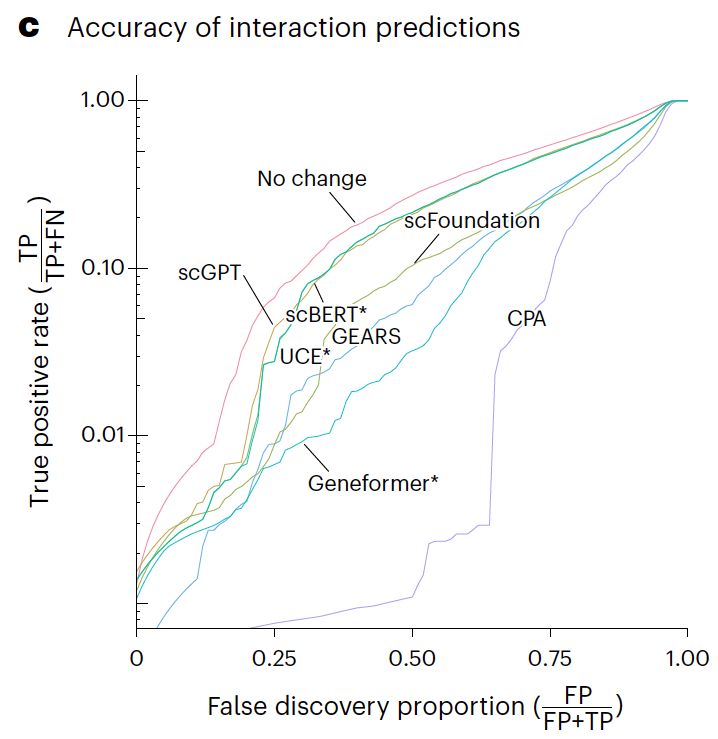
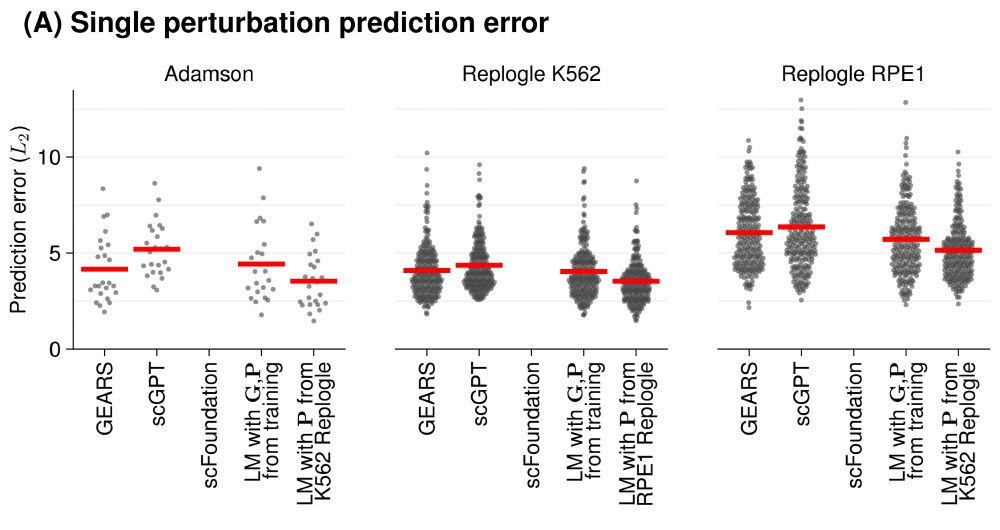
Our paper benchmarking foundation models for perturbation effect prediction is finally published 🎉🥳🎉
www.nature.com/articles/s41...
We show that none of the available* models outperform simple linear baselines. Since the original preprint, we added more methods, metrics, and prettier figures!
🧵
www.nature.com/articles/s41...
We show that none of the available* models outperform simple linear baselines. Since the original preprint, we added more methods, metrics, and prettier figures!
🧵
August 4, 2025 at 1:52 PM
Our paper benchmarking foundation models for perturbation effect prediction is finally published 🎉🥳🎉
www.nature.com/articles/s41...
We show that none of the available* models outperform simple linear baselines. Since the original preprint, we added more methods, metrics, and prettier figures!
🧵
www.nature.com/articles/s41...
We show that none of the available* models outperform simple linear baselines. Since the original preprint, we added more methods, metrics, and prettier figures!
🧵
I have found a solution that works by squashing the quasi-quotation and explicitly setting the environment.
I still wonder if there is a better solution or if someone (maybe @lionelhenry.bsky.social? 😅) would have to write a `quo_squash` function that retains the environments. :)
#Rstats
I still wonder if there is a better solution or if someone (maybe @lionelhenry.bsky.social? 😅) would have to write a `quo_squash` function that retains the environments. :)
#Rstats
![wrap_in_tibble <- function(...){
dots <- rlang::enquos(...)
# Let's assume I can be sure that the environment is the same across dots
eval_in_mtcars(tibble::tibble(!!! dots), env = rlang::quo_get_env(dots[[1]]))
}
eval_in_mtcars <- function(expr, env){
quo <- rlang::enquo(expr)
quo <- rlang::new_quosure(rlang::quo_squash(quo), env)
rlang::eval_tidy(quo, data = mtcars[1:3,])
}
wrap_in_tibble(mpg * 3)
#> # A tibble: 3 × 1
#> `mpg * 3`
#> <dbl>
#> 1 63
#> 2 63
#> 3 68.4](https://cdn.bsky.app/img/feed_thumbnail/plain/did:plc:pa4xdweapw6gnh42xqptt6vb/bafkreiedsb67npdkhwoxx3u5ceu5rfpbktvwe5dbuwqxpuledeqb43fhyu@jpeg)
February 19, 2025 at 3:57 PM
I have found a solution that works by squashing the quasi-quotation and explicitly setting the environment.
I still wonder if there is a better solution or if someone (maybe @lionelhenry.bsky.social? 😅) would have to write a `quo_squash` function that retains the environments. :)
#Rstats
I still wonder if there is a better solution or if someone (maybe @lionelhenry.bsky.social? 😅) would have to write a `quo_squash` function that retains the environments. :)
#Rstats
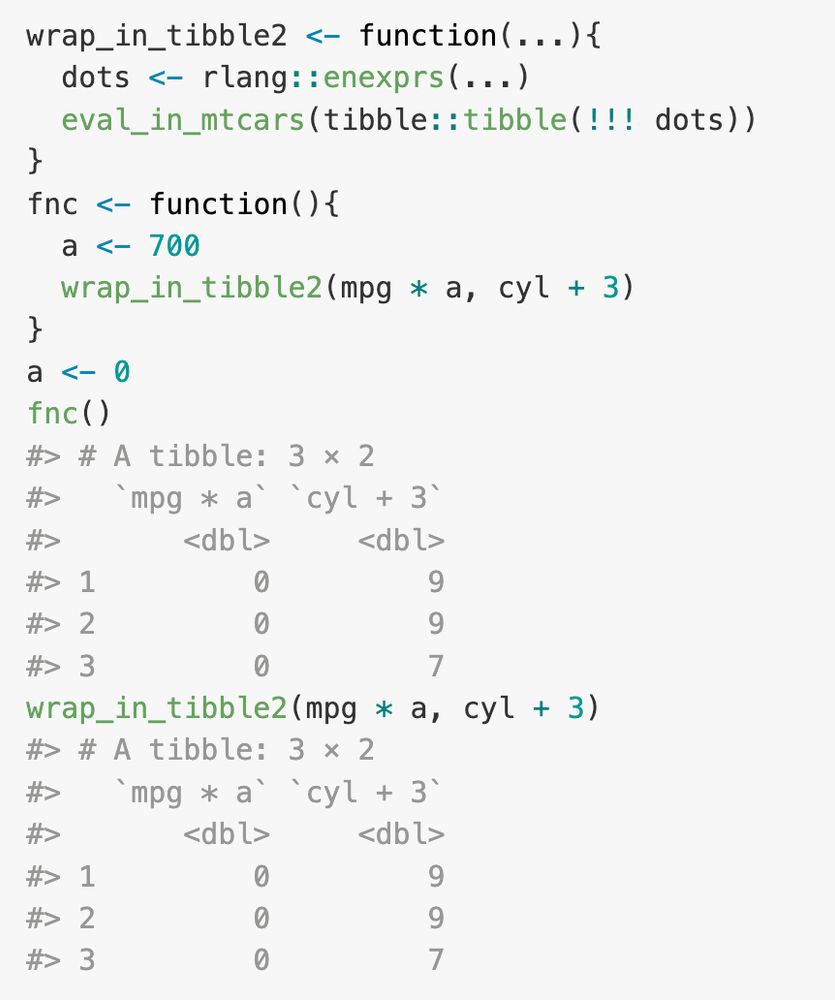
In this example `enexprs()` would work, but it breaks if I call `wrap_in_tibble` from a function. (When calling fnc(), it should evaluate the quasi-quotation with a=700.)
February 19, 2025 at 9:41 AM
In this example `enexprs()` would work, but it breaks if I call `wrap_in_tibble` from a function. (When calling fnc(), it should evaluate the quasi-quotation with a=700.)
Is there some clever syntax to control when a quasi-quotation is evaluated so that the wrap_in_tibble function works? 🧐
(Context in stackoverflow.com/questions/79...)
#Rstats #rlang
(Context in stackoverflow.com/questions/79...)
#Rstats #rlang
![wrap_in_df <- function(...){
dots <- rlang::enquos(...)
eval_in_mtcars(data.frame(!!! dots))
}
wrap_in_tibble <- function(...){
dots <- rlang::enquos(...)
eval_in_mtcars(tibble::tibble(!!! dots))
}
eval_in_mtcars <- function(expr){
quo <- rlang::enquo(expr)
rlang::eval_tidy(quo, data = mtcars[1:3,])
}
wrap_in_df(mpg * 2, cyl + 3)
#> X.mpg...2 X.cyl...3
#> 1 42.0 9
#> 2 42.0 9
#> 3 45.6 7
wrap_in_tibble(mpg * 2, cyl + 3)
#> Error: object 'mpg' not found](https://cdn.bsky.app/img/feed_thumbnail/plain/did:plc:pa4xdweapw6gnh42xqptt6vb/bafkreihxqsxhceomx7l4lv6g5zk5ocw4vy7mlpyxf7fg5qssa5gnvjbe4q@jpeg)
February 19, 2025 at 9:17 AM
Is there some clever syntax to control when a quasi-quotation is evaluated so that the wrap_in_tibble function works? 🧐
(Context in stackoverflow.com/questions/79...)
#Rstats #rlang
(Context in stackoverflow.com/questions/79...)
#Rstats #rlang
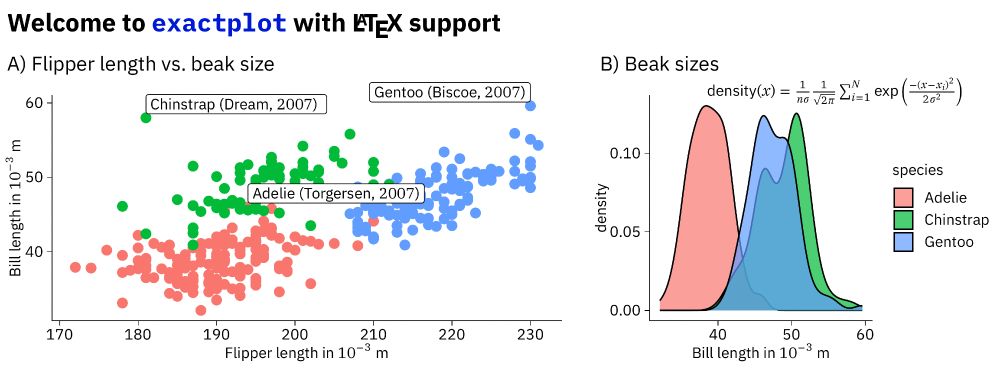
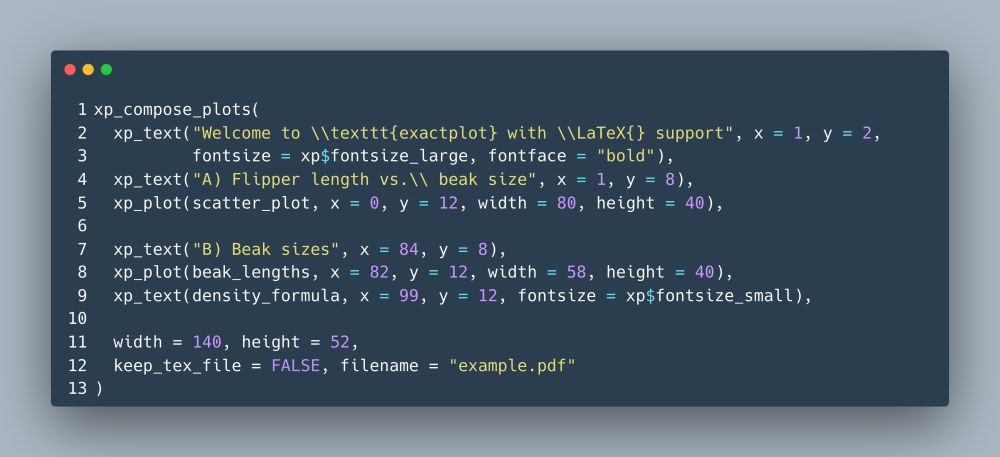
I just uploaded the first version of {{exactplot}} to github.com/const-ae/exa... 🎉
It produces figures with consistent font size, Latex labels, and millimeter-perfect layouting. It's an alternative to patchwork with less elegant syntax but much more flexibility.
#rstats
It produces figures with consistent font size, Latex labels, and millimeter-perfect layouting. It's an alternative to patchwork with less elegant syntax but much more flexibility.
#rstats
February 12, 2025 at 11:40 AM
I just uploaded the first version of {{exactplot}} to github.com/const-ae/exa... 🎉
It produces figures with consistent font size, Latex labels, and millimeter-perfect layouting. It's an alternative to patchwork with less elegant syntax but much more flexibility.
#rstats
It produces figures with consistent font size, Latex labels, and millimeter-perfect layouting. It's an alternative to patchwork with less elegant syntax but much more flexibility.
#rstats
I compiled my workflow for producing pretty figures into a small package: github.com/const-ae/exa...
My trick is to use `tikzDevice` and do all the rendering with Luatex. I can position every panel and label with millimeter precision and still modify the output with Illustrator.
My trick is to use `tikzDevice` and do all the rendering with Luatex. I can position every panel and label with millimeter precision and still modify the output with Illustrator.
February 12, 2025 at 11:27 AM
I compiled my workflow for producing pretty figures into a small package: github.com/const-ae/exa...
My trick is to use `tikzDevice` and do all the rendering with Luatex. I can position every panel and label with millimeter precision and still modify the output with Illustrator.
My trick is to use `tikzDevice` and do all the rendering with Luatex. I can position every panel and label with millimeter precision and still modify the output with Illustrator.
Finally, we demonstrate LEMUR's usefulness on
- a treatment vs. ctrl dataset from glioblastoma,
- Zebrafish developmental time course, and
- a spatially resolved Alzheimer dataset
where we find intriguing DE patterns.
- a treatment vs. ctrl dataset from glioblastoma,
- Zebrafish developmental time course, and
- a spatially resolved Alzheimer dataset
where we find intriguing DE patterns.


January 3, 2025 at 7:25 PM
Finally, we demonstrate LEMUR's usefulness on
- a treatment vs. ctrl dataset from glioblastoma,
- Zebrafish developmental time course, and
- a spatially resolved Alzheimer dataset
where we find intriguing DE patterns.
- a treatment vs. ctrl dataset from glioblastoma,
- Zebrafish developmental time course, and
- a spatially resolved Alzheimer dataset
where we find intriguing DE patterns.
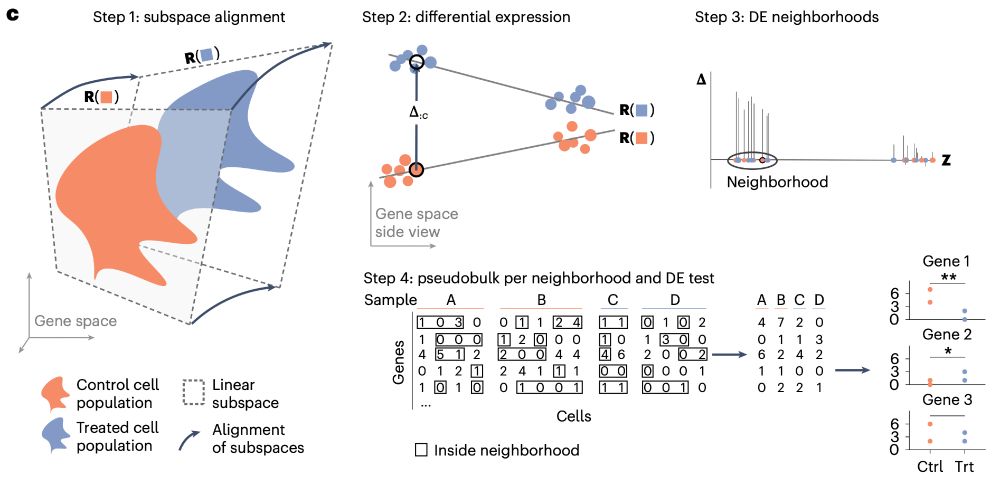
To solve this, we find for each gene the neighborhood of cells that are
- close together in cell-type space, and
- have maximal differential expression.
This aggregation improves DE detection as we can optimally adjust our "cluster" resolution for each gene.
- close together in cell-type space, and
- have maximal differential expression.
This aggregation improves DE detection as we can optimally adjust our "cluster" resolution for each gene.

January 3, 2025 at 7:25 PM
To solve this, we find for each gene the neighborhood of cells that are
- close together in cell-type space, and
- have maximal differential expression.
This aggregation improves DE detection as we can optimally adjust our "cluster" resolution for each gene.
- close together in cell-type space, and
- have maximal differential expression.
This aggregation improves DE detection as we can optimally adjust our "cluster" resolution for each gene.
But more intuitively, think of this approach as optimal transport where you match the __space__ occupied by cells instead of matching individual cells between conditions.
On top, this means you don't need to worry about abundance changes within cell types.
On top, this means you don't need to worry about abundance changes within cell types.

January 3, 2025 at 7:25 PM
But more intuitively, think of this approach as optimal transport where you match the __space__ occupied by cells instead of matching individual cells between conditions.
On top, this means you don't need to worry about abundance changes within cell types.
On top, this means you don't need to worry about abundance changes within cell types.
At its core, LEMUR is a matrix factorization with a _twist_! Instead of finding a single subspace R to approximate the data, I find one subspace per condition R(x).
Inspired by generalized linear models (GLMs), I implement this as solving a regression on subspaces.
Inspired by generalized linear models (GLMs), I implement this as solving a regression on subspaces.

January 3, 2025 at 7:25 PM
At its core, LEMUR is a matrix factorization with a _twist_! Instead of finding a single subspace R to approximate the data, I find one subspace per condition R(x).
Inspired by generalized linear models (GLMs), I implement this as solving a regression on subspaces.
Inspired by generalized linear models (GLMs), I implement this as solving a regression on subspaces.
LEMUR is directly useable for your next single-cell differential expression project!
R package: github.com/const-ae/lemur
Python package: pylemur.readthedocs.io/en/latest/
Code from the paper: github.com/const-ae/lem...
R package: github.com/const-ae/lemur
Python package: pylemur.readthedocs.io/en/latest/
Code from the paper: github.com/const-ae/lem...

January 3, 2025 at 7:25 PM
LEMUR is directly useable for your next single-cell differential expression project!
R package: github.com/const-ae/lemur
Python package: pylemur.readthedocs.io/en/latest/
Code from the paper: github.com/const-ae/lem...
R package: github.com/const-ae/lemur
Python package: pylemur.readthedocs.io/en/latest/
Code from the paper: github.com/const-ae/lem...
After 4y in the making, I am super excited that my main PhD project is published 🎉🥳🎉🎉🥳
www.nature.com/articles/s41...
LEMUR is a tool to analyze multi-condition single-cell data and model differential expression as a continuous function of the cell-state space.
Some highlights⬇️
www.nature.com/articles/s41...
LEMUR is a tool to analyze multi-condition single-cell data and model differential expression as a continuous function of the cell-state space.
Some highlights⬇️
January 3, 2025 at 7:25 PM
After 4y in the making, I am super excited that my main PhD project is published 🎉🥳🎉🎉🥳
www.nature.com/articles/s41...
LEMUR is a tool to analyze multi-condition single-cell data and model differential expression as a continuous function of the cell-state space.
Some highlights⬇️
www.nature.com/articles/s41...
LEMUR is a tool to analyze multi-condition single-cell data and model differential expression as a continuous function of the cell-state space.
Some highlights⬇️
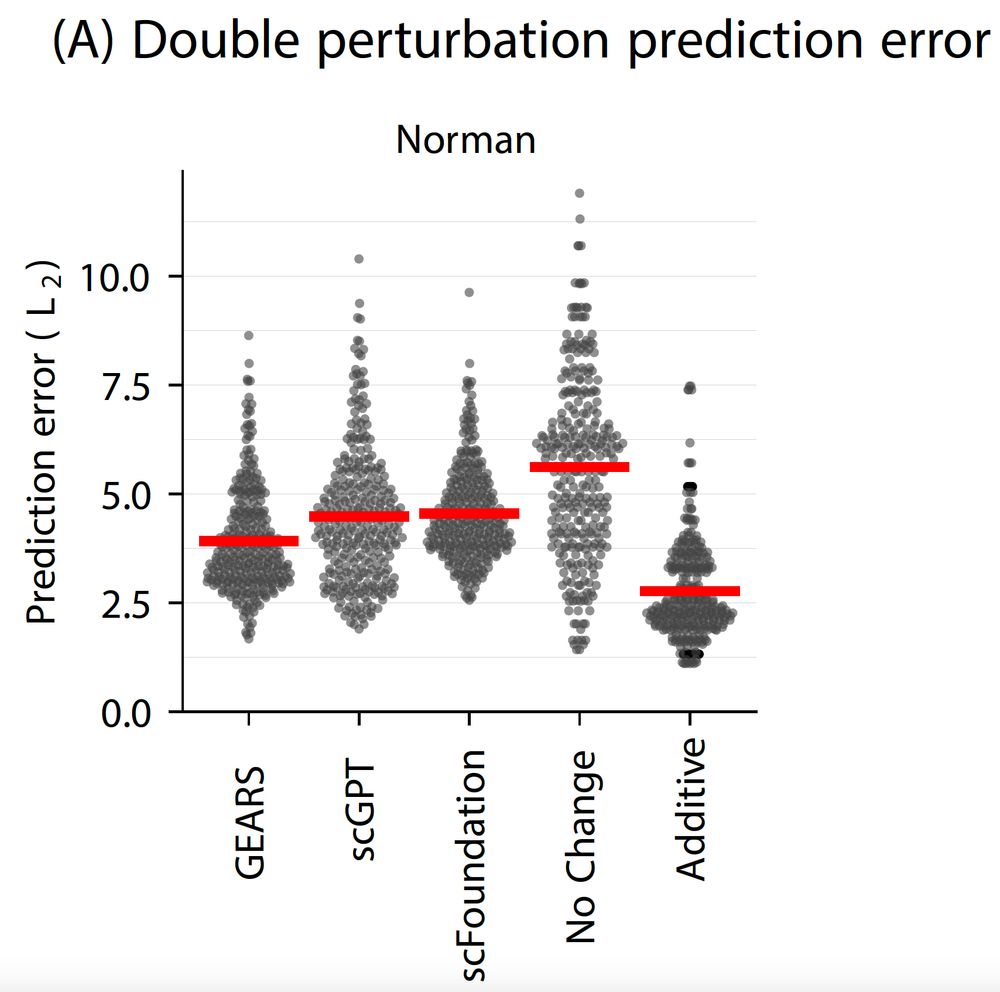
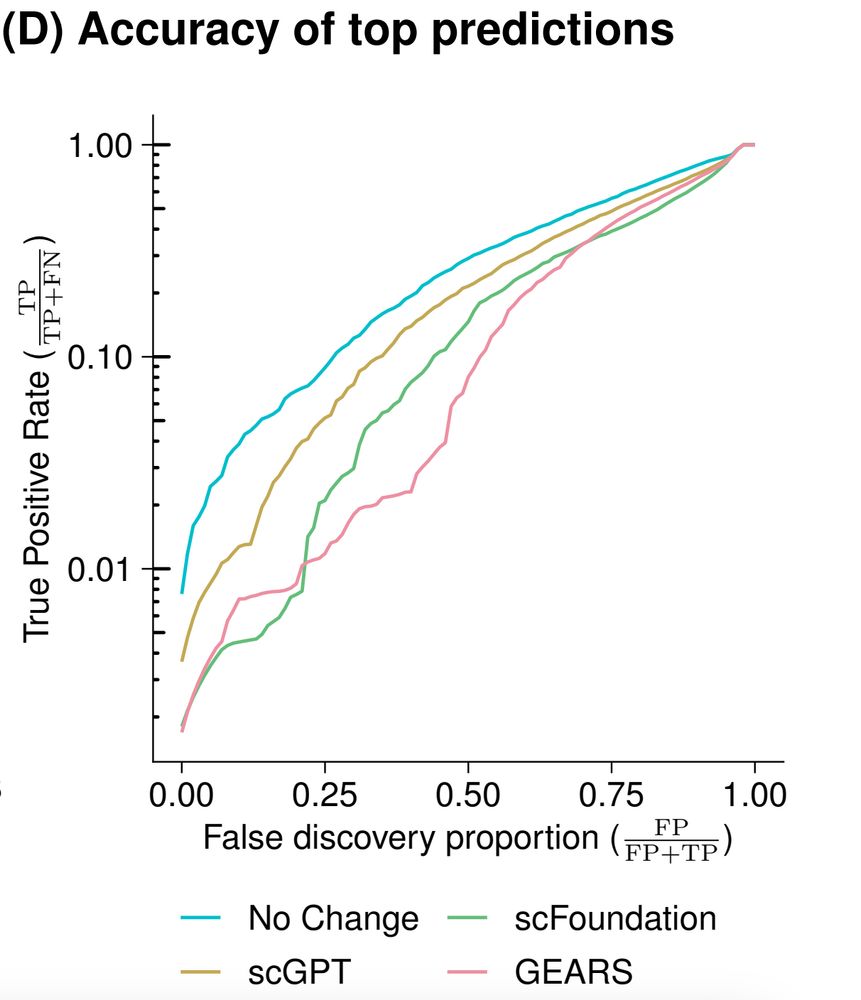
There's a lot of excitement about foundation models and their ability to learn biology 🧬💻
But current tools for perturbation prediction perform worse than simple linear models! We need more careful benchmarking to make progress.
www.biorxiv.org/content/10.1...
But current tools for perturbation prediction perform worse than simple linear models! We need more careful benchmarking to make progress.
www.biorxiv.org/content/10.1...
September 20, 2024 at 9:39 AM
There's a lot of excitement about foundation models and their ability to learn biology 🧬💻
But current tools for perturbation prediction perform worse than simple linear models! We need more careful benchmarking to make progress.
www.biorxiv.org/content/10.1...
But current tools for perturbation prediction perform worse than simple linear models! We need more careful benchmarking to make progress.
www.biorxiv.org/content/10.1...
Very excited to announce that I started a postdoc in James Reading's lab at UCL working on tumor immunology 🥳
So, if you are in London and want to meet for a coffee, hit me up :)
So, if you are in London and want to meet for a coffee, hit me up :)
September 19, 2024 at 6:53 PM
Very excited to announce that I started a postdoc in James Reading's lab at UCL working on tumor immunology 🥳
So, if you are in London and want to meet for a coffee, hit me up :)
So, if you are in London and want to meet for a coffee, hit me up :)
Over on mastodon, @teunbrand.bsky.social presented his new package {{gguidance}} to customize your legends and axis in #ggplot: fosstodon.org/@teunbrand/1...
Now you can, for example, easily distinguish groups of discrete labels without facetting!
#rstats
Now you can, for example, easily distinguish groups of discrete labels without facetting!
#rstats

September 12, 2024 at 8:02 AM
Over on mastodon, @teunbrand.bsky.social presented his new package {{gguidance}} to customize your legends and axis in #ggplot: fosstodon.org/@teunbrand/1...
Now you can, for example, easily distinguish groups of discrete labels without facetting!
#rstats
Now you can, for example, easily distinguish groups of discrete labels without facetting!
#rstats
I wrote a new ggplot2 extension to draw Bezier curves github.com/const-ae/ggb... 🎉
The curves are defined by a set of control points and the tangents at those points. This makes each parameter directly interpretable and easy to tweak!
#rstats #ggplot2
The curves are defined by a set of control points and the tangents at those points. This makes each parameter directly interpretable and easy to tweak!
#rstats #ggplot2

August 28, 2024 at 1:30 PM
I wrote a new ggplot2 extension to draw Bezier curves github.com/const-ae/ggb... 🎉
The curves are defined by a set of control points and the tangents at those points. This makes each parameter directly interpretable and easy to tweak!
#rstats #ggplot2
The curves are defined by a set of control points and the tangents at those points. This makes each parameter directly interpretable and easy to tweak!
#rstats #ggplot2
Over at Twitter, my colleague Paula has posted about our new R package {{fullRankMatrix}} available on CRAN twitter.com/PaulaH_W/sta...
Check it out at github.com/Pweidemuelle...
The package helps with design matrices that contain colinear columns. #rstats
Check it out at github.com/Pweidemuelle...
The package helps with design matrices that contain colinear columns. #rstats

July 4, 2024 at 8:52 AM
Over at Twitter, my colleague Paula has posted about our new R package {{fullRankMatrix}} available on CRAN twitter.com/PaulaH_W/sta...
Check it out at github.com/Pweidemuelle...
The package helps with design matrices that contain colinear columns. #rstats
Check it out at github.com/Pweidemuelle...
The package helps with design matrices that contain colinear columns. #rstats
We validated LEMUR's performance on a compendium of 13 single-cell datasets to demonstrate:
* that linear methods are flexible enough to integrate multiple conditions,
* LEMUR accurately predicts gene expression counterfactuals,
* LEMUR's DE test controls the FDR!
* that linear methods are flexible enough to integrate multiple conditions,
* LEMUR accurately predicts gene expression counterfactuals,
* LEMUR's DE test controls the FDR!


February 10, 2024 at 7:27 AM
We validated LEMUR's performance on a compendium of 13 single-cell datasets to demonstrate:
* that linear methods are flexible enough to integrate multiple conditions,
* LEMUR accurately predicts gene expression counterfactuals,
* LEMUR's DE test controls the FDR!
* that linear methods are flexible enough to integrate multiple conditions,
* LEMUR accurately predicts gene expression counterfactuals,
* LEMUR's DE test controls the FDR!
We included two new datasets to show LEMUR's features:
1. Analysis of the interaction between latent cell state and developmental time in embryonic development.
2. Application to a spatial single-cell dataset measuring the influence of Alzheimer's plaque density on gene expression.
1. Analysis of the interaction between latent cell state and developmental time in embryonic development.
2. Application to a spatial single-cell dataset measuring the influence of Alzheimer's plaque density on gene expression.


February 10, 2024 at 7:25 AM
We included two new datasets to show LEMUR's features:
1. Analysis of the interaction between latent cell state and developmental time in embryonic development.
2. Application to a spatial single-cell dataset measuring the influence of Alzheimer's plaque density on gene expression.
1. Analysis of the interaction between latent cell state and developmental time in embryonic development.
2. Application to a spatial single-cell dataset measuring the influence of Alzheimer's plaque density on gene expression.
The LEMUR package is included in the latest Bioconductor release. So you can try it out immediately:
bioconductor.org/packages/release/bioc/html/lemur.html
bioconductor.org/packages/release/bioc/html/lemur.html

February 10, 2024 at 7:22 AM
The LEMUR package is included in the latest Bioconductor release. So you can try it out immediately:
bioconductor.org/packages/release/bioc/html/lemur.html
bioconductor.org/packages/release/bioc/html/lemur.html
I just uploaded a new version of the LEMUR manuscript
www.biorxiv.org/content/10.1... 🎉🥳
LEMUR disentangles observed and latent factors of multi-condition single-cell data and finds groups of cells with consistent differential expression for each gene.
Details on the changes ⬇️
www.biorxiv.org/content/10.1... 🎉🥳
LEMUR disentangles observed and latent factors of multi-condition single-cell data and finds groups of cells with consistent differential expression for each gene.
Details on the changes ⬇️


February 10, 2024 at 7:20 AM
I just uploaded a new version of the LEMUR manuscript
www.biorxiv.org/content/10.1... 🎉🥳
LEMUR disentangles observed and latent factors of multi-condition single-cell data and finds groups of cells with consistent differential expression for each gene.
Details on the changes ⬇️
www.biorxiv.org/content/10.1... 🎉🥳
LEMUR disentangles observed and latent factors of multi-condition single-cell data and finds groups of cells with consistent differential expression for each gene.
Details on the changes ⬇️
I successfully defended my PhD on Friday 🥳
Thanks to everyone who joined me on this journey 🎓🧪
Thanks to everyone who joined me on this journey 🎓🧪

September 11, 2023 at 8:02 AM
I successfully defended my PhD on Friday 🥳
Thanks to everyone who joined me on this journey 🎓🧪
Thanks to everyone who joined me on this journey 🎓🧪