Karoline Wiesner: https://www.karowiesner.org
University Website: https://www.uni-potsdam.de/de/complexity-science/
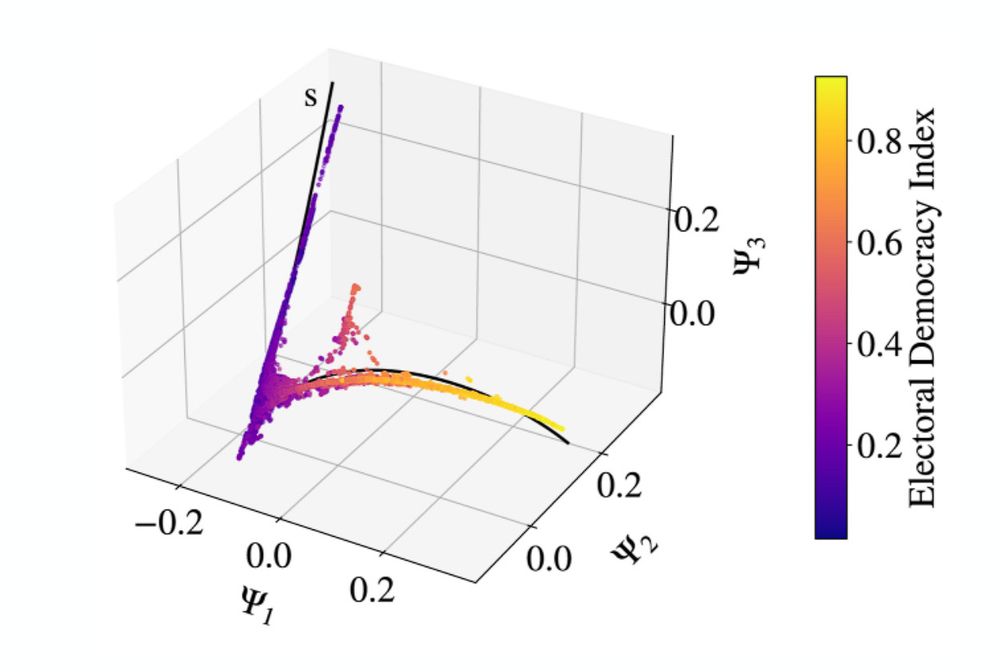
It reveals that, apparently, political systems behave like physical systems. Countries, over time, form this well-defined map, and their movement across this map can tell a lot about the stability of the regime.
It reveals that, apparently, political systems behave like physical systems. Countries, over time, form this well-defined map, and their movement across this map can tell a lot about the stability of the regime.
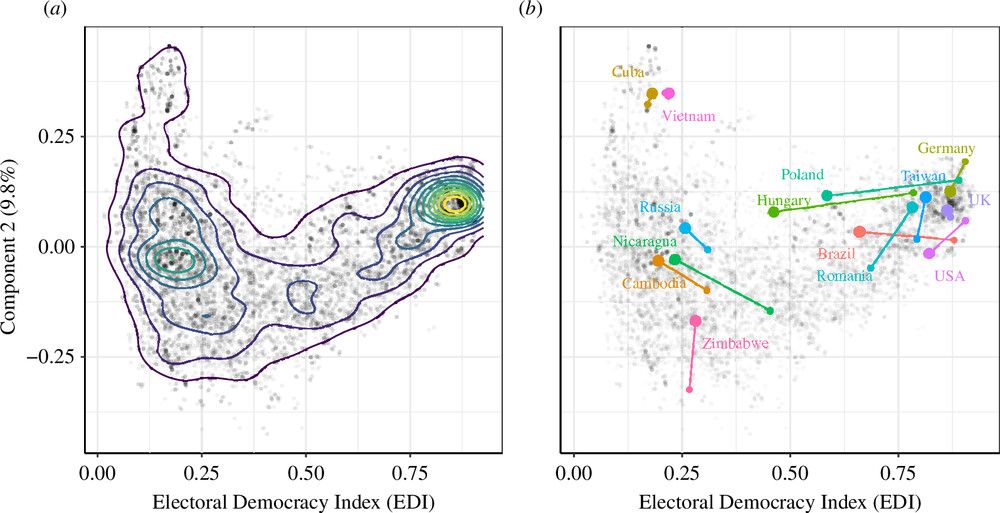
Differences between autocratic regimes can thus be uncovered.
Differences between autocratic regimes can thus be uncovered.
As always, a model is not a depiction of reality, but an approximation. The utility of a model depends on the questions asked. That is why new models are needed to dive into new fields of research.
As always, a model is not a depiction of reality, but an approximation. The utility of a model depends on the questions asked. That is why new models are needed to dive into new fields of research.
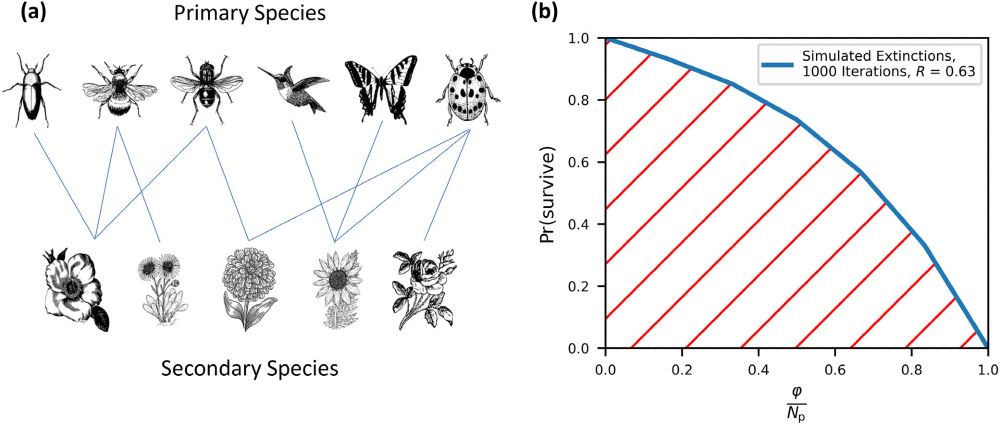
Understanding the extent of ecological damages helps take measures against them.
With low computational costs, this model for the robustness of a #complex system can prove useful in future.
Understanding the extent of ecological damages helps take measures against them.
With low computational costs, this model for the robustness of a #complex system can prove useful in future.
And also congratulations to @soenbeier.bsky.social, who worked with data on politics and society from the @vdeminstitute.bsky.social among other datasets!
🧪
And also congratulations to @soenbeier.bsky.social, who worked with data on politics and society from the @vdeminstitute.bsky.social among other datasets!
🧪
Her research is incredibly interesting and relevant for modern #politics.
This approach has the potential to provide a foundation for theories of political change, of emergence of conflict, and of extreme events in autocratic (and transitioning) regimes.
Her research is incredibly interesting and relevant for modern #politics.
This approach has the potential to provide a foundation for theories of political change, of emergence of conflict, and of extreme events in autocratic (and transitioning) regimes.
In other words: the regime type of a country is correlated with its position on the manifold curve and its dynamics as it moves around over the years. It can be analyzed with the anomalous diffusion approach known in statistical physics.
In other words: the regime type of a country is correlated with its position on the manifold curve and its dynamics as it moves around over the years. It can be analyzed with the anomalous diffusion approach known in statistical physics.
Large jumps (super-diffusive behaviour), characterised by the presence of extreme events, have been seen in destabilising autocracies.
Furthermore, small movements (sub-diffusive behaviour) have been identified in democracies and stable autocracies.
We see the history of a state in a graph!
Large jumps (super-diffusive behaviour), characterised by the presence of extreme events, have been seen in destabilising autocracies.
Furthermore, small movements (sub-diffusive behaviour) have been identified in democracies and stable autocracies.
We see the history of a state in a graph!
As a country goes through political change, it moves along this curve. Its development can be traced, and jumps and static phases linked to real life events and phases!
Using tools from statistical physics, distinct types of behaviour have been identified in the data.
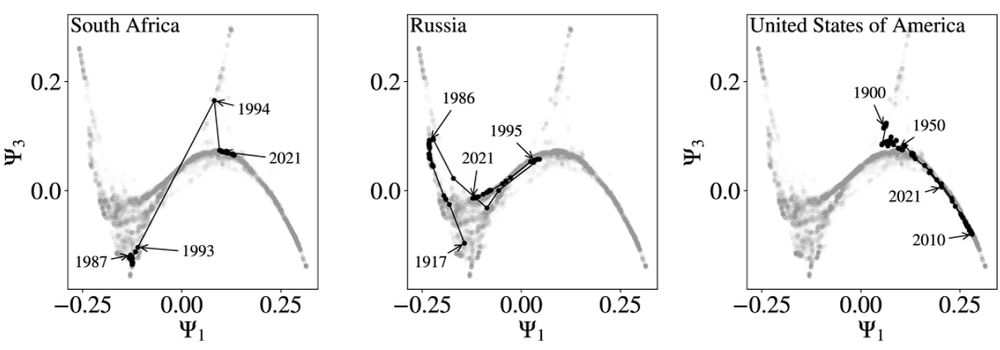
As a country goes through political change, it moves along this curve. Its development can be traced, and jumps and static phases linked to real life events and phases!
Using tools from statistical physics, distinct types of behaviour have been identified in the data.
Taking 25 variables out of the V-Dem dataset describing the “democraticness” of each country every year and simplifying them using diffusion to fit in a three-dimensional space, the data forms a curve - not a cloud of points - summarising the whole dataset considered.
Surprising, isn't it?
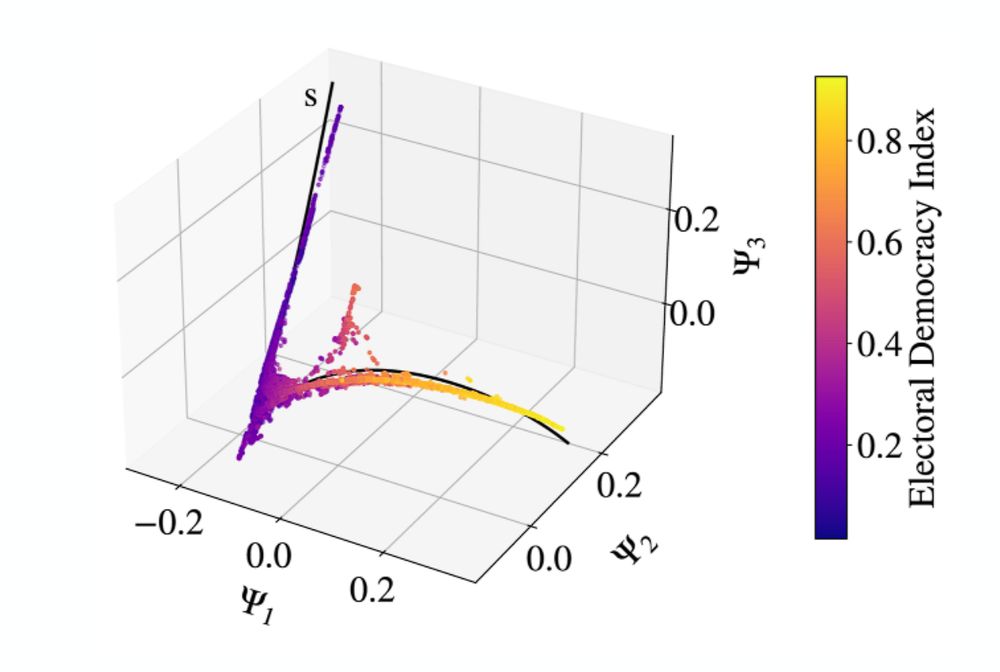
Taking 25 variables out of the V-Dem dataset describing the “democraticness” of each country every year and simplifying them using diffusion to fit in a three-dimensional space, the data forms a curve - not a cloud of points - summarising the whole dataset considered.
Surprising, isn't it?

