


Climate TRACE
@climatetrace.org
Climate TRACE is a non-profit coalition of organizations building a timely, open, and accessible inventory of exactly where greenhouse gas emissions are coming from.
Explore: ClimateTRACE.org/explore
Explore: ClimateTRACE.org/explore
The Guangzhou urban area in China ranks #2 worldwide on the Climate TRACE air pollution map for most people exposed to harmful PM2.5 pollution.
Visit the interactive tool to learn more about how pollution travels in the region. climatetrace.org/air-pollutio...
Visit the interactive tool to learn more about how pollution travels in the region. climatetrace.org/air-pollutio...
November 19, 2025 at 1:07 AM
The Guangzhou urban area in China ranks #2 worldwide on the Climate TRACE air pollution map for most people exposed to harmful PM2.5 pollution.
Visit the interactive tool to learn more about how pollution travels in the region. climatetrace.org/air-pollutio...
Visit the interactive tool to learn more about how pollution travels in the region. climatetrace.org/air-pollutio...
What would it take to reduce emissions from 744 million individual emitting sources worldwide? And what would be the impact of taking such action?
Find out with the new Climate TRACE emissions reduction roadmap tool.
Find out with the new Climate TRACE emissions reduction roadmap tool.

November 12, 2025 at 6:01 PM
What would it take to reduce emissions from 744 million individual emitting sources worldwide? And what would be the impact of taking such action?
Find out with the new Climate TRACE emissions reduction roadmap tool.
Find out with the new Climate TRACE emissions reduction roadmap tool.
Join Climate TRACE & UNFCCC at COP30 for a special event: Transforming Climate Data into Climate Action: Accelerating Implementation and Impact
Wednesday, November 12
11:00 – 12:30 BST
COP30 Blue Zone, Special Event Room Parnaíba
unfccc.int/event/transf...
Wednesday, November 12
11:00 – 12:30 BST
COP30 Blue Zone, Special Event Room Parnaíba
unfccc.int/event/transf...

November 11, 2025 at 1:01 AM
Join Climate TRACE & UNFCCC at COP30 for a special event: Transforming Climate Data into Climate Action: Accelerating Implementation and Impact
Wednesday, November 12
11:00 – 12:30 BST
COP30 Blue Zone, Special Event Room Parnaíba
unfccc.int/event/transf...
Wednesday, November 12
11:00 – 12:30 BST
COP30 Blue Zone, Special Event Room Parnaíba
unfccc.int/event/transf...
Ahead of COP30, Climate TRACE is gearing up to join the action, and this year we have something new to bring to the table.
Stay tuned for an announcement next week where we’ll share a new way to take action to reduce emissions and mitigate climate change.
Stay tuned for an announcement next week where we’ll share a new way to take action to reduce emissions and mitigate climate change.

November 6, 2025 at 12:40 PM
Ahead of COP30, Climate TRACE is gearing up to join the action, and this year we have something new to bring to the table.
Stay tuned for an announcement next week where we’ll share a new way to take action to reduce emissions and mitigate climate change.
Stay tuned for an announcement next week where we’ll share a new way to take action to reduce emissions and mitigate climate change.
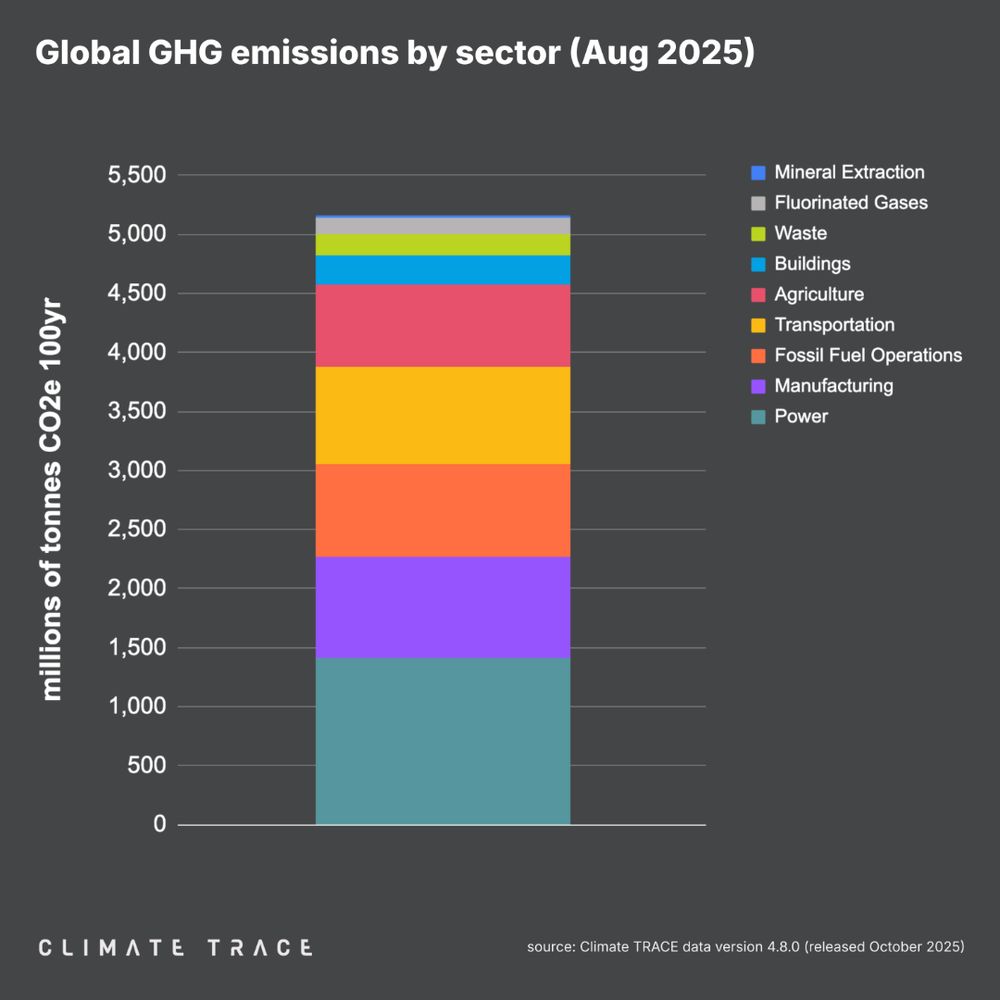
SECTOR DATA, August 2025 vs. August 2024:
📈Power sector emissions increased 0.44%
📉Fossil fuel operations emissions declined 1.88%
📈Transportation sector emissions increased 3.6%
📈Power sector emissions increased 0.44%
📉Fossil fuel operations emissions declined 1.88%
📈Transportation sector emissions increased 3.6%

October 30, 2025 at 5:27 PM
SECTOR DATA, August 2025 vs. August 2024:
📈Power sector emissions increased 0.44%
📉Fossil fuel operations emissions declined 1.88%
📈Transportation sector emissions increased 3.6%
📈Power sector emissions increased 0.44%
📉Fossil fuel operations emissions declined 1.88%
📈Transportation sector emissions increased 3.6%
Total global year-to-date emissions are 41.09 Bt through August, which is 0.3% higher than 2024’s year-to-date total for the same timeframe.

October 30, 2025 at 5:27 PM
Total global year-to-date emissions are 41.09 Bt through August, which is 0.3% higher than 2024’s year-to-date total for the same timeframe.
New global emissions data are in for August 2025, showing a total 5.16 Bt of CO2e emitted, which represents a 0.4% increase compared to August 2024.

October 30, 2025 at 5:27 PM
New global emissions data are in for August 2025, showing a total 5.16 Bt of CO2e emitted, which represents a 0.4% increase compared to August 2024.
The plumes are modeled based on conditions of an average day or worst conditions day, and the animation plays over a 24-hour period. Take a look at the info box on the bottom left to see time stamps.

October 29, 2025 at 9:23 PM
The plumes are modeled based on conditions of an average day or worst conditions day, and the animation plays over a 24-hour period. Take a look at the info box on the bottom left to see time stamps.
Stay informed on the latest updates from Climate TRACE by subscribing to our monthly newsletter, where you’ll receive all of the latest emissions data and insightful content in one place, direct to your inbox. climatetrace.org/subscribe

October 29, 2025 at 11:35 AM
Stay informed on the latest updates from Climate TRACE by subscribing to our monthly newsletter, where you’ll receive all of the latest emissions data and insightful content in one place, direct to your inbox. climatetrace.org/subscribe
New research shows that wastewater treatment plants are emitting twice as much GHGs as previously estimated by the US EPA. www.eurekalert.org/news-release...

October 23, 2025 at 5:37 PM
New research shows that wastewater treatment plants are emitting twice as much GHGs as previously estimated by the US EPA. www.eurekalert.org/news-release...
ICYMI: Climate TRACE has an updated country inventory page, providing more granular emissions insights.
The update shows monthly #emissions data breakdowns, country rankings, emissions changes, and more.
Check it out:
climatetrace.org/inventory
The update shows monthly #emissions data breakdowns, country rankings, emissions changes, and more.
Check it out:
climatetrace.org/inventory

October 16, 2025 at 8:39 PM
ICYMI: Climate TRACE has an updated country inventory page, providing more granular emissions insights.
The update shows monthly #emissions data breakdowns, country rankings, emissions changes, and more.
Check it out:
climatetrace.org/inventory
The update shows monthly #emissions data breakdowns, country rankings, emissions changes, and more.
Check it out:
climatetrace.org/inventory
Have questions about the new air pollution visualisation tool from Climate TRACE? Learn more about the tool, including what is included and what is not in version 1.0, on our dedicated FAQ page: climatetrace.org/news/plumes-...

October 8, 2025 at 8:34 PM
Have questions about the new air pollution visualisation tool from Climate TRACE? Learn more about the tool, including what is included and what is not in version 1.0, on our dedicated FAQ page: climatetrace.org/news/plumes-...
July 2025 global emissions in four charts.
Learn more about the latest data from Climate TRACE: climatetrace.org/news/climate...
Learn more about the latest data from Climate TRACE: climatetrace.org/news/climate...


September 25, 2025 at 2:30 PM
July 2025 global emissions in four charts.
Learn more about the latest data from Climate TRACE: climatetrace.org/news/climate...
Learn more about the latest data from Climate TRACE: climatetrace.org/news/climate...
INTRODUCING A NEW TOOL: Visualize the air pollution impacting 1.6 billion people in over 2,500 urban areas from the world’s top emitters of climate- and health-harming pollution.
Make the connection at ClimateTRACE.org/air-pollution.
Make the connection at ClimateTRACE.org/air-pollution.
September 24, 2025 at 2:51 PM
INTRODUCING A NEW TOOL: Visualize the air pollution impacting 1.6 billion people in over 2,500 urban areas from the world’s top emitters of climate- and health-harming pollution.
Make the connection at ClimateTRACE.org/air-pollution.
Make the connection at ClimateTRACE.org/air-pollution.
Look out for more information this Wednesday as Climate TRACE unlocks even more transparency around the sources of climate- and health-harming air pollution and the nearby communities that are most impacted.
September 23, 2025 at 4:54 PM
Look out for more information this Wednesday as Climate TRACE unlocks even more transparency around the sources of climate- and health-harming air pollution and the nearby communities that are most impacted.
You’re invited: Wednesday, September 10th, for a webinar: “From Financed Emissions to Financing Emissions Reductions.” Learn how to harness new data to steer capital toward high-impact decarbonization finance.

September 8, 2025 at 4:43 PM
You’re invited: Wednesday, September 10th, for a webinar: “From Financed Emissions to Financing Emissions Reductions.” Learn how to harness new data to steer capital toward high-impact decarbonization finance.
SECTOR CHANGES H1 2025:
📈The fossil fuel sector had the biggest increase in emissions in H1 2025, rising 1.5% — with more than half of the increase coming from the United States.
📉The power sector had the biggest decline in emissions, dropping 0.8%.
📈The fossil fuel sector had the biggest increase in emissions in H1 2025, rising 1.5% — with more than half of the increase coming from the United States.
📉The power sector had the biggest decline in emissions, dropping 0.8%.


August 28, 2025 at 10:49 PM
SECTOR CHANGES H1 2025:
📈The fossil fuel sector had the biggest increase in emissions in H1 2025, rising 1.5% — with more than half of the increase coming from the United States.
📉The power sector had the biggest decline in emissions, dropping 0.8%.
📈The fossil fuel sector had the biggest increase in emissions in H1 2025, rising 1.5% — with more than half of the increase coming from the United States.
📉The power sector had the biggest decline in emissions, dropping 0.8%.
For the first half of 2025, global emissions reached 31 Bt of CO2e, a 0.13% increase compared to the first half of 2024.

August 28, 2025 at 10:49 PM
For the first half of 2025, global emissions reached 31 Bt of CO2e, a 0.13% increase compared to the first half of 2024.
NEW DATA: Emissions data through June 2025 are live on Climate TRACE, showing a clear picture of the first half of 2025 global emissions. June 2025 emissions totaled 5.12 Bt CO2e, a 0.29% increase compared to June 2024.

August 28, 2025 at 10:49 PM
NEW DATA: Emissions data through June 2025 are live on Climate TRACE, showing a clear picture of the first half of 2025 global emissions. June 2025 emissions totaled 5.12 Bt CO2e, a 0.29% increase compared to June 2024.
NEW RESEARCH: Climate TRACE’s rice emissions sector lead has published an improved approach for data on rice cropping intensity, spatial resolution, and cultivation practices. This approach is applied to improve Climate TRACE rice emissions estimates. rdcu.be/eBWKl 🌾

August 25, 2025 at 10:14 PM
NEW RESEARCH: Climate TRACE’s rice emissions sector lead has published an improved approach for data on rice cropping intensity, spatial resolution, and cultivation practices. This approach is applied to improve Climate TRACE rice emissions estimates. rdcu.be/eBWKl 🌾
See how the other sectors compare under different GHG-specific views on the Climate TRACE platform at ClimateTRACE.org/explore.

August 20, 2025 at 8:17 PM
See how the other sectors compare under different GHG-specific views on the Climate TRACE platform at ClimateTRACE.org/explore.
How about the other GHG emissions from agriculture?
→ Methane emissions in 2024 reached 147.7Mt.
→ Nitrous oxide emissions totaled 6.0Mt.
→ Methane emissions in 2024 reached 147.7Mt.
→ Nitrous oxide emissions totaled 6.0Mt.


August 20, 2025 at 8:17 PM
How about the other GHG emissions from agriculture?
→ Methane emissions in 2024 reached 147.7Mt.
→ Nitrous oxide emissions totaled 6.0Mt.
→ Methane emissions in 2024 reached 147.7Mt.
→ Nitrous oxide emissions totaled 6.0Mt.
Looking at carbon dioxide alone, global #agriculture #emissions reached 2.3Bt in 2024.

August 20, 2025 at 8:17 PM
Looking at carbon dioxide alone, global #agriculture #emissions reached 2.3Bt in 2024.
Switching to a 20-year time horizon view for CO2e, you can get a better understanding of near-term warming impacts of agriculture emissions. In 2024 global agriculture emissions reached 15.7Bt CO2e20.

August 20, 2025 at 8:17 PM
Switching to a 20-year time horizon view for CO2e, you can get a better understanding of near-term warming impacts of agriculture emissions. In 2024 global agriculture emissions reached 15.7Bt CO2e20.
A commonly viewed metric is CO2 equivalent (CO2e) 100-year. CO2e provides a unified metric to view the emissions impact of all major GHGs. In 2024 agriculture emissions totaled 7.9Bt CO2e100.

August 20, 2025 at 8:17 PM
A commonly viewed metric is CO2 equivalent (CO2e) 100-year. CO2e provides a unified metric to view the emissions impact of all major GHGs. In 2024 agriculture emissions totaled 7.9Bt CO2e100.