Cliff Mass Weather Blog
cliffmass.blogspot.com.web.brid.gy
Cliff Mass Weather Blog
@cliffmass.blogspot.com.web.brid.gy
This blog provides updated forecasts and comments on current weather or other topics

🌉 bridged from https://cliffmass.blogspot.com/ on the web: https://fed.brid.gy/web/cliffmass.blogspot.com
Snow in the Passes and Eastern Slopes of the Cascades
 I have received several inquiries about snow in the Cascade passes from folks who will be traveling over Thanksgiving, and for others looking for some snowy recreation this week. **So let's take a look at the latest forecasts.  ** A weather system is off our coast right now and has our name on it.  It will move in on Tuesday afternoon, with precipitation into Wednesday. The UW ultra-high resolution model predictions of snowfall totals through 1 PM on Wednesday (below) show up to about a foot in the Cascades, with about half that amount in the passes. Much more snow on the eastern slopes of the Cascades than to the west.  Substantial snows on the southwest side of the Olympics as well. But this is just the beginning:  more snow will come in on late Thursday and Friday over the north Cascades (see total through 4 PM Saturday below). There is some uncertainty in the forecasts...let me illustrate.  A powerful tool used by meteorologists is ensemble forecasting....running our forecast models many times with slight differences in initial conditions or physics (e.g., precipitation processes). Below is the ensemble prediction of snow at Stampede Pass at 4000 ft on the eastern side of the Cascade crest. The mean forecast is for about 6 inches, with a range of 4 to 12 inches.   Snoqualmie will get less...perhaps 2-4 inches.  So, not the end of the world, as predicted by a few online sites. Not enough snow for downhill skiing, but plenty for snowballs and perhaps snowshoeing.    The landscape will look pretty. Enjoy.  And please drive carefully when crossing the Cascades.
cliffmass.blogspot.com
November 25, 2025 at 1:59 PM
The Problem With Wind Energy in the Northwest
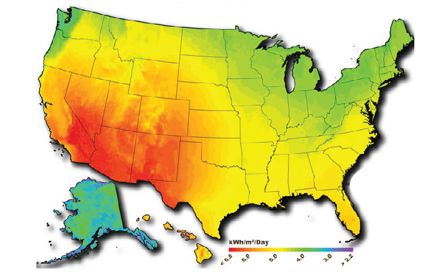
**This was a bad week for wind energy in the Northwest, but before I discuss this, let's step back for a few minutes.** There is a lot of interest in renewable energy in the Pacific Northwest that could supplement our hydropower. With our northern latitude and extensive clouds for much of the year, solar energy can only make a small contribution. To illustrate, here is the annual solar energy map for the U.S.  Western Oregon and Washington have poor solar resources.  Better in eastern Oregon and the Columbia Basin.  But even in these areas, there is very little resource from November through February. The wind energy situation in the Northwest is better, but not particularly good.   Consider the map of annual wind energy resources in the U.S. (below).   The windy High Plains of the U.S. have terrific potential, but the western U.S., away from the coast, has very modest wind energy, at best.  Only the coastal waters from central Oregon to central CA have good wind potential. Here in Washington State, the only decent non-coastal area for wind energy is the eastern slopes of the Cascades (see map below).   That is why nearly all of the wind turbines are there.  Constructing wind turbines offshore is very expensive and has significant environmental problems. **But there is a problem**.   For much of the year, these turbines generate little power. Consider the Bonneville Power Authority (BPA) statistics for the past week.   The total energy demand is the red line, and hydro generation is blue. Wind energy (green) has been very small most of the week, except on one day (November 18) when a frontal system moved through.  The output from one nuclear plant (purple) has been constant and generally much higher. The truth is that wind generation in our region is only really significant from late spring to late summer, when strong westerly flow descends the eastern slopes of the Cascades. To see this, consider the winds at Ellensburg, surrounded by wind turbines on several sides.  Good winds from April into the middle of August.  But consistently slower (and often very weak) the remainder of the year. In short, our region needs to maximize our hydro resources and invest in next-generation nuclear (fission) plants, which are inherently safe. With rapidly increasing demand for electricity, expected to roughly double by mid-century (see NW Power Council estimate below),  without new generation capacity, there is a near certainty of blackouts, particularly during cold periods.
cliffmass.blogspot.com
November 23, 2025 at 1:59 PM
Wet California
 This has been a very wet fall in California.    **A big contrast with last year.** Los Angeles this week Consider the differences from normal of the precipitation during the last month for the western U.S. (below). Wow.  Some parts of southern California have gotten 800% of normal precipitation!  The entire state is considerably wetter than normal. Many of the rivers are running MUCH higher than normal, as shown by the latest percentages below.   Crazy high river levels over coastal southern California. What about the levels of the all-important California reservoirs?  The answer is below. **All are at or above normal.**   Over southern California, some are full. Last year, had one of the driest Octobers through December on record in Southern California, which contributed to the LA wildfire in early January. **Some claimed this was the result of "climate change."** The atmosphere did not get the message.   Consider the precipitation from October 1 through November 19 over the past 50 years.  **This year was the second wettest of the entire record!** This wet fall has led to the suppression of wildfires. ** ** **So far this has been a VERY low wildfire year in California....something that is being given little attention in the media.  ** Below are the statistics for wildfire acres year to date.    So far in 2025, about 525,208 acres have burned compared to a fire-year average of 1,315,947. **That is only about 40% of the recent average.** So, why has California been so wet?    The answer:  a persistent trough of low pressure off its coast. For example, here is the anomaly map (difference from normal) for the heights at 500 hPa pressure (think of pressure around 18,000 ft). Purple and blue indicate lower than normal values....troughs of low pressure.    Right off of California!
cliffmass.blogspot.com
November 21, 2025 at 1:56 PM
Drought Misinformation
There have been several stories in the Seattle Times and some local media that have hyped and exaggerated the "drought" over Washington State. For example, a few days ago, the Seattle Times had a big spread talking about drought for the Yakima River basin: _The lack of rain and snow forced farmers to tear out their apple orchards by the acre. Wine grapes are withering on the vine. Miles-long irrigation canals leak and crumble._ _This basin is the face of Washington’s drought. This might be the  driest year in recent memory, fresh on the heels of severe droughts last year and the year before_.. They had a picture of Lake Keechelus that showed it being completely dry. **Very deceptive.**   I went up there on Sunday and this is what I saw: They took a picture of one of the lake flanks, which is always dry during this season---even during a normal year. This is not honest journalism. **The truth is that the Yakima Reservoir system is rapidly filling, and Yakima River levels are normal.   ** Still believe the Seattle Times?  Let's look at the actual numbers. Below is a plot of storage for the entire Yakima system over time, showing average values (red), last year (green), and this year (blue). **This year, we are WAY higher than last year and rapidly refilling.** In fact, the current storage now is about the same as last year, ONE FEBRUARY 1. What about the water flow in the critical Yakima River?   (see below) ** ** **The flow is now above normal, and the prediction is for it to stay that way.** The Seattle Times is making all kinds of serious drought claims, with a lot of hints about global warming being the cause. **But is precipitation really declining over time on the eastern slopes of the Cascades, the watershed area for the Yakima Basin?** Let's check, using the official NOAA climate division data. Below is a plot of October through August precipitation totals on the eastern slopes of the Cascades. Both the last two years were below normal.  No doubt about that.  **But other years were drier...some much drier.  ** Importantly, **there is no long-term trend toward drier conditions, which is a sign of climate change.  ** **  Climate change is not the origin of the last two dry years....it is natural variability.** This year is clearly going to be substantially moister than the last two years. There is a critical issue that the Seattle Times and certain activists never consider: ** ** **Is a drier-than-normal year really a big deal?**  For example, if the Yakima Valley region receives more precipitation than it really needs on average, is being down modestly a problem of any significance? It turns out that the "drought" had very little impact on Yakima Valley agriculture: * The 2025 Yakima Valley apple crop was large and high-quality, with a record-tying amounts. * The 2025 Yakima Valley cherry crop was excellent, with a good-sized and high-quality harvest resulting from favorable weather conditions. The cherry season was particularly long this year. * The 2025 Yakima Valley grape crop is expected to be a "standout vintage" for quality. Bottom line:  the agricultural impacts of the "drought" were very minor for the eastern slopes of the Cascades. In a future blog, I will take on the Seattle Times' claims about drought on the western side of the Cascades. But I can't help myself.  Here are the latest reservoir levels for Seattle Precipitation has been a bit above normal over watershed and reservoir levels are rising rapidly and are almost at normal levels
cliffmass.blogspot.com
November 19, 2025 at 1:48 PM
A Remarkable Mini Atmospheric River Hits Western Washington
Most of the time, atmospheric rivers--_plumes of lower-atmospheric moisture from off the Pacific Ocean-_ -are relatively wide and thus produce large amounts of precipitation over a broad region. But on Friday, something relatively unusual occurred:   a very narrow "mini" atmospheric river was locked over our region for hours, producing a narrow band of intense precipitation over western Washington and into the Cascades. You can really see it in the regional weather radar image for Friday morning (below).  Yellows indicate the heaviest precipitation. The southwest-northeast plume of heavier rain was very evident.  Totally dry over the San Juans and the southern Cascades.    Consider the precipitation totals on Friday below (only values more than a third of an inch are shown). You can clearly see the precipitation band; where the moisture plume was forced to rise by the central Cascades, 3-5 inches fell. Local rivers have surged, some to near flood stage.  The black dots below show the rivers that are now experiencing MUCH above normal flow. Ironically, this is the area that the wacky Drought Monitor graphic shows SEVERE DROUGHT. **The UW WRF model accurately predicted this moisture plume the day before.**    Below is the prediction (for Friday morning) of _water vapor flux_ (the amount of water vapor brought in by the wind).  Orange shows the highest amounts.    Not bad. The model precipitation total (through 4 PM Friday) was excellent:  here is the proof: We have come very, very far in our ability to predict local weather.  Really stunning. **This is something the gloom and doom global disaster folks don't seem to understand:   we now have the ability to predict and prepare for severe weather.** My colleagues in the National Weather Service recognized the situation and put out a flood advisory yesterday morning for the moisture plume area. For those of you (like the Seattle Times) who are worried about drought conditions and lack of water for our region, the plume of precipitation made a direct hit on Seattle's Tolt Reservoir, where almost four inches have fallen: Reservoir levels are moving up rapidly as a result. _ _ _ _ Apparently, this has gotten some folks nervous. More rain is coming later Sunday and Monday. Sorry...this IS November.
cliffmass.blogspot.com
November 16, 2025 at 1:47 PM
A Near "Bomb" Cyclone Approaches the West Coast
 Last weekend, I started getting emails from folks concerned about a "bomb cyclone" approaching Washington state.    Some of the amateur Facebook and YouTube sites were also starting to beat the weather drums. The reason?  Several model runs at that time had scary forecasts, such as this one for 4 PM Thursday (tomorrow).  The kind of strong low that would easily take out power to hundreds of thousands of local customers. When I took a look at the situation, I realized the uncertainty of these forecasts was very, very large:  the ensembles of many forecasts have a huge spread in solutions, and the forecasts changed radically run to run. **That is why I did not blog about it**. We are close enough now to have a good idea of what will occur tomorrow... the rapid development of a strong low off the California coast. A low center that will dissipate almost as quickly as it developed. Here is the pressure analysis for 4 AM this morning.  An amorphous 1002 hPa low-pressure center off of northern California.  Yawn. Now look at the forecast for 4 AM Thursday morning:  **a 986 hPa low has formed**.  Impressive. A deepening of 16 hPa in 24 h.   Not quite the bomb rate (24 hPa in 24 h), but very substantial. The developing low was quite evident on the visible satellite image this afternoon (see below, and I marked the low-pressure center). The water vapor satellite imager tonight (8:30 PM) was quite impressive: By 10 AM on Friday, the low will weaken to 1001 hPa and drift nearly due south. This storm is predicted to drive some large waves offshore (see wave forecast for 4 PM Thursday), with some getting to 25 feet, and some modest waves reaching the coast.  No big deal. Here in Washington State, we will get little wind from the low center.  However, it _will_  push a plume of moisture into our region (yes, an _atmospheric river_) that will provide more welcome rain (see forecast of the water vapor transport below). The forecast totals through Sunday at 4 AM are impressive in the mountains:
cliffmass.blogspot.com
November 13, 2025 at 1:46 PM
Super Inversion and Record Heat
 The temperature inversion today over Seattle is one of the strongest I have ever seen. As a reminder, an **_inversion_** is when temperature increases with height, in contrast to the normal decrease with height. The conditions at SeaTac Airport this morning are shown below. 42°F at the surface and 61°F at 2100 feet. **19°F warmer.     Just amazing.** Some of the local temperature contrasts this morning were stunning, with cold air at lower elevations, and MUCH warmer temperatures on hills or downwind of hills. To illustrate, consider the temperatures this morning near Carnation, Washington.  A range from 60 to 39F over a few miles.  60 to 42°F over a short walk. A super-inversion was also observed on the coast at Forks (see below, temperatures in °C and height in pressure, 700 hPa is about 10,000 ft) The UW high-resolution weather prediction for this morning had the general pattern right, with the warm temperatures associated with easterly (from the east) winds down the western slopes of local terrain. But it failed to get the lowest temperatures correct. Current modeling systems have too much vertical mixing and thus fail to maintain the low temperatures at the bottom of inversions.  We are working on this. The record high for today at SeaTac is 64F (see below).   There is a good chance we will tie or beat it. What weather pattern is producing such an extreme inversion?  As shown by the 500 hPa heights (pressure around 18,000 ft), there was a huge ridge of high pressure over the western US.  Such high pressure is associated with great warmth aloft and a lack of serious clouds. As the sun heats the surface, it causes vertical mixing, the warm air will be brought down to the surface, and daily record high temperatures for the date are quite possible.  Here are the predicted temperatures at 2 PM this afternoon.  Western Washington will be torrid, especially on the slopes..   Several stations will climb into the low to mid-60s today in western Washington.  Perfect for a walk, bike ride, or raking up leaves.  Much cooler in eastern Washington. I am planning on a long run this afternoon.😀
cliffmass.blogspot.com
November 10, 2025 at 1:43 PM
Deaths from Extreme Weather are Rapidly Declining
There is a lot of talk about extreme weather these days, with many climate activists and media suggesting that deaths and injuries from extreme weather are increasing due to human-caused global warming. **However, the truth is very different** : **Deaths from extreme weather are actually decreasing rapidly for several reasons.** You read that correctly:  **declining**. To illustrate, the figure below shows the number of global deaths from floods, droughts, storms, wildfires, and extreme temperatures from the 1920s to 2021, based on a respected international database. **Huge declines in deaths.**   And this is not including the fact that the population has increased immensely during the past century. Thus, personal risk from extreme weather is going down even faster!. **Want a more specific example?  ** In 1970, the Bhola Cyclone (hurricane) hit India/Bangladesh, resulting in about 500,000 deaths.  Forecasts were poor, warning systems were poor, and infrastructure was inadequate. Path and satellite image of the 1970 Bhola cyclone In contrast, in 2020, a MUCH stronger hurricane, Super Cyclone Amphan, followed an almost identical path. ** 2020 Cyclone Amphan ** ** The death toll?   133.  You read that right. 133.** Why?  Forecasts were much better, warnings were improved, and there is far more robust infrastructure. During the past few decades, the Earth has warmed by approximately 2°F, with human emissions of greenhouse gases being the primary cause. **Yet, deaths from severe weather are WAY down.   How can this be?** Some reasons include: (**1) Weather forecasts are HUGELY better for all types of extreme weather compared to 40 years ago.**     This allows better warning and preparation for extreme weather events. Hurricane tracks are usually predicted with great accuracy. **(2) The ability to communicate threats is WAY better than 40 years ago, with people in even poor countries possessing smartphones that provide updated warnings.** (**3)   All nations are richer and developed than 40 years ago, with major investments making infrastructure and homes more robust for extreme weather events.** **(4)   Global warming does not increase the threat of all types of extreme weather. ** In fact, global warming decreases some threats. Shocking right?  You don't read that very often in the Seattle Times and other mainstream media. Global warming can decrease deaths from some extreme weather. But it is true.  Let me give you an example:  extreme temperatures. Rising temperatures REDUCE deaths because the biggest temperature threat for most people is COLD rather than heat. It is not even close.  As shown below, cold waves kill MANY more people than heat waves, by a factor of 5-10 to one. There are several articles in the peer-reviewed literature that explicitly state this:  warming temperatures will reduce extreme heat deaths. Hurricanes?   The ability to forecast their track has become much, much better.  At the same time, the frequency of major hurricanes has been stable as the Earth has warmed considerably during the past few decades. Same thing with the number of landfalling storms.  No upward trends as the planet warms. Even with an immense increase in population in the coastal zone, the number of hurricane deaths from Atlantic hurricanes and tropical storms is nearly constant (see below).  Thus, personal risk is immensely LESS. I could discuss other forms of extreme weather, but the conclusions are the same: **Your personal risk from virtually any type of extreme weather is now much, much smaller than it has been historically.** We live with LESS risk of being killed or injured by extreme weather today, even as the planet slowly warms. **Announcement** I will hold a special online Zoom session at 10 AM on Sunday for Patreon supporters.  Will answer questions and talk in detail about the outlook for the coming winter
cliffmass.blogspot.com
November 8, 2025 at 1:44 PM
The Thunderbird Returns to the Northwest: Substantial Precipitation Ahead
 There are many Native American stories about the origin of Northwest storms and rain, with my favorite being about the Thunderbird, a huge avian living in a cave of the Olympics.  When it left its high abode to hunt for its favorite prey (the Killer Whale), storms, wind, and even lightning would occur. If there was ever a month for Thunderbird flights, it would have to be November. A tenth of an inch represents a decent wetting, and the frequency of that amount at Seattle Tacoma Airport is shown below.  There is a clear peak:  in mid-November!   By December, there is already a bit of drying! With this climatology in mind, let's look at the latest forecast for accumulating precipitation. With a weather system coming in tonight and tomorrow, the total through Thursday morning is substantial, particularly on the Olympics and the coastal mountains. By Friday morning, the Cascades will get to enjoy the wet fun with 2-3 inches of rain.  Note the profound rain shadow over the San Juans in the lee of the Olympics. The next week will bring much more rain, with the totals through Friday morning, 14 November, getting to 4-5 inches in the mountains. And far more, by Tuesday, Nov. 18th.   The Thunderbird will be busy.  This is enough to result in localized river flooding and substantial progress in filling local reservoirs. **An interesting aspect of the next two weeks will be the absence of major landfalling storms, with persistent low pressure staying offshore.** To illustrate, below is the sea level pressure forecast for tomorrow (Wednesday) morning.  Huge low offshore. Five days from now, another low will be offshore. No major power outages to be expected, with this pattern. No "bomb cyclone" action in our nearshore waters like last year.  At least not yet. A relief for many.
cliffmass.blogspot.com
November 5, 2025 at 1:38 PM
Washington is the UFO Capital of the U.S. Is it Our Weather?
 A series of reports have come out recently demonstrating that Washington State is NUMBER ONE in the number of reports per person of UFOs (Unidentified Flying Objects). Below is the data.  During the past year, there was one sighting for every 1021 people in Washington. In contrast, in Louisiana UFOs are observed less than a third as often, something perhaps explained by the greater interest in Mardi Gras, alligators, and spicy gumbo. Certain Washington (and Oregon) locations are favored for extraterritorial visitation, particularly east of the Cascade Crest and over the Olympics (see below, darker green indicates more events), There are three reasons why Washington State could have more UFO sighting reports: ** (1)  UFOs really are more frequent here. ** **      **Perhaps extraterrestrials like our salmon or are interested in Boeing. Perhaps they think Washingtonians are particularly interesting.   I would doubt it.   (2) **Washington State has a mental health issue.   ** ** ** Some political commentators might agree with this.  Perhaps folks in this state are so worried about the future of the world and the current administration that they yearn for intergalactic intervention. **(3) Our meteorology often produces features in the sky that look like UFOs.  ** This is the one I would put my money on. **It all started here.** Did you know that the UFO craze started HERE in 1947, when a pilot of a small plane  (Kennith Arnold), flying between Chehalis and Yakima, spotted a group of "saucer-like" objects over Mount Rainier? A faculty member in my department analyzed the situation and demonstrated that Arnold actually saw lenticular clouds forced by Mount Rainier. Such clouds form when relatively moist air is forced over a mountain barrier and then oscillates up and down, with upward motion producing the lens-shaped cloud (see schematic below). As an aside, during a presidential debate on October 20, 2017, presidential candidate Dennis Kucinich admitted to seeing a UFO while staying at actress Shirley Maclaine's home near....... Mount Rainier. Dennis Kuckinch **The Pacific Northwest, and particularly Washington State, is probably the best place in the US to see lenticular/mountain wave clouds.   ** You can see them here on many, many days--either by viewing the sky or on satellite imagery. _Why so frequent here?_ We have big mountain barriers of sufficient height. We have strong winds approaching the mountains. We have air that is sufficiently moist to produce clouds. Cloud like this: Or this Or this So consider the meteorological explanation of our first rank in UFO sightings. Or if you prefer:
cliffmass.blogspot.com
November 3, 2025 at 1:38 PM
Wind Uncertainty
T**he confidence in weather forecasts is not always the same.** Sometimes all the models lock onto a forecast, suggesting uncertainty is low and meteorologists can have confidence in their predictions. But in other situations, uncertainty is large, with large differences among the forecast guidance. The wind forecast for tomorrow over central Puget Sound is a good example of such an uncertain forecast. One of the key tools of meteorologists for exploring uncertainty is viewing the forecasts from many weather model simulations, something called an _ensemble.  _ Below is the ensemble of forecasts for wind gusts in Seattle for forecasts starting early Friday. **The predictions for Saturday are all over the place!** ** ** ** ** **A low confidence prediction, at least for Seattle winds.** The key issue producing uncertainty is the path and intensity of a weak low-pressure center approaching the region. The updated American model solution on Friday evening has a low approach coast and then passes across northern Puget Sound  (see below for forecast at 5 AM Saturday. Earlier today, both the European Center and NOAA HRRR models had a stronger low passing to the north, which would have produced much stronger winds (up to 50 mph) over western Washington, but they have backed off that solution. I suspect very few will lose power tomorrow.  However, the approaching low will dump ever more rain over the region on Saturday morning.   Showers will greatly decline on Sunday and Monday, and Tuesday should be mainly dry. Talking of rain, today's moist southwesterly flow produced profound contrasts for precipitation across the Olympics (below).  For the period from midnight through 8 PM Friday, there were 2-3 inches on the southwest side of the barrier and only .01 in Port Townsend.    That is quite a rain shadow. Note that the largest rainfall totals are not at the high elevations but in the lower foothills of the mountains, where the moist air was initially forced to rise.
cliffmass.blogspot.com
November 1, 2025 at 1:35 PM
Three Atmospheric Rivers During the Next Week
**Three** atmospheric rivers will be impinging on the Pacific Northwest, and substantial precipitation will be falling. To illustrate, below is a plot of integrated water vapor transport (the intensity of the horizontal movement of water vapor by winds) on Friday at 5 PM.  The arrows show the direction and intensity of the water vapor transport. **Lots of water vapor pushing into western WA and BC**.    Water vapor that will turn to precipitation as it is forced to rise by our local mountains. When you get into the blue colors,  you know the atmospheric river is a strong one! Late Monday, another (but weaker) atmosphere will make landfall And then a **monster atmospheric river** will make landfall on Wednesday, with heavier precipitation in Oregon and northern California. **You want to see how much precipitation will fall?   ** You bet..and be prepared to be impressed. After the first atmospheric river (Saturday at 5 PM shown below), the Washington and BC mountains (and their windward slopes) will have received two inches or more of liquid water. **This is just the start.    ** After the third atmospheric river moves through (Thursday at 4 PM shown), the accumulated precipitation totals will be stunning, with some locations getting over **10 inches of accumulated liquid water**. There will be a massive fill of regional reservoirs, and I suspect the persistent talk of drought will fade.   Of course, no more regional wildfires. But as in late-night TV commercials, there is MORE!   The latest long-range European Center forecast for November through January predicts much more precipitation than normal over the region.
cliffmass.blogspot.com
October 30, 2025 at 1:34 PM
Lots of Snow in the Mountains....and the Seattle Times Gets it Wrong Again
 First, we had strong winds, taking out the power to a quarter-million local residents.  And then snow. The vigorous system that moved through on Sunday and a second disturbance behind spread substantial snow over the regional mountains above approximately 4000 ft., with 1-2 feet on the ground in many locations. The image at 8 PM at the Paradise Visitor Center on Mount Rainier (about 5000 ft) was a snowy dream, with the moon illuminating a winter wonderland. **Want to see how much difference a year makes?** Below are maps of the regional snow water equivalent (the amount of water in the snowpack) for last year (left) and this year (right) for 11 PM on October 26. Can you tell the difference? 😊 Virtually nothing last year.   Bountiful snowpack this year. And by tomorrow at 5 PM, there will be even more (see additional totals below). Not enough to think about downhill skiing, but a good start, and a welcome beginning to the winter snowpack after a low previous year. A very strong atmospheric river will approach the region on Friday-Sunday, but I will leave that to my blog. **Seattle Times Errors Again** As long as I am talking about atmospheric rivers, I can't help but note the major errors in recent Seattle Times stories on this topic.   Consider the atmospheric river graphics they provided a few days ago (below). **Not very good.  **  It starts by stating that atmospheric rivers are "flowing columns of condensed water vapor". Water vapor is not "condensed".  **It is vapor... .a GAS**.  Most of the water associated with atmospheric rivers is not condensed water (that is, clouds or precipitation), but **water vapor.** ** ** Water vapor that is forced to condense into clouds and precipitation as it is forced to rise by local terrain. **     ** They claim that the water vapor is found one mile above the ocean.  This is simply false.  The claim that atmospheric rivers "generate a series of storms" is wrong.   Atmospheric rivers are the **result** of larger-scale circulations and storms.   The Seattle Times confused the chicken and the egg. **This error-filled Seattle Times graphic is not an isolated example of poor research and writing. I could show you a dozen more.   Ok, how about one?** Below is their graphic about the convergence zone and rainshadow.  They have the air approaching the Olympics from the southwest (which is fine), but then they show cold air from the Fraser River Valley. Wrong, wrong, wrong. And then they make the same mistake about "condensed water vapor" coming off the Pacific and repeat the error of the water being about one mile off the ocean. **The quality of the scientific "journalism" in the Seattle Times is now so poor that you really can't trust what you read in it.   Just a shame.**
cliffmass.blogspot.com
October 30, 2025 at 1:35 PM
The Storm Has Arrived
 The promised storm has begun.  Tens of thousands of customers have already lost power, mainly in the southern Puget Sound region at this point...and more will surely follow. The composite weather radar image is extraordinary (see image around 7:40 PM below).  The low center was then along the central Washington coast.  We can only see this because of the Langley Hill radar near Hoquium (thanks, as always, to Senator Cantwell for helping to make that radar a reality). A few hours earlier, the low center was also evident in visible satellite imagery (below). As of 7 PM, winds have exceeded 70 mph on the coast and at Crystal Mountain, with and over 50 mph over the south Sound area (see below). With low pressure along the coast and higher pressure inland, strong easterly winds from the east descended the western slopes of the Cascades, contributing to power outages from Issaquah and Black Diamond to Enumclaw and out to the Sound. This has resulted in massive power outages in these locations (see Puget Sound Energy outage map at 7:30 PM) In Seattle, only about 850 customers have lost power. The numbers increase greatly in the hours ahead. The latest UW/Seattle Windwatch prediction of maximum winds in Seattle suggests that winds will peak around midnight, as the low center passes to the north (see prediction below).    This early in the season, with lots of leaves on the trees and untested new growth, one can expect substantial power loss with such winds. Showtime in 2-3 hours for central Puget Sound.  Time to make sure all my devices are charged up.
cliffmass.blogspot.com
October 30, 2025 at 1:35 PM
Potential for Power Outages Saturday Night/Sunday Morning
**Local power companies should organize their supplies and ensure they are fully staffed starting around 6 PM tomorrow (Saturday).** I**f you live in western Washington, I would charge up your phones and other devices.** A significant blow is coming from a Pacific cyclone making landfall on southern Vancouver Island. **The first strong wind of the season, particularly in October, is always a problem.  **  There has been substantial growth over the spring/summer that has yet to be tested by strong winds. Many trees still have leaves, which catch the wind better than the leafless situation later in the winter. The University of Washington modeling system (WRF) predicts a 986 hPa low-pressure system west of the Washington coast at 10 AM Saturday (see below).   On this chart, the lines of isobars (lines of constant sea-level pressure) and the wind speeds (gusts, knots) are indicated by color shading.  Big pressure changes and strong winds (gusts to 60 kt) are south and west of the low center. Classic for an ocean cyclone. As the low moves into southwestern British Columbia, an intense pressure variation (gradient) will move into western Washington (see forecast for 11 PM Saturday night), which will produce strong winds over the region. The strongest winds so far this autumn. How strong?  In Seattle, the best way to find out is by going to the City of Seattle Windwatch website (below), which uses multiple weather models to visualize the strong winds over Seattle (below). Late Saturday and early Sunday, the f**orecast gusts exceed 40 mph**.  My rule of thumb is that early in the season, power outages start with 30 mph gusts and are certain with 40 mph gusts. Over western Washington, the winds will come in two steps. Step one, around 11 PM, will have strong southerly winds (blue colors) from Everett southward (shown below). The second act, a few hours later, will have strong westerly (from the west) winds surging eastward in the Strait of Juan de Fuca, hitting NW Washington _ _ Strong southerly winds will also push northward in eastern Washington (wind gusts over the entire state at 2 AM Sunday are shown below) Puget Sound Energy, Seattle City Light, and other utilities should be ready. I don't want to hype this event. It is not the Columbus Day storm by any means, but it will have impacts. Finally, as the low moves past us, air temperatures will cool, and substantial snow is expected in the Cascades.    Snowfall totals through 5 PM Sunday are shown below **The good news in all this is that wildfire season is over in Washington, and our water resources are rapidly growing again. Large amounts of precipitation are being forecast for the next ten days over our region.** Serious storms....midlatitude cyclones...are now predicted
cliffmass.blogspot.com
October 30, 2025 at 1:35 PM
Multiple Atmospheric Rivers and Substantial Precipitation
 During the next weeks, a series of potent plumes of moisture (water vapor), commonly known as  atmospheric rivers, will be arriving on the West Coast, and we in the Pacific Northwest will get a substantial taste of it. Much of the arriving moisture will have traveled thousands of miles from Southeast Asia! Let me show you forecasts of these atmospheric rivers.  Red colors indicate the most potent areas of water vapor.  At 6 PM tonight (Tuesday), there is an atmospheric river with a tail that extends thousands of miles to the west. Here is a moisture channel view of the atmospheric river tonight.  You will notice the moisture plume heads northwestward into the Gulf of Alaska, where it circles around a large low-pressure center..  Another stream of moisture is apparent far to the west, starting near SE Asia. Thursday morning, another atmospheric river is extending into southwest BC Next Monday, a potent, intense river will push into north/central California And the following Friday, a strong river hits the northwest Still there there on Sunday morning. These atmospheric rivers will bring lots of precipitation to our region.  Below is the total through Sunday morning.   Our regional mountains get hit pretty hard.  Even more during the next week (not shown). The latest seasonal forecats are for wetter than normal conditions over the Northwest this winter (see below).  Not surprising for a La Nina year.
cliffmass.blogspot.com
October 30, 2025 at 1:35 PM
A Double Convergence Zone and the Upcoming Election in Seattle
Western Washington is the land of mountain-forced atmospheric convergence.  Convergence that can produce localized heavy showers and even thunderstorms. As shown in the figure below, when the low-level airflow off the Pacific is from the northwest, air is forced around the Olympics and then converges over central Puget Sound.   This convergence pushes air upwards, producing clouds and showers (see below). Another convergence zone frequently develops east of southern Vancouver Island as air moving down the Strait of Juan de Fuca converges with air pushing southward down the Strait of Georgia. The radar image around 4 PM today clearly showed both features: Both convergence zones were very evident in the visible satellite imagery around the same time (see below).  One amazing aspect of these convergence lines is how far east they extend:  over and to the east of the Cascade crest! Think about it....folks in Wenatchee or Ellensburg can have added clouds and showers due to the local effects of the Olympics!  Who would have thought? The southern feature, the Puget Sound Convergence zone, even had some thunderstorms, which were picked up by satellite lightning sensors (see the infrared satellite image below, with lightning strokes). To show you how far numerical weather prediction has come, the FORECAST radar image at 5 PM from a simulation from yesterday is shown below.  Both convergence zones are there!  Couldn't do this 20 years ago. Finally, the convergence zones produced two areas of localized rainfall, as shown below (only amounts greater than a third of an inch are shown).   Heavy rain in the mountains with these features. ______________________________ **The Seattle Election  ** There is a stark choice between candidates for City Attorney and Mayor, with Ann Davidson and Bruce Harrell being far and away the best individuals for these positions. _City Attorney_ Ann Davidson has done an extraordinary job as City Attorney.  I am a numbers person, and the numbers show that Ann Davidson's leadership has produced excellent results.  Ann entered office in 2022.    Filing times for Domestic Violence cases dropped almost immediately. Retail theft charge rates rose substantially.  Very important for keeping local businesses alive. And the number of prolific offenders dropped substantially. Ann Davidson's opponent seems to think the race is about Trump.  It is not. It is about public safety in Seattle. I don't agree with the Seattle Times on everying, but they are very correct about Ann Davidson: _Seattleites who want a competent leader who prioritizes public safety and understands the bounds of the office ought to reelect Davison._ _Davison is a solid public servant with a strong track record. To ensure a better city, she deserves reelection._ _Mayorial Race_ The choice for mayor is similarly easy.  Bruce Harrel has deep experience with our city.  He grew up here, was on the City Council for over a decade,  and now has substantial experience in managing a large complex government.   He has made some mistakes, but appears to have learned from them. In contrast, Katie Wilson has never been elected to any office.  She has never managed a large enterprise of any kind.   Her major initiatives are to tax the rich and use the funds for "affordable housing."   Perhaps she hasn't noticed the massive amounts of apartments and house units that have been built during the past decade, or that adding massive numbers of very low-cost housing will attract large numbers of folks **from outside the city**.  She does not appear to understand that much of the homeless problem is driven by drug use and mental illness. Ms. Wilson also has very unsettling opinions about Jews and Israel, accusing Israel of genocide and calling for Seattle to divest from Israel.   Such genocide claims reflect a prejudice incompatible with the leadership of a diverse American City.
cliffmass.blogspot.com
October 30, 2025 at 1:35 PM
The BLOB is Dying
 I have gotten several worried emails from readers this week, asking about the health of the BLOB--an area of warmer-than-normal water off our coast. Unfortunately, I have some sad news: the BLOB is weakening rapidly.  It may not have long to live. Let's go back a month, to September 17. The map below shows the difference in the sea surface temperature from normal.    A big area of warmer-than-normal temperatures offshore of the West Coast. The BLOB LIVES. One month later (yesterday), the story is very different, with a very weakened BLOB.  Hardly any reds just offshore and even some blues---which indicated cooler than normal temperatures. Below is the change in sea surface temperature for the past week, with blues indicating substantial cooling.    The BLOB's days are numbered. The cause of this change is the rapid increase in storms over the Northwest Pacific.  Storms that mix colder water from below to the surface. Storms like the one over the Gulf of Alaska as I write this (see below). A storm that will rev up and produce strong winds (green and blue colors) over the Pacific (see wind gust forecast tomorrow around 5 PM).  Winds that will mix the upper ocean and produce rapid surface cooling. At this point in time, with a rapidly weakening blob, there is little reason to expect warmer-than-normal waters to our west at the start of winter.
cliffmass.blogspot.com
October 30, 2025 at 1:35 PM
The Snow Season Begins
**  The image from the Crystal Mountain cam this afternoon said it all:  substantial snow had fallen over and to the east of the Cascade crest yesterday and this morning.** Another way to appreciate the change is to look at the snow water equivalent (water content of the snowpack) over the past two days.   At 11 PM Saturday, there was essentially no snow over western Washington State, except for the tops of major volcanic peaks By 11 PM Sunday night, light now covered the higher elevation of the Cascades and Olympics, as well as the eastern slopes of the Cascades. So much snow fell on Blewett Pass (at 4000 ft), south of Leavenworth, that they had to close the road (US 97) for a while! The fact that cold easterly winds (from the east) were forced to rise on the eastern side of the Cascades, producing clouds and precipitation on that side, was made obvious by the visible satellite image this morning (below).  For a change, western Washington was in the lee rain shadow! Temperatures have substantially dropped over the mountains during the past several days. Over the past week, temperatures at Stampede Pass (in the central Cascades) rose to around 60°F on October 7-8.   This morning it was around freezing! At Camp Muir, located around 10,000 ft,  the temperatures this morning were in the teens: **If you want to enjoy outdoor activity, I would suggest you do it during the next few days.   ** ** ** The weather will go downhill on Friday and over the weekend.
cliffmass.blogspot.com
October 27, 2025 at 1:33 PM
The Greatest Bird Migration on Record! Weather Played a Major Role.
**T he greatest southward bird migration on record in the U.S. occurred on Wednesday night, and weather played a major role.** Today, the key tool for tracking bird migration is weather radar.   And there is a wonderful website...**BirdCast**.... that provides real-time, radar-based estimates of bird migration. On Wednesday night at 10 PM EST, the BirdCast estimated migration was an incredible 1.25 BILLION birds, the largest number ever observed (radar only goes back to the mid-90s. The center of the migration was over the southeast U.S. (see map above). But why there?  It turns out that the weather played an important role. Seasonally, migration peaks from approximately mid-September to mid-October over the southeast U.S., according to BirdCast.   So we are in the season. But there was a major weather assist as well.   A strong front had just moved south, with a huge high-pressure area to its north (see  surface weather map below) Just a pattern with high pressure to the north and lower pressure to the south produces strong northerly (from the north) winds in the lower atmosphere...a boon to birds heading south for the winter. Below are the forecast winds for 8 PM EST on Wednesday night at around 5000 ft (850 hPa pressure).  Winds were from the northeast to the southwest.  **Blowing in the direction the birds were headed.** According to many sources I reviewed, birds like rising pressure without precipitation. **Exactly the conditions observed on Wednesday evening.** Let me show you a sample radar image from Fr. Campbell, KY, just after midnight. The sky was filled with intense bird echoes. Finally, what about bird migration over the Northwest,  you ask?  At 7:50 PM Saturday night, the Northwest migration was a shadow of the bird movement of the eastern US, with our wet, stormy weather not a positive for our bird friends.
cliffmass.blogspot.com
October 25, 2025 at 1:31 PM
Serious Snow Coming to Regional Mountains
_Note:   Announcement at the End_ It is not unusual for the first notable snow to fall in the Northwest mountains around the middle of October, and this year will be no different. Today's view from the top of Crystal Mountain, east of Mt. Rainier, is snow-free (see below). **It won't be that way for long.** A pulse of cold air will push into Washington State on Sunday and Monday, accompanied by moisture coming from the Pacific-- the result will be snow above approximately 4000 ft, with some flurries reaching 3000 ft.  And plenty of rain in the lowlands. The snow total from the high-resolution UW WRF model through Sunday morning is shown below.  High elevation snow in the Cascades with more and lower-level snow on the eastern side of the Rockies. **This is just the start.** By Tuesday morning, substantial snow will fall on the Cascade crest and its eastern slopes....as well as the mountains of NE Washington.  At some locations:  5-10 inches! Extensive snow over and to the east of the Rockies. Looking at the forecast temperatures at Stampede Pass, at around 4000 ft in the Cascades (below), we see the high temperature on Sunday will only reach 38°F.    With wet snow, it won't feel like summer anymore. **The origin of the cool air?   From the Arctic!** On Saturday and Sunday, cold air will push southward over western Canada.  The map below shows the predicted temperatures around 5000 ft (850 hPa pressure) with the purple colors indicating very cold air (below 20°F).  From the Arctic to you! On Monday morning, with low pressure along the Oregon coast and cold, high pressure over British Columbia and Alberta, cold air will be pushed westward across northern WA state (see map around 5000 ft below, with blue colors indicating cold air).   Winds are also shown, as are heights on the 850 hPa pressure surface (you can think of it as pressure around 5000 ft). **But why think only about snow?**    The total precipitation by Tuesday morning is shown below.  Substantial amount (as much as 1-2 inches)  from the Cascade crest westward, associated with moisture circling around a low offshore. This represents the end of our wildfire season--which will be welcome by all. **Announcement** I will hold a special online Zoom session at 10 AM on Saturday for Patreon supporters.  Will answer questions and talk in detail about the outlook for the coming winter ______________________ Get outside and enjoy the weather with Play Tennis Seattle. Find nearby hitting partners, coaches, classes, and join the Seattle tennis community. https://www.joinplaytennis.com/seattle
cliffmass.blogspot.com
October 23, 2025 at 1:16 PM
The Last 70 Degree Day of the Year?
**It is a bit depressing....** Today is probably the warmest day for the rest of the year in western Washington. **The last day temperatures in western Washington rise into the 70s.** The high temperatures today (Tuesday) are shown below. Lots of 70s around Puget Sound, with some low 80s over SE Washington.   Similar in eastern Washington.   It was wonderful. Such temperatures are well above average and will plummet tomorrow as cool ocean air pushes inland.  And such warm temperatures will not return this fall. To show you this depression situation, consider the latest surface temperature forecasts at Seattle and Pasco for the next 10 days (below). Seattle HIGH temperatures will be in the low 60s and upper 50s through October 18.   This will feel quite chilly after the warmth of last summer. Pasco will start in the low 70s the next few days and then decline into the 60s.  A series of frontal systems will be moving through during this period, with rain spreading over our region.   For example, the total precipitation through Monday morning is quite substantial over the Oregon Cascades and the north Washington Cascades. Obviously, this cool/wet weather will speed up the decline of the few remaining wildfires in the region. The Northwest Interagency Coordinating Center has a graphic of the flammability of surface fuels (called ERC).   All regions of the area will become MUCH LESS flammable (going from red to blue in the graphic below). Since the burned acreage this year is currently below normal over the region, we are guaranteed to end this year on the low side. ______________________ Get outside and enjoy the weather with Play Tennis Seattle. Find nearby hitting partners, coaches, classes, and join the Seattle tennis community. https://www.joinplaytennis.com/seattle
cliffmass.blogspot.com
October 21, 2025 at 1:14 PM
Changes in Ocean Temperatures
Several of you have asked about the ocean surface temperatures this year, so this blog will explore that issue. Let's start with the current sea surface temperature (SST) over the northeast Pacific (below). Cool surface water along the West Coast is due to the upwelling (upward motion) of cold water from below.  Cool water is also found to the north over the Gulf of Alaska. You have to go south of Baja California to get the really warm stuff. **How unusual are these sea surface temperatures?** The next plot shows the difference from normal for this time of the year....also known as the anomaly. Temperatures are actually a bit (about 1-1.5C) warmer than normal along the West Coast. But cooler than normal in the Gulf of Alaska. The sea surface temperatures are changing rapidly now due to the revving up of storm systems in the Gulf of Alaska, which are stirring the water in the vertical, bringing cooler water to the surface. This is an example of the kind of storm action (from Sept 27) that is doing the mixing. Consider the changes in the SST over the past week (below). Wow.  In some locations, temperatures have cooled by more than 2.5C (4.5 F) in that short time.  On the other hand, some warming along the West Coast. Why coastal warming along the coast?  Because low centers in the Gulf of Alaska weaken the northerly (from the north) winds along the West Coast, which reduces the upwelling of cool water from below. Expect more offshore ocean cooling during the next few weeks as air temperatures cool and the storminess increases. Talking of cooling, there should be substantial cooling over the tropical Pacific as a moderate La Niña develops. Meteorologists often look at a special zone in the central tropic Pacific (the Nino 3.4 area) (see below) This area is now cooler than normal (blue colors in the figure below) And the latest NOAA forecasts are for the cooling to strengthen. At least, the Northwest will be relatively warm for the next few days before more wet/cool weather comes in this weekend. ______________________ Get outside and enjoy the weather with Play Tennis Seattle. Find nearby hitting partners, coaches, classes, and join the Seattle tennis community. https://www.joinplaytennis.com/seattle
cliffmass.blogspot.com
October 19, 2025 at 3:50 PM