


Clark Evans
@clarkevanswx.bsky.social
I study high-impact weather, help develop high-resolution models to improve weather forecasts, and mentor scientists. Constantly striving to help those around me flourish. My views expressed here are mine alone.
That’s…not at all how this works. As the NHC’s wind field image shows, Jamaica is only experiencing tropical storm-force winds right now, with weaker winds elsewhere. The most widespread and longest-lasting impact has and will be extreme rain - for which the prep is rather different than wind.

October 27, 2025 at 7:43 PM
That’s…not at all how this works. As the NHC’s wind field image shows, Jamaica is only experiencing tropical storm-force winds right now, with weaker winds elsewhere. The most widespread and longest-lasting impact has and will be extreme rain - for which the prep is rather different than wind.
Independent of the intensifying vortex, we'd expect an aircraft to sample faster winds closer to the surface (and above the boundary layer) for a warm-core vortex; e.g., the enclosed image. Is this difference (~2%?) small enough to be outweighed by other observational uncertainties, however? (2/2)

October 27, 2025 at 5:14 PM
Independent of the intensifying vortex, we'd expect an aircraft to sample faster winds closer to the surface (and above the boundary layer) for a warm-core vortex; e.g., the enclosed image. Is this difference (~2%?) small enough to be outweighed by other observational uncertainties, however? (2/2)
In case you're curious, here's a figure from a 2003 paper by @franklinjamesl.bsky.social et al. documenting the fractional reduction of the 300-700 m average wind speeds near the surface. For the most intense TCs, the surface (10-m) winds are ~82% of the 300-700 m average wind speed.

October 27, 2025 at 5:06 PM
In case you're curious, here's a figure from a 2003 paper by @franklinjamesl.bsky.social et al. documenting the fractional reduction of the 300-700 m average wind speeds near the surface. For the most intense TCs, the surface (10-m) winds are ~82% of the 300-700 m average wind speed.
#Melissa continues to intensify, with the current recon eye penetration documenting 161 kt winds at flight level in the northeastern eyewall and an extrapolated minimum sea-level pressure of 905.6 hPa.

October 27, 2025 at 3:59 PM
#Melissa continues to intensify, with the current recon eye penetration documenting 161 kt winds at flight level in the northeastern eyewall and an extrapolated minimum sea-level pressure of 905.6 hPa.
And a sonde from the southeastern eyewall. It measured a surface wind of 125 kt, but 153 kt only 10 hPa (about 100 meters) above the surface.
The northwestern eyewall is where we’d expect the fastest winds for a westward-moving storm, so altogether, #Melissa is close to category-5 intensity.
The northwestern eyewall is where we’d expect the fastest winds for a westward-moving storm, so altogether, #Melissa is close to category-5 intensity.

October 27, 2025 at 6:19 AM
And a sonde from the southeastern eyewall. It measured a surface wind of 125 kt, but 153 kt only 10 hPa (about 100 meters) above the surface.
The northwestern eyewall is where we’d expect the fastest winds for a westward-moving storm, so altogether, #Melissa is close to category-5 intensity.
The northwestern eyewall is where we’d expect the fastest winds for a westward-moving storm, so altogether, #Melissa is close to category-5 intensity.
Here’s the first eye sonde from the overnight #Melissa recon flight. 925 hPa at the surface with a 16 kt wind is about 923 hPa at the true center - in line with the flight-level extrapolation.

October 27, 2025 at 6:11 AM
Here’s the first eye sonde from the overnight #Melissa recon flight. 925 hPa at the surface with a 16 kt wind is about 923 hPa at the true center - in line with the flight-level extrapolation.
New recon flight into #Melissa just finished its first eyewall traverse, SE-NW. Minimum extrapolated SLP of 923.2 hPa, max flight-level winds of 140 kt, and 700-hPa height of 2504 m.

October 27, 2025 at 6:01 AM
New recon flight into #Melissa just finished its first eyewall traverse, SE-NW. Minimum extrapolated SLP of 923.2 hPa, max flight-level winds of 140 kt, and 700-hPa height of 2504 m.
After fixing a week-long backend issue, I added Google's DeepMind (GDMI) to my tropical cyclone models site's (uwm.edu/hurricane) automated real-time verification suite. Pictured below is for #Melissa.
Caveat: this is not a matched verification, so the samples differ between models.
Caveat: this is not a matched verification, so the samples differ between models.


October 24, 2025 at 8:32 PM
After fixing a week-long backend issue, I added Google's DeepMind (GDMI) to my tropical cyclone models site's (uwm.edu/hurricane) automated real-time verification suite. Pictured below is for #Melissa.
Caveat: this is not a matched verification, so the samples differ between models.
Caveat: this is not a matched verification, so the samples differ between models.

And speaking of catalysts and storms named Philippe - 2005’s annihilation of Philippe by an upper-level low spurred by Rita’s outflow fascinated me and helped foster a long-lasting interest in how TCs modify their environments and sometimes indirectly interact with each other.

October 2, 2025 at 6:37 AM
And speaking of catalysts and storms named Philippe - 2005’s annihilation of Philippe by an upper-level low spurred by Rita’s outflow fascinated me and helped foster a long-lasting interest in how TCs modify their environments and sometimes indirectly interact with each other.
In many ways, the 1995 hurricane season was the catalyst for my interest in tropical cyclones. The swallowing of Karen by Iris definitely contributed to that interest. Here's an archived GOES-8 image about a day before Iris swallowed Karen. The two TCs are east-southeast of Bermuda at this time.

October 2, 2025 at 6:16 AM
In many ways, the 1995 hurricane season was the catalyst for my interest in tropical cyclones. The swallowing of Karen by Iris definitely contributed to that interest. Here's an archived GOES-8 image about a day before Iris swallowed Karen. The two TCs are east-southeast of Bermuda at this time.
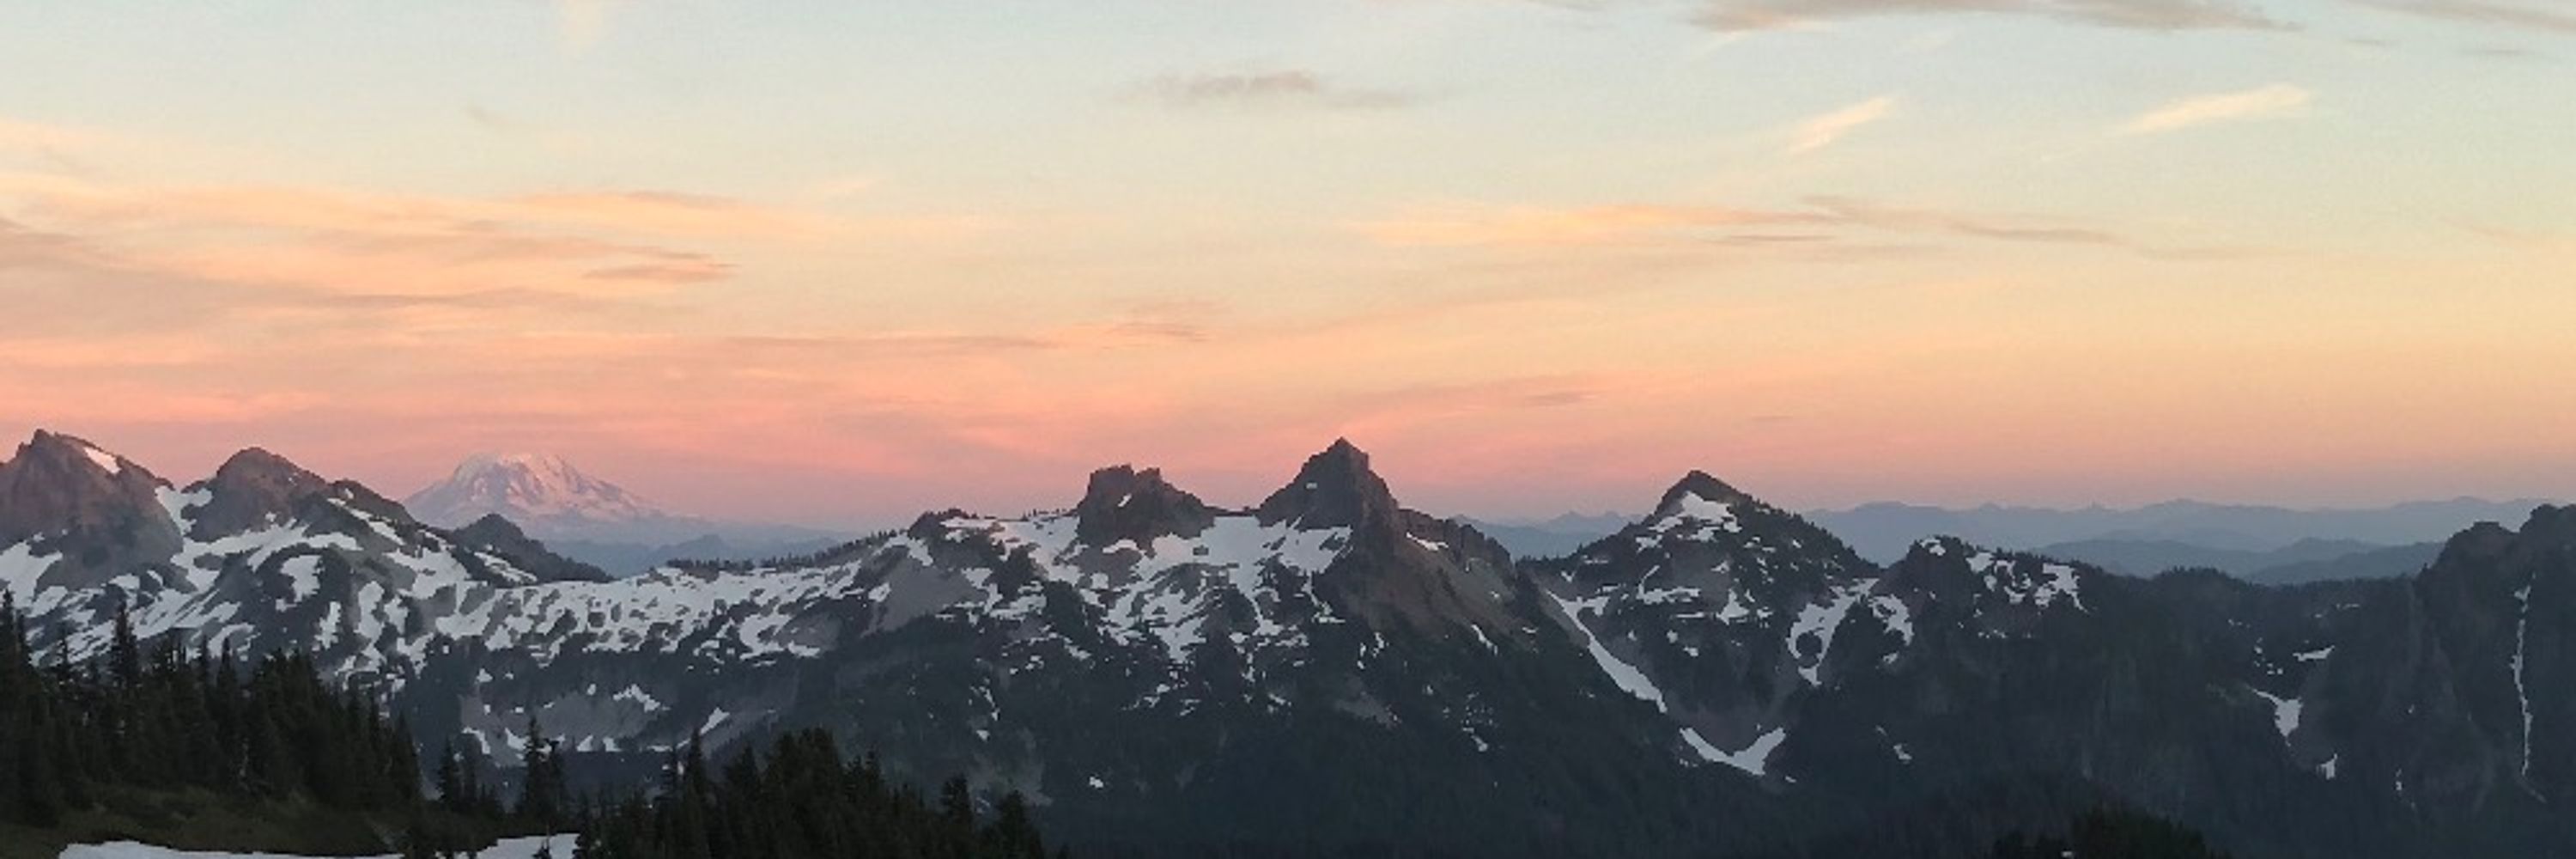
As we go off into the great unknown, the atmosphere was kind enough to provide a moment of zen. Be well, friends.
October 1, 2025 at 5:32 AM
As we go off into the great unknown, the atmosphere was kind enough to provide a moment of zen. Be well, friends.
My friend and former colleague at UWM, Sergey Kravtsov, is looking to hire *two* postdoctoral fellows, one in climate dynamics and the other in data-driven modeling for global precipitation. Please see the advertisements below for more details and share with your networks!
![The School of Freshwater Sciences at the University of Wisconsin-Milwaukee invites
applications for a Postdoctoral Associate position in the area of climate science. The
successful candidate will use idealized numerical simulations to study the multi-scale
climate dynamics in the Southern Ocean region. The appointment is full-time, available
starting November 1, 2025, and is for an initial period of one year, with potential renewal
based on performance and funding.
The Postdoctoral Associate is expected to: (i) run numerical simulations of the Southern
Ocean’s coupled climate system using the Moist Quasi-Geostrophic Model version 2.0
(MQ-GCM2.0); (ii) develop modifications to MQ-GCM2.0 to best match the parallel state-
of-the-art model experiments and observations over the region of interest; (iii) analyze
model output and use the so-called interactive ensemble technique to understand the
underlying dynamics; (iv) collaborate closely with other team members; and (v) publish
findings in peer-reviewed journals and present results at scientific conferences.
Candidates should hold a Ph.D. in Atmospheric Science, Physical Oceanography or
related discipline, with demonstrated expertise in numerical modeling and data analysis.
Strong communication skills and a record of peer-reviewed publications are expected.
To apply, please send a cover letter, CV, and contact information for [2–3] references
to kravtsov@uwm.edu. Review of applications will begin on October 1 and continue until
the position is filled.
The University of Wisconsin is an Equal Opportunity Employer. Applicants and employees
are protected from discrimination according to the Federal law. Click here for additional
information.
Sergey Kravtsov, Ph.D.
Professor, School of Freshwater Sciences
University of Wisconsin-Milwaukee
600 E. Greenfield Ave
Milwaukee, WI 53204
Mobile: 414-477-3306
E-mail: kravtsov@uwm.edu
Web: https://sites.uwm.edu/kravtsov](https://cdn.bsky.app/img/feed_thumbnail/plain/did:plc:ukwpmxrglutvhoa5r2lcffbs/bafkreia7ikpr4nib7vzwlsgsnf6lnyodrczt27sjxtunggcdmza7kknjai@jpeg)
![The School of Freshwater Sciences at the University of Wisconsin-Milwaukee invites
applications for a Postdoctoral Associate position in the area of Atmospheric Science with
the focus on empirical modeling of weather and climate. The successful candidate will
apply linear and non-linear data-driven techniques for the global simulation and
subseasonal forecasting of precipitation and temperature. The appointment is full-time,
available starting November 1, 2025, and is for an initial period of one year, with potential
renewal based on performance and funding.
The Postdoctoral Associate is expected to: (i) develop improvements to the existing yet
experimental methodology of data-driven high-resolution modeling of global precipitation
and temperature based on linear inverse models; (ii) quantify the updated model’s
performance in reproducing the statistics of the observed variability and assess its
prediction skill; (iii) analyze model dynamics to explain the sources of skill; (iv) collaborate
closely with other team members; and (v) publish findings in peer-reviewed journals and
present results at scientific conferences.
Candidates should hold a Ph.D. in Atmospheric Science or related discipline, with
demonstrated expertise in big data analysis and data-driven modeling. Strong
communication skills and a record of peer-reviewed publications are expected.
To apply, please send a cover letter, CV, and contact information for [2–3] references
to kravtsov@uwm.edu. Review of applications will begin on October 1 and continue until
the position is filled.
The University of Wisconsin is an Equal Opportunity Employer. Applicants and employees
are protected from discrimination according to the Federal law. Click here for additional
information.
Sergey Kravtsov, Ph.D.
Professor, School of Freshwater Sciences
University of Wisconsin-Milwaukee
600 E. Greenfield Ave
Milwaukee, WI 53204
Mobile: 414-477-3306
E-mail: kravtsov@uwm.edu
Web: https://sites.uwm.edu/kravtsov](https://cdn.bsky.app/img/feed_thumbnail/plain/did:plc:ukwpmxrglutvhoa5r2lcffbs/bafkreib7qooxqyi7gf2pqzr3nol6owzr7rgd254dpozlfbfaj4sfmt54eq@jpeg)
September 19, 2025 at 3:02 AM
My friend and former colleague at UWM, Sergey Kravtsov, is looking to hire *two* postdoctoral fellows, one in climate dynamics and the other in data-driven modeling for global precipitation. Please see the advertisements below for more details and share with your networks!
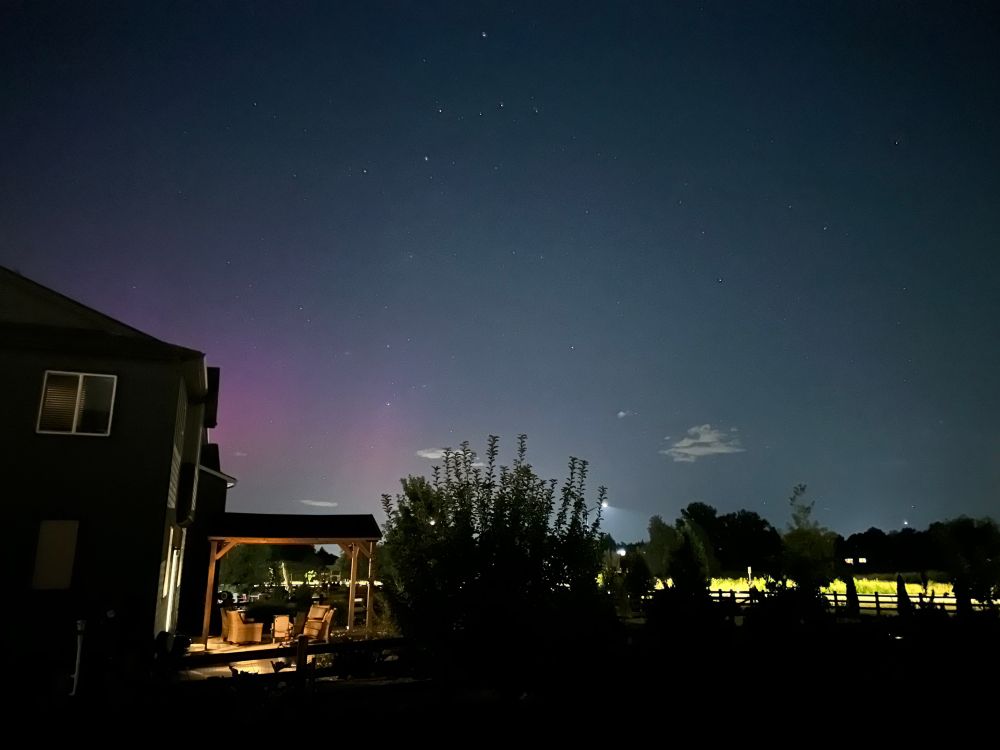
Faint hint of the northern lights at 40°N in Colorado.
September 15, 2025 at 2:28 AM
Faint hint of the northern lights at 40°N in Colorado.
I'm so excited for my friend and colleague, Jon Kahl, named as the recipient of this year's @ametsoc.org Edward N. Lorenz Teaching Excellence Award! I learned so much from Jon in my 13 years at UWM, and it was an honor to lead his nomination. A full reflection (alt text included):

August 28, 2025 at 4:50 AM
I'm so excited for my friend and colleague, Jon Kahl, named as the recipient of this year's @ametsoc.org Edward N. Lorenz Teaching Excellence Award! I learned so much from Jon in my 13 years at UWM, and it was an honor to lead his nomination. A full reflection (alt text included):
Although when normalized by the CLP5 error, the NHC official track errors are a bit below the 2019-23 mean improvement (black dashed line in the right panel):

August 20, 2025 at 2:52 AM
Although when normalized by the CLP5 error, the NHC official track errors are a bit below the 2019-23 mean improvement (black dashed line in the right panel):
To complement Brian’s analysis, here’s a heat map of NHC official forecast errors for Erin’s duration so far. Great intensity forecasts for the most part - just not for anything verifying today (all of the yellow along the lower-right to upper-left diagonal in the right panel).

August 16, 2025 at 11:15 PM
To complement Brian’s analysis, here’s a heat map of NHC official forecast errors for Erin’s duration so far. Great intensity forecasts for the most part - just not for anything verifying today (all of the yellow along the lower-right to upper-left diagonal in the right panel).
To build on Philippe's post, time to put on my MPAS evangelist hat 😅
We're running daily global MPAS forecasts during this year's hurricane season, with 3-km grid spacing across the Atlantic. Here are 78-, 54-, and 30-h forecasts from 3 successive forecasts of ex-Dexter. Pretty consistent signal!
We're running daily global MPAS forecasts during this year's hurricane season, with 3-km grid spacing across the Atlantic. Here are 78-, 54-, and 30-h forecasts from 3 successive forecasts of ex-Dexter. Pretty consistent signal!


August 9, 2025 at 4:18 PM
To build on Philippe's post, time to put on my MPAS evangelist hat 😅
We're running daily global MPAS forecasts during this year's hurricane season, with 3-km grid spacing across the Atlantic. Here are 78-, 54-, and 30-h forecasts from 3 successive forecasts of ex-Dexter. Pretty consistent signal!
We're running daily global MPAS forecasts during this year's hurricane season, with 3-km grid spacing across the Atlantic. Here are 78-, 54-, and 30-h forecasts from 3 successive forecasts of ex-Dexter. Pretty consistent signal!
A collection of weather-themed books to help children understand their emotions? Yes, please.

August 7, 2025 at 4:14 AM
A collection of weather-themed books to help children understand their emotions? Yes, please.


I always come back to this image from NCAR when seeking to introduce the idea that predictability is a function of the scale of the event. Individual thunderstorms have low practical and inherent predictability; we simply cannot *reliably* predict when and where they will occur beyond a few hours.

July 6, 2025 at 12:41 AM
I always come back to this image from NCAR when seeking to introduce the idea that predictability is a function of the scale of the event. Individual thunderstorms have low practical and inherent predictability; we simply cannot *reliably* predict when and where they will occur beyond a few hours.
Similar to other 1200 UTC guidance, GSL's MPAS_RRFSA - available on PivotalWx as GSL MPAS-G - forecast a high-end damaging wind event in the DFW metroplex late Sunday, with widespread 10-m wind gusts over 90 kt (103.5 MPH). The 1800 UTC forecast shifted north, a few hours earlier, and a tad weaker.

June 8, 2025 at 4:56 AM
Similar to other 1200 UTC guidance, GSL's MPAS_RRFSA - available on PivotalWx as GSL MPAS-G - forecast a high-end damaging wind event in the DFW metroplex late Sunday, with widespread 10-m wind gusts over 90 kt (103.5 MPH). The 1800 UTC forecast shifted north, a few hours earlier, and a tad weaker.
The daughter of one of my branch members (and an invaluable part of GSL), Haiqin Li, is participating in the National Spelling Bee in DC this week. Good luck, Blanche, and safe travels to the entire Li family! spellingbee.com

May 26, 2025 at 5:44 AM
The daughter of one of my branch members (and an invaluable part of GSL), Haiqin Li, is participating in the National Spelling Bee in DC this week. Good luck, Blanche, and safe travels to the entire Li family! spellingbee.com