


Gurman Bhatia
@chartwaali.bsky.social
Building @revisual.co - one of India's first information design studios / Chart maker, information designer and developer, data journo, trainer #dataviz
Reposted by Gurman Bhatia
What started as a chat over gobhi ke parathe has grown into VizChitra, India’s first community-run data visualization conference📈🎉
Here’s a peek at #VizChitra2025 in action👀 — the hands, minds & stories that made it all come alive 💡📊
Here’s a peek at #VizChitra2025 in action👀 — the hands, minds & stories that made it all come alive 💡📊

VizChitra 2025 Highlights | India's first community-run Data Visualisation Conference
YouTube video by VizChitra
www.youtube.com
October 6, 2025 at 3:38 PM
What started as a chat over gobhi ke parathe has grown into VizChitra, India’s first community-run data visualization conference📈🎉
Here’s a peek at #VizChitra2025 in action👀 — the hands, minds & stories that made it all come alive 💡📊
Here’s a peek at #VizChitra2025 in action👀 — the hands, minds & stories that made it all come alive 💡📊
Reposted by Gurman Bhatia

Today, @vonter.bsky.social and I launched cbfc.watch, an archive of over 100k censorship records for ~18k movies released in India since 2017. For the first time, you can search for any movie and see how they were modified before release.
The site is fun to explore, but here's some #dataviz in it!
The site is fun to explore, but here's some #dataviz in it!


September 14, 2025 at 6:33 PM
Today, @vonter.bsky.social and I launched cbfc.watch, an archive of over 100k censorship records for ~18k movies released in India since 2017. For the first time, you can search for any movie and see how they were modified before release.
The site is fun to explore, but here's some #dataviz in it!
The site is fun to explore, but here's some #dataviz in it!
Reposted by Gurman Bhatia

Team RVL met at Bangalore to attend @vizchitra.bsky.social (India’s first dataviz conference) and to celebrate our studio’s 2-year birthday + IIB Awards win! We spent the weekend with our full-time team and almost every contractor who has worked with us over the years 🎂
July 2, 2025 at 10:06 AM
Team RVL met at Bangalore to attend @vizchitra.bsky.social (India’s first dataviz conference) and to celebrate our studio’s 2-year birthday + IIB Awards win! We spent the weekend with our full-time team and almost every contractor who has worked with us over the years 🎂
Reposted by Gurman Bhatia
Our website has a new chart gallery! 📈📊📉
You can now browse through almost every chart from all our projects & filter them by chart function. Whether you’d like to draw inspiration, explore our projects, or just because you love charts. Stop by revisual.co/chart-gallery/ & look around! 👀
You can now browse through almost every chart from all our projects & filter them by chart function. Whether you’d like to draw inspiration, explore our projects, or just because you love charts. Stop by revisual.co/chart-gallery/ & look around! 👀
June 17, 2025 at 9:56 AM
Our website has a new chart gallery! 📈📊📉
You can now browse through almost every chart from all our projects & filter them by chart function. Whether you’d like to draw inspiration, explore our projects, or just because you love charts. Stop by revisual.co/chart-gallery/ & look around! 👀
You can now browse through almost every chart from all our projects & filter them by chart function. Whether you’d like to draw inspiration, explore our projects, or just because you love charts. Stop by revisual.co/chart-gallery/ & look around! 👀
Coming back from Miami where @datavizsociety.bsky.social hosted their annual conference Outlier and the Information is Beautiful awards. Absolutely ecstatic about @revisual.co winning Silver for "Outstanding Studio". We celebrated the award and our two year anniversary on the same day. :)


June 15, 2025 at 3:36 AM
Coming back from Miami where @datavizsociety.bsky.social hosted their annual conference Outlier and the Information is Beautiful awards. Absolutely ecstatic about @revisual.co winning Silver for "Outstanding Studio". We celebrated the award and our two year anniversary on the same day. :)
Reposted by Gurman Bhatia
Next at #outlier2025 is @chartwaali.bsky.social with her learnings about collaboration and setting up a successful (multi IIB award-nominated) company

June 11, 2025 at 2:10 PM
Next at #outlier2025 is @chartwaali.bsky.social with her learnings about collaboration and setting up a successful (multi IIB award-nominated) company
Very excited that I will be visiting Miami for Outlier and the IIB awards this year. @revisual.co has two shortlisted entires, and I will be diving deep into the behind the scenes of one of them for this talk. But mostly very excited to learn and be inspired from some lovely people!

Meet Gurman Bhatia, Founder of @revisual.co
Gurman will deliver a talk at #Outlier2025:
“The Whole Is Something Besides the Parts”
Explore the agenda: www.accelevents.com/e/outlier-20... #dataviz #datavisualization
Gurman will deliver a talk at #Outlier2025:
“The Whole Is Something Besides the Parts”
Explore the agenda: www.accelevents.com/e/outlier-20... #dataviz #datavisualization

May 26, 2025 at 2:10 PM
Very excited that I will be visiting Miami for Outlier and the IIB awards this year. @revisual.co has two shortlisted entires, and I will be diving deep into the behind the scenes of one of them for this talk. But mostly very excited to learn and be inspired from some lovely people!
Reposted by Gurman Bhatia

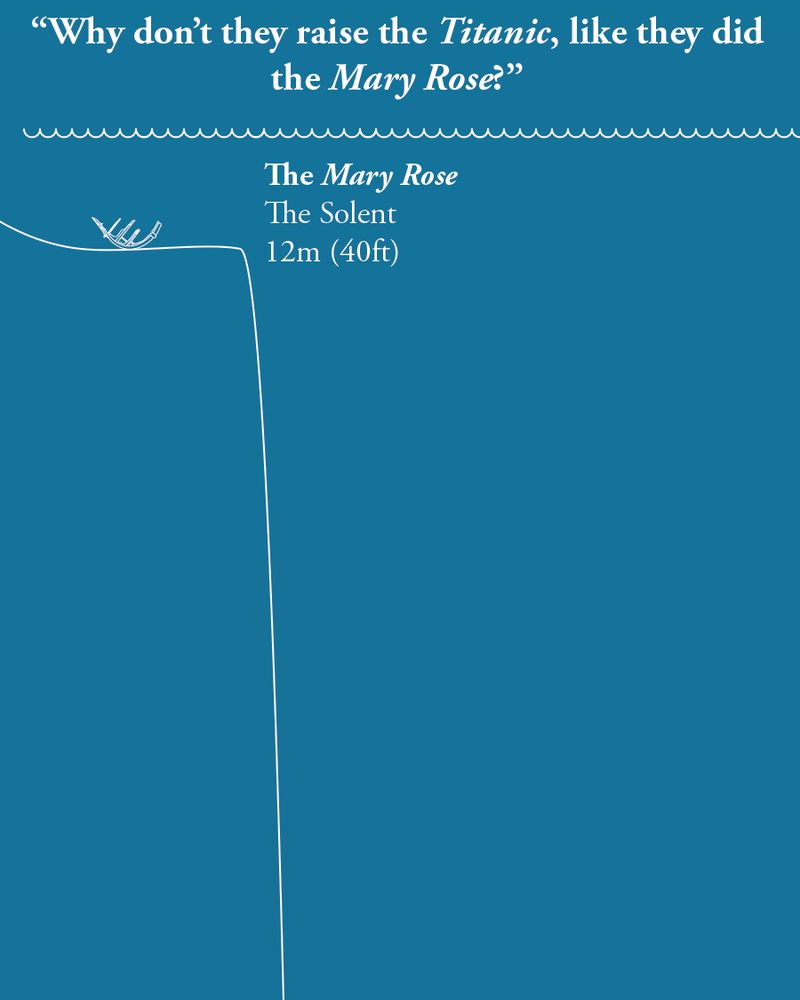
In data visualization design, we often assume the goal is to minimise the effort required to 'see' the data. And that adding support a title and annotation is the route to memorability.
But sometimes making something more effortful achieves memorability and understanding more effectively...
But sometimes making something more effortful achieves memorability and understanding more effectively...

On the anniversary of the sinking of the Titanic, we thought we'd answer a question that's often asked,
"If they raised the Mary Rose, why not raise the Titanic?"
Allow our scaled diagram to explain...
"If they raised the Mary Rose, why not raise the Titanic?"
Allow our scaled diagram to explain...
April 15, 2025 at 9:44 AM
In data visualization design, we often assume the goal is to minimise the effort required to 'see' the data. And that adding support a title and annotation is the route to memorability.
But sometimes making something more effortful achieves memorability and understanding more effectively...
But sometimes making something more effortful achieves memorability and understanding more effectively...
Reposted by Gurman Bhatia

Finally caught up with @chartwaali.bsky.social, founder of @revisual.co. We have those talks about once a year, but we should have more.
She's curious, a good listener, a born information designer and an important person in the dataviz field; someone who does great things and will do more.
She's curious, a good listener, a born information designer and an important person in the dataviz field; someone who does great things and will do more.

March 21, 2025 at 1:53 PM
Finally caught up with @chartwaali.bsky.social, founder of @revisual.co. We have those talks about once a year, but we should have more.
She's curious, a good listener, a born information designer and an important person in the dataviz field; someone who does great things and will do more.
She's curious, a good listener, a born information designer and an important person in the dataviz field; someone who does great things and will do more.
Reposted by Gurman Bhatia
The ISN-Global Kidney Health Atlas features:
• Interactive maps for global overviews
• Intuitive data visualisations for easy and quick comparison
• Region and country profiles for focused analysis
🌐 Explore the atlas here: gkha.theisn.org
• Interactive maps for global overviews
• Intuitive data visualisations for easy and quick comparison
• Region and country profiles for focused analysis
🌐 Explore the atlas here: gkha.theisn.org

International Society of Nephrology: ISN-Global Kidney Health Atlas
Explore comprehensive data on global kidney care readiness and delivery across countries and regions. Based on the International Society of Nephrology's worldwide survey, this interactive atlas helps ...
gkha.theisn.org
February 24, 2025 at 2:04 PM
The ISN-Global Kidney Health Atlas features:
• Interactive maps for global overviews
• Intuitive data visualisations for easy and quick comparison
• Region and country profiles for focused analysis
🌐 Explore the atlas here: gkha.theisn.org
• Interactive maps for global overviews
• Intuitive data visualisations for easy and quick comparison
• Region and country profiles for focused analysis
🌐 Explore the atlas here: gkha.theisn.org
Reposted by Gurman Bhatia
📊 Insight Out: Week 24 - Transforming a table about the energy performance of buildings into a visualisation of... buildings!
This week, we take you behind-the-scenes of a diagram we created for Godrej Design Lab and CEEW's Conscious Trends Report 2024.
This week, we take you behind-the-scenes of a diagram we created for Godrej Design Lab and CEEW's Conscious Trends Report 2024.

February 20, 2025 at 2:19 PM
📊 Insight Out: Week 24 - Transforming a table about the energy performance of buildings into a visualisation of... buildings!
This week, we take you behind-the-scenes of a diagram we created for Godrej Design Lab and CEEW's Conscious Trends Report 2024.
This week, we take you behind-the-scenes of a diagram we created for Godrej Design Lab and CEEW's Conscious Trends Report 2024.
Reposted by Gurman Bhatia
🚀 It’s a party, and you’re invited!
Join VizChitra's launch this Friday as @chartwaali.bsky.social and @rasagy.bsky.social share our origin story and dreams for India’s #dataviz community.
📌 Register now! Link in bio.
We look forward to seeing you there!🎉📊🤝
#DataDriven #Datafam #InfoDesign
Join VizChitra's launch this Friday as @chartwaali.bsky.social and @rasagy.bsky.social share our origin story and dreams for India’s #dataviz community.
📌 Register now! Link in bio.
We look forward to seeing you there!🎉📊🤝
#DataDriven #Datafam #InfoDesign


February 20, 2025 at 8:56 AM
🚀 It’s a party, and you’re invited!
Join VizChitra's launch this Friday as @chartwaali.bsky.social and @rasagy.bsky.social share our origin story and dreams for India’s #dataviz community.
📌 Register now! Link in bio.
We look forward to seeing you there!🎉📊🤝
#DataDriven #Datafam #InfoDesign
Join VizChitra's launch this Friday as @chartwaali.bsky.social and @rasagy.bsky.social share our origin story and dreams for India’s #dataviz community.
📌 Register now! Link in bio.
We look forward to seeing you there!🎉📊🤝
#DataDriven #Datafam #InfoDesign
Reposted by Gurman Bhatia
Four months ago, some of the coolest minds on the Indian internet asked: If data is the new soil, what will you grow?
That’s how @vizchitra.bsky.social was born. Now, we’re ready to share it with the world.
What is it? Who are we? What are we creating?
Stay tuned to find out! 🌱
That’s how @vizchitra.bsky.social was born. Now, we’re ready to share it with the world.
What is it? Who are we? What are we creating?
Stay tuned to find out! 🌱

February 18, 2025 at 3:21 AM
Four months ago, some of the coolest minds on the Indian internet asked: If data is the new soil, what will you grow?
That’s how @vizchitra.bsky.social was born. Now, we’re ready to share it with the world.
What is it? Who are we? What are we creating?
Stay tuned to find out! 🌱
That’s how @vizchitra.bsky.social was born. Now, we’re ready to share it with the world.
What is it? Who are we? What are we creating?
Stay tuned to find out! 🌱
Inside Divya’s brain!
🧠 Behind the Scenes
After many discussions with the report's authors, we finalised a city sketch that represented all key elements working together in harmony. The final illustration was created in Procreate by Divya Ribeiro. Here is a time-lapse of the drawing process!
After many discussions with the report's authors, we finalised a city sketch that represented all key elements working together in harmony. The final illustration was created in Procreate by Divya Ribeiro. Here is a time-lapse of the drawing process!
January 25, 2025 at 9:04 AM
Inside Divya’s brain!
Reposted by Gurman Bhatia
Our first complete calendar year since being founded, 2024 marked a year of growth, meaningful collaboration, rising to challenges, and learning for team RVL ✨
🧵 Some highlights from last year
🧵 Some highlights from last year

January 3, 2025 at 1:36 PM
Our first complete calendar year since being founded, 2024 marked a year of growth, meaningful collaboration, rising to challenges, and learning for team RVL ✨
🧵 Some highlights from last year
🧵 Some highlights from last year
We are also looking for an intern!
We’re on the lookout for a design intern to join RVL in Jan/Feb 2025! 💫️
At RVL, interns help showcase our work on social media to engage with the dataviz community, contribute to client projects, maintain our internal library, participate in talks and workshops, and more!
At RVL, interns help showcase our work on social media to engage with the dataviz community, contribute to client projects, maintain our internal library, participate in talks and workshops, and more!

December 22, 2024 at 3:07 PM
We are also looking for an intern!
Reposted by Gurman Bhatia
RVL’s team is growing and we are looking for a talented designer to develop engaging and thoughtful visuals for our projects ✨
➡️ More details + application form in our job description: bit.ly/Designer-RVL...
➡️ More details + application form in our job description: bit.ly/Designer-RVL...

December 18, 2024 at 9:00 AM
RVL’s team is growing and we are looking for a talented designer to develop engaging and thoughtful visuals for our projects ✨
➡️ More details + application form in our job description: bit.ly/Designer-RVL...
➡️ More details + application form in our job description: bit.ly/Designer-RVL...
Reposted by Gurman Bhatia
📊 Insight Out: Week 16
🧵 A thread on how we collaborated with a researcher to design a survey visual aid that helps capture mothers’ perceptions of their children’s growth in Telangana, making data collection for their study more intuitive and engaging.
🧵 A thread on how we collaborated with a researcher to design a survey visual aid that helps capture mothers’ perceptions of their children’s growth in Telangana, making data collection for their study more intuitive and engaging.

November 23, 2024 at 12:09 PM
📊 Insight Out: Week 16
🧵 A thread on how we collaborated with a researcher to design a survey visual aid that helps capture mothers’ perceptions of their children’s growth in Telangana, making data collection for their study more intuitive and engaging.
🧵 A thread on how we collaborated with a researcher to design a survey visual aid that helps capture mothers’ perceptions of their children’s growth in Telangana, making data collection for their study more intuitive and engaging.
Best team. Best memories in this cute comic.
From pixels to people 📱→ 🤗
After just over a year of collaborating through screens, team Revisual Labs finally met IRL for our first offsite!
🧵 A thread of some of our most memorable moments
After just over a year of collaborating through screens, team Revisual Labs finally met IRL for our first offsite!
🧵 A thread of some of our most memorable moments

November 26, 2024 at 1:23 AM
Best team. Best memories in this cute comic.
Reposted by Gurman Bhatia
People often ask what accessibility considerations to keep in mind when creating data visualizations. For guidance and advice, check out Sarah L. Fossheim's list of 10 things to do (or not do) when designing accessible data visualizations.
fossheim.io/writing/post...
fossheim.io/writing/post...

An intro to designing accessible data visualizations by Sarah L. Fossheim
I'm an experienced independent developer, designer and educator. I specialize in building accessible and inclusive products, and have a particular focus on dataviz accessibility.
fossheim.io
November 22, 2024 at 4:36 AM
People often ask what accessibility considerations to keep in mind when creating data visualizations. For guidance and advice, check out Sarah L. Fossheim's list of 10 things to do (or not do) when designing accessible data visualizations.
fossheim.io/writing/post...
fossheim.io/writing/post...
Hello. Are you a Drupal dev and in the freelance market? Please ping me! Looking for someone with availability in December and January.
November 22, 2024 at 4:54 AM
Hello. Are you a Drupal dev and in the freelance market? Please ping me! Looking for someone with availability in December and January.
#informationdesign spotted in the wild during a trip to Ahmedabad, Gujarat.


November 5, 2024 at 5:04 AM
#informationdesign spotted in the wild during a trip to Ahmedabad, Gujarat.
Met the @revisuallabs.bsky.social team in person for the first time in real life! Heart is full. ❤️

October 2, 2024 at 8:17 PM
Met the @revisuallabs.bsky.social team in person for the first time in real life! Heart is full. ❤️
Reposted by Gurman Bhatia
📊 Insight Out: Week 9 - Visualising Motivations of Free News Readers to Subscribe
🧵 A thread about our first physical dataviz installation for Google News Summit 2024
🧵 A thread about our first physical dataviz installation for Google News Summit 2024

September 20, 2024 at 9:23 AM
📊 Insight Out: Week 9 - Visualising Motivations of Free News Readers to Subscribe
🧵 A thread about our first physical dataviz installation for Google News Summit 2024
🧵 A thread about our first physical dataviz installation for Google News Summit 2024