


Census State Data Centers
@censussdc.bsky.social
Crunching the numbers in the states & US territories. SDC members provide guidance & access to #CensusData.
Same @censusSDC handle at X🐦 and 🐘 https://sciences.social/@censusSDC
Same @censusSDC handle at X🐦 and 🐘 https://sciences.social/@censusSDC
Pinned
Census State Data Centers bring LOCAL #govtdata when and where you need it. We're #datapros and #demographers in YOUR state, and available to meet with your board or council.
Directory: www.census.gov/about/partne...
Directory: www.census.gov/about/partne...
via @TexasDemography Your Monthly Data Update: Email from Texas Demographic Center TDC Vintage 2024 Estimates Coming Soon The comment period for the Vintage 2024 Preliminary Population Estimates has officially closed. We appreciate… myemail.constantcontact.com/Your-Monthly...

Your Monthly Data Update
Email from Texas Demographic Center MONTHLY DATA UPDATE TDC Vintage 2024 Estimates Coming Soon The comment period for the Vintage 2024 Preliminary Population Estimates has officially closed.
myemail.constantcontact.com
November 24, 2025 at 5:00 PM
via @TexasDemography Your Monthly Data Update: Email from Texas Demographic Center TDC Vintage 2024 Estimates Coming Soon The comment period for the Vintage 2024 Preliminary Population Estimates has officially closed. We appreciate… myemail.constantcontact.com/Your-Monthly...
via @EstadisticasPR Explora la evolución de la población puertorriqueña.
En la semana de la puertorriqueñidad le invitamos a explorar la evolución de la población puertorriqueña en las jurisdicciones de Estados Unidos durante la última década.
En la semana de la puertorriqueñidad le invitamos a explorar la evolución de la población puertorriqueña en las jurisdicciones de Estados Unidos durante la última década.

Evolución de la población puertorriqueña en los estados: ¿cuánto ha cambiado su tamaño y distribución geográfica? | State Data Center
La diáspora puertorriqueña en los Estados Unidos: una década de expansión y transformación (2014–2024)
Entre 2014 y 2024, la población que se identificó como puertorriqueña residente en los Estados Unidos y el Distrito de Columbia aumentó. En conjunto, el total estimado pasó de 5,266,738 en 2014 a 6,110,356 en 2024, representando un incremento de 843,618 personas o un 16.0% de crecimiento en una década. El aumento confirma la expansión de la diáspora puertorriqueña y refleja tanto la emigración desde Puerto Rico, así como el crecimiento de las generaciones nacidas en los Estados Unidos.
La puertorriqueñidad está presente en todas las jurisdicciones de EE. UU., aunque su distribución es desigual. En el 2014, cuatro estados concentraban más de la mitad de las personas que se identificaban como puertorriqueñas
Principales estados con población puertorriqueña, Estados Unidos: 2014
Estado
Estimado
Por ciento del Total
Nueva York
1,095,858
20.8%
Florida
1,006,542
19.1%
Nueva Jersey
468,200
8.9%
Pennsylvania
423,755
8.0%
Los cuatro estados en la tabla agrupan aproximadamente 56.8% de la población puertorriqueña en los estados. El estado de Nueva York fue el que albergó el mayor número de personas que se identificaron como puertorriqueñas en el 2014, seguido de Florida, Nueva Jersey y Pennsylvania.
Una década más tarde, 2024, el panorama cambió, los principales estados continuaban, sin embargo hubo algunos cambios en la posición respecto a la cantidad puertorriqueños residiendo en estos.
Principales estados con población puertorriqueña, Estados Unidos: 2024
Estimado
Por ciento del Total
Florida
1,302,970
21.3%
Nueva York
1,001,051
16.4%
Pennsylvania
492,463
8.1%
Nueva Jersey
484,119
7.9%
El estado de la Florida desplazó a Nueva York como el estado con mayor número de personas que se identificaron como puertorriqueñas. De hecho, Nueva York perdió población puertorriqueña mientras que Florida ganó población. Por su parte, Pennsylvania desplazó a Nueva Jersey de la tercera posición, ambos estados ganaron población durante la pasada década.
Los estados que, en números absolutos, aumentaron población fueron: Florida (296,428), Texas (81,123), Pennsylvania (68,708) ,Carolina del Norte (61,314) y Ohio (45,479). Por otro lado, los estados que perdieron población puertorriqueña fueron: Nueva York (-94,807), Illinois(-29,701), Hawaii (-3,608), Nuevo México (-2,737) Alaska (-1,566). En términos porcentuales, entre 2014 y 2024, la población que se identifica como puertorriqueña aumentó considerablemente en varios estados de Estados Unidos. En Iowa, pasó de 5,429 personas en 2014 a 17,791 en 2024, un incremento del 227.7 %. En Utah, la población creció de 6,880 a 16,475, equivalente a un 139.5 %. En Dakota del Norte, el número de personas puertorriqueñas se duplicó, al pasar de 1,584 a 3,278 (106.9 %). En Carolina del Sur, la cifra casi se duplicó, aumentando de 32,188 a 64,122 (99.2 %). Finalmente, en el Distrito de Columbia, la población puertorriqueña creció de 3,968 a 7,621, un aumento del 92.1 %.
Al revisar los cambios absolutos y porcentuales del 2014 al 2024, algunos estados experimentaron una disminución notable en la población que se identifica como puertorriqueña. En Nuevo México, la cifra descendió de 10,194 personas en 2014 a 7,457 en 2024, una reducción del 26.9 %. Por su parte, en Alaska la población pasó de 7,034 a 5,468, lo que representa una caída del 22.3 %. En Idaho, se redujo de 4,461 a 3,528 (−20.9 %), mientras que en Montana bajó de 2,278 a 1,873 (−17.8 %). Finalmente, en Illinois, uno de los estados con mayor presencia histórica de puertorriqueños, la población disminuyó de 211,626 a 181,925, una contracción del 14.0 %.
Entre 2014 y 2024, la población puertorriqueña en Estados Unidos creció y se redistribuyó geográficamente. El eje de la puertorriqueñidad en los Estados Unidos se desplazó del noreste industrial hacia el sur, marcando un nuevo capítulo en la historia migratoria de Puerto Rico.
Fuente de datos: U.S. Census Bureau, American Community Survey 1-Year Estimates Profile Tables, Table DP05 2014 & 2024.
Cita sugerida: Oliveras, Lanselotte (2025) La diáspora puertorriqueña en los Estados Unidos: una década de expansión y transformación (2014–2024). State Data Center de Puerto RIco. Instituto de Estadísticas de Puerto Rico.
censo.estadisticas.pr
November 22, 2025 at 6:14 PM
via @EstadisticasPR Explora la evolución de la población puertorriqueña.
En la semana de la puertorriqueñidad le invitamos a explorar la evolución de la población puertorriqueña en las jurisdicciones de Estados Unidos durante la última década.
En la semana de la puertorriqueñidad le invitamos a explorar la evolución de la población puertorriqueña en las jurisdicciones de Estados Unidos durante la última década.
via @mncompass November 2025 Compass News: ... We often hear that Minnesota boasts an exceptional quality of life, but a closer look at the data reveals a more complex picture. Check out these new trends that reflect the well-being of Minnesotans today: conta.cc/3KjD3rL

November 2025 Compass News
Email from Minnesota Compass New trends in data November 2025 New trends in data We often hear that Minnesota boasts an exceptional quality of life, but a closer look at the data reveals a more comple
conta.cc
November 21, 2025 at 9:21 PM
via @mncompass November 2025 Compass News: ... We often hear that Minnesota boasts an exceptional quality of life, but a closer look at the data reveals a more complex picture. Check out these new trends that reflect the well-being of Minnesotans today: conta.cc/3KjD3rL
via NYSDC *ICYMI* ACS Release Schedule: Hello all, Updated 2024 ACS schedule is out. The 2024 1-year PUMS will be released 12/4/25. The 5-year tables will be released 1/29/26 and the 5-year PUMS will be released 3/5/26.
LISTSERV - Login Required - GC.LISTSERV.CUNY.EDU
LISTSERV
Login Required
Email Address:
Password:
Register Password | Forgot Password?
gc.listserv.cuny.edu
November 21, 2025 at 9:12 PM
via NYSDC *ICYMI* ACS Release Schedule: Hello all, Updated 2024 ACS schedule is out. The 2024 1-year PUMS will be released 12/4/25. The 5-year tables will be released 1/29/26 and the 5-year PUMS will be released 3/5/26.
via @NCcensus: https://statelibrary... Adjusted Census Operational Dates: It's probably no surprise that the federal shutdown has impacted operational schedules including planned @uscensusbureau operations. Here's what we know now… | demography
List Archives - NCDATA - Authentication | Simplelists
Authentication page for NCDATA
statelibrarync.simplelists.com
November 21, 2025 at 9:11 PM
via @NCcensus: https://statelibrary... Adjusted Census Operational Dates: It's probably no surprise that the federal shutdown has impacted operational schedules including planned @uscensusbureau operations. Here's what we know now… | demography
via @ArkansasSDC The Census Bureau has updated their 2024 ACS Data Release Schedule. Mark your calendar for January 29, 2026 for the ACS 5-Year data release.

2024 Data Release Schedule
Review the planned dates and components of the 2024 ACS release.
www.census.gov
November 21, 2025 at 12:10 AM
via @ArkansasSDC The Census Bureau has updated their 2024 ACS Data Release Schedule. Mark your calendar for January 29, 2026 for the ACS 5-Year data release.
via @FedRegister Agency Information Collection Activities; Submission to OMB for Review and Approval; Comment Request; Survey of Construction Questionnaire for the Building Permit Official (SOC-QBPO) www.federalregister.gov/documents/20...

Agency Information Collection Activities; Submission to the Office of Management and Budget (OMB) for Review and Approval; Comment Request; Survey of Construction Questionnaire for the Building Permit...
Search, browse and learn about the Federal Register. Federal Register 2.0 is the unofficial daily publication for rules, proposed rules, and notices of Federal agencies and organizations, as well as e...
www.federalregister.gov
November 20, 2025 at 8:52 PM
via @FedRegister Agency Information Collection Activities; Submission to OMB for Review and Approval; Comment Request; Survey of Construction Questionnaire for the Building Permit Official (SOC-QBPO) www.federalregister.gov/documents/20...
via @UMASSDonahue Our Population Estimates Program (PEP) produces a summary report on Massachusetts. From Census data. We add context about population trends for researchers, planners, and the interested public. Learn more:

UMass Donahue Institute | Population Estimates by Massachusetts Geography
Each year, the U.S. Census Bureau produces population estimates at the state, county, and city/town level. These population estimates are used for federal funding allocations, as controls for major surveys, for community development, and as denominators for calculating statistical rates, among other uses. More information about the methodology used by the Census Bureau to produce these estimates can be found at the Census website.
With each Census release, PEP produces a summary report on the estimates for Massachusetts. These reports extract the data for Massachusetts from the Census release and provide context about population trends for researchers and planners. The most recent PEP reports on population estimates for Massachusetts, its counties, and its cities/towns may be viewed by clicking the desired level of geography above or in the menu to the left.
For additional U.S. Census data for Massachusetts, see the Massachusetts State Data Center.
bit.ly
November 20, 2025 at 6:10 PM
via @UMASSDonahue Our Population Estimates Program (PEP) produces a summary report on Massachusetts. From Census data. We add context about population trends for researchers, planners, and the interested public. Learn more:
via @minnpop @ipums.bsky.social OCC2010 is now available in ATUS: The American Time Use Survey (ATUS) was first fielded in 2003 and data have been collected and released annually since. Over that period, ATUS occupations have been coded using three distinct coding… blog.popdata.org/occ2010-atus/
OCC2010 is now available in ATUS – Use It for Good
blog.popdata.org
November 18, 2025 at 11:48 PM
via @minnpop @ipums.bsky.social OCC2010 is now available in ATUS: The American Time Use Survey (ATUS) was first fielded in 2003 and data have been collected and released annually since. Over that period, ATUS occupations have been coded using three distinct coding… blog.popdata.org/occ2010-atus/
via @UtahSDC Utah’s population projected to reach 5.6 million by 2065: Long-term planning projections indicate the state’s population will increase from nearly 3.6 million residents to 5.6 million...

Utah’s population projected to reach 5.6 million by 2065 - Kem C. Gardner Policy Institute
Long-term planning projections indicate the state’s population will increase from nearly 3.6 million residents to 5.6 million by 2065
gardner.utah.edu
November 18, 2025 at 6:54 PM
via @UtahSDC Utah’s population projected to reach 5.6 million by 2065: Long-term planning projections indicate the state’s population will increase from nearly 3.6 million residents to 5.6 million...
Reposted by Census State Data Centers

5/More women having kids in their 30s & 40s instead of teens & 20s makes drops in fertility look more dramatic than they really are. The # of children ever born to US women aged 40-44 has remained much more stable than the TFR, & not very far below 2. tinyurl.com/2wdm4x3u @karenguzzo.bsky.social

November 18, 2025 at 3:46 PM
5/More women having kids in their 30s & 40s instead of teens & 20s makes drops in fertility look more dramatic than they really are. The # of children ever born to US women aged 40-44 has remained much more stable than the TFR, & not very far below 2. tinyurl.com/2wdm4x3u @karenguzzo.bsky.social
via @NCdemography Housing Affordability Among Renters and Owners in NC | demography

Housing Affordability Among Renters and Owners in NC
This blog post expands on a previous blog post that examined housing cost burden across NC by focusing on the disparities between housing cost burden for homeowners and renters. In North Carolina, 66.8% of occupied housing units are owner-occupied, while 33.2% are renter occupied. According to Harvard’s Joint Center for Housing Studies’ 2025 report, nationwide, […]
carolinademography.cpc.unc.edu
November 18, 2025 at 3:12 PM
via @NCdemography Housing Affordability Among Renters and Owners in NC | demography
via @NCdemography North Carolina’s Housing Cost Burden | demography

North Carolina’s Housing Cost Burden
In recent years, housing has become a hot-button issue both nationwide and in our state, as many people struggle to find secure, affordable housing options. David Rouse, Ben Hitchings, and Anita Brown-Graham of the UNC School of Government’s ncIMPACT Initiative wrote that the three main factors contributing to the national housing crisis are affordability, availability, […]
carolinademography.cpc.unc.edu
November 18, 2025 at 3:10 PM
via @NCdemography North Carolina’s Housing Cost Burden | demography
via @CTopendata Exploring Data on Young Children and Medicaid: This year, there have been significant proposed federal funding cuts to Medicaid and other assistance programs. Recent policy shifts are reshaping access to health care, nutrition supports…

Exploring Data on Young Children and Medicaid — CTData
This year, there have been significant proposed federal funding cuts to Medicaid and other assistance programs. Recent policy shifts are reshaping access to health care, nutrition supports and other services. Young children (ages 0 to 3), one of the most vulnerable populations, will be affected by t
www.ctdata.org
November 12, 2025 at 3:10 PM
via @CTopendata Exploring Data on Young Children and Medicaid: This year, there have been significant proposed federal funding cuts to Medicaid and other assistance programs. Recent policy shifts are reshaping access to health care, nutrition supports…
via @MiDataAnalytics Michigan Veterans Report: Executive Summary. Veterans make up over 5 percent of the Michigan population, with most living in the Detroit Metro... https://www.michigan... (via Google CSE)

Michigan Veterans Report
www.michigan.gov
November 11, 2025 at 3:10 PM
via @MiDataAnalytics Michigan Veterans Report: Executive Summary. Veterans make up over 5 percent of the Michigan population, with most living in the Detroit Metro... https://www.michigan... (via Google CSE)
Reposted by Census State Data Centers

The U.S. Census Bureau provides data on workforce commute patterns with it's On-The-Map tool. Explore the newest commuter data for Eastern Oregon's counties by visiting our LMI Regional Info page.
www.qualityinfo.org/web/guest/ea...
#EasternOregon #commuting #data
www.qualityinfo.org/web/guest/ea...
#EasternOregon #commuting #data

November 4, 2025 at 5:22 PM
The U.S. Census Bureau provides data on workforce commute patterns with it's On-The-Map tool. Explore the newest commuter data for Eastern Oregon's counties by visiting our LMI Regional Info page.
www.qualityinfo.org/web/guest/ea...
#EasternOregon #commuting #data
www.qualityinfo.org/web/guest/ea...
#EasternOregon #commuting #data
via @CTopendata How Home Heating Is Changing in Connecticut: How homes are heated shapes household budgets and impacts the environment. Like much of New England, Connecticut remains unusually reliant on oil for heating homes, a legacy shaped by cold…
How Home Heating Is Changing in Connecticut — CTData
How homes are heated shapes household budgets and impacts the environment. Like much of New England, Connecticut remains unusually reliant on oil for heating homes, a legacy shaped by cold winters, older housing stock, and historically limited gas pipeline infrastructure. That picture, however, is
www.ctdata.org
November 7, 2025 at 1:27 PM
via @CTopendata How Home Heating Is Changing in Connecticut: How homes are heated shapes household budgets and impacts the environment. Like much of New England, Connecticut remains unusually reliant on oil for heating homes, a legacy shaped by cold…
via @CTopendata Data for Democracy in Norwalk | demography

Data for Democracy in Norwalk
In response to the federal data system going black in January of this year,
we at CTData have been partnering with local organizations to bring people
together across the state to share information about what we know about
changes to federal and state data, and also to help folks connect locally
around data and strategies they can use to best serve their region. On
October 30, 2025, we partnered with Norwalk ACTS to bring this event to
Norwalk. This post includes highlights from this session, but can’t do
justice to the excellent presentations and conversations. Read this post to
find many ways you can stay informed and take action!
www.ctdata.org
November 6, 2025 at 3:12 PM
via @CTopendata Data for Democracy in Norwalk | demography
via @minnpop @ipums.bsky.social New variables for augmenting IPUMS CPS data with external city-level data
New variables for augmenting IPUMS CPS data with external city-level data
Have you ever wanted to link external city-level data to CPS respondents but were stymied by the city coding system used by the CPS? With the release of two new variables (PLACECENSUS and PLACEFIPS), IPUMS CPS has simplified the task of making such linkages.
The CPS identifies a limited number of sub-state geographic units (e.g., cities, counties) because of the complex assignment of CPS geographic identifiers (see working paper) and required minimum population thresholds. An additional layer of complexity is a custom coding scheme for central/principal cities (INDIVIDCC) that is unique to the CPS and, therefore, unfamiliar to most data users. IPUMS CPS has addressed this issue through the creation of two new variables – PLACECENSUS and PLACEFIPS – which provide standard codes for identifying central cities. These new variables will dramatically simplify the process of using IPUMS CPS to study specific cities, and will be particularly beneficial to those who want to augment the CPS data with city-level characteristics.
blog.popdata.org
November 6, 2025 at 3:11 PM
via @minnpop @ipums.bsky.social New variables for augmenting IPUMS CPS data with external city-level data
Reposted by Census State Data Centers

This graph never fails to be shocking: "The US has experienced the earliest and greatest slowdown in life expectancy improvements among higher-income countries, reported Eileen Crimmins. “We have horrible life expectancy—and it’s getting worse and worse”"
www.prb.org/resources/se...
www.prb.org/resources/se...

October 31, 2025 at 7:08 PM
This graph never fails to be shocking: "The US has experienced the earliest and greatest slowdown in life expectancy improvements among higher-income countries, reported Eileen Crimmins. “We have horrible life expectancy—and it’s getting worse and worse”"
www.prb.org/resources/se...
www.prb.org/resources/se...
via @FedRegister Agency Information Collection Activities; Submission to OMB for Review and Approval; Comment Request; Current Population Survey, Basic Demographics www.federalregister.gov/documents/20...

Agency Information Collection Activities; Submission to the Office of Management and Budget (OMB) for Review and Approval; Comment Request; Current Population Survey, Basic Demographics
Search, browse and learn about the Federal Register. Federal Register 2.0 is the unofficial daily publication for rules, proposed rules, and notices of Federal agencies and organizations, as well as e...
www.federalregister.gov
November 1, 2025 at 6:02 PM
via @FedRegister Agency Information Collection Activities; Submission to OMB for Review and Approval; Comment Request; Current Population Survey, Basic Demographics www.federalregister.gov/documents/20...
via @UM_PSC The latest from the University of Michigan Population Studies Center - Fall 2025

The latest from the University of Michigan Population Studies Center - Fall 2025
Dear colleagues,
It is an honor to welcome you to the PSC newsletter as I start my second term serving the Center. I am grateful for the opportunity to celebrate all the energy and accomplishments happening here and to highlight new and existing resources and ways to get involved.
Our trainee bay in ISR 2080 has been reconfigured for more community use and we’d love you to touch down at the bigger work table and spaces for everyone (ask Miriam Rahl for the keypad code to 2080!).
We are starting the renewal applications for the PSC training program and the PDHP Center Grant (due in spring/summer 2026), so I will be reaching out to many of you and drawing on your tremendous work that went into PSC’s situational review last year as we chart our course and vision.
We are all managing unprecedented times as population scientists and as people. I am eager to trade information, work on a game plan in times of uncertainty, or collaborate on new strategies to handle these times.
Please be in touch, we’re here for you!
mailchi.mp
October 30, 2025 at 8:11 PM
via @UM_PSC The latest from the University of Michigan Population Studies Center - Fall 2025
Reposted by Census State Data Centers

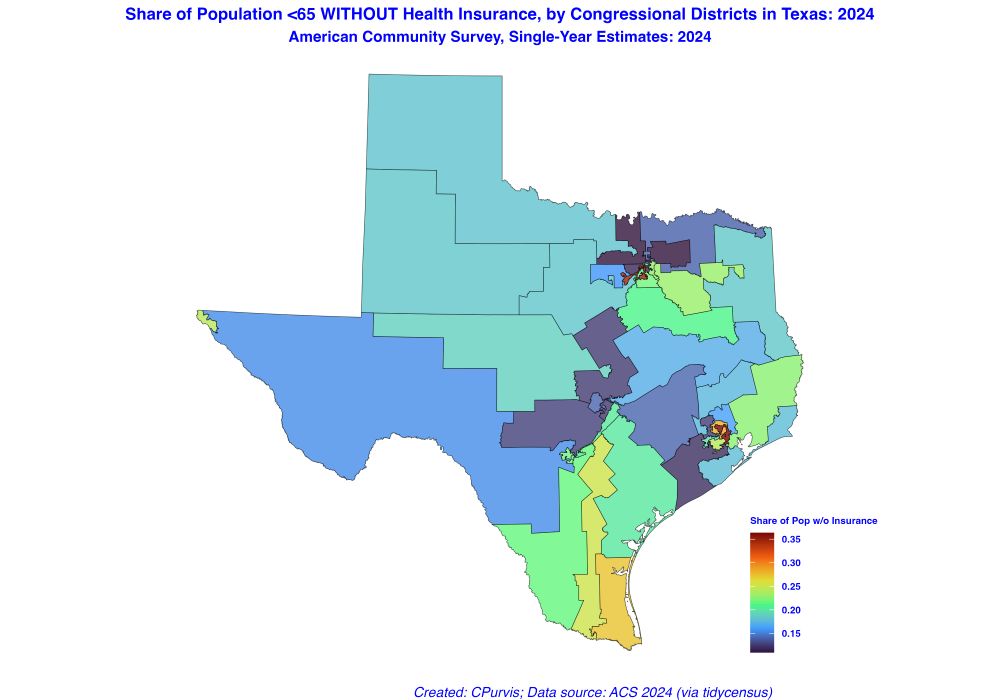
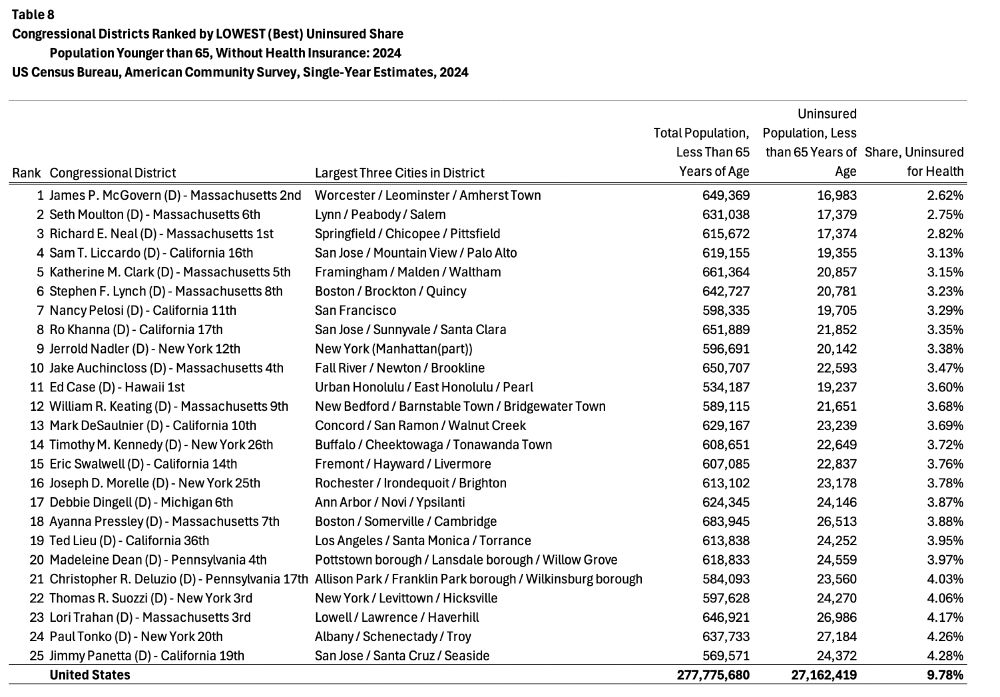
Americans Without Health Insurance (Part 4) CONGRESSIONAL DISTRICTS
1/3
#Census #ACS #AmericanCommunitySurvey #ACA #Obamacare
Continuing my analysis of the health uninsured in 2024.
Table 7. Worst CDs with highest uninsured shares
Table 8. Best CDs with lowest uninsured shares
1/3
#Census #ACS #AmericanCommunitySurvey #ACA #Obamacare
Continuing my analysis of the health uninsured in 2024.
Table 7. Worst CDs with highest uninsured shares
Table 8. Best CDs with lowest uninsured shares


October 29, 2025 at 6:17 PM
Americans Without Health Insurance (Part 4) CONGRESSIONAL DISTRICTS
1/3
#Census #ACS #AmericanCommunitySurvey #ACA #Obamacare
Continuing my analysis of the health uninsured in 2024.
Table 7. Worst CDs with highest uninsured shares
Table 8. Best CDs with lowest uninsured shares
1/3
#Census #ACS #AmericanCommunitySurvey #ACA #Obamacare
Continuing my analysis of the health uninsured in 2024.
Table 7. Worst CDs with highest uninsured shares
Table 8. Best CDs with lowest uninsured shares
This month’s most viewed #census post from a #CensusSDC member or affiliate is from MN’s @minnpop.bsky.social @ipums.bsky.social: bsky.app/profile/cens...
Any state can earn #TweetoftheMonth – just have the most RTs and Likes!
Any state can earn #TweetoftheMonth – just have the most RTs and Likes!
via @minnpop @ipums.bsky.social U.S. Federal Data from IPUMS during the Shutdown: When the U.S. federal government shuts down, it can affect the timing and availability of data releases from data providing agencies IPUMS. Any previously released data... blog.popdata.org/federal-shut...
U.S. Federal Data from IPUMS during the Shutdown – Use It for Good
blog.popdata.org
October 28, 2025 at 10:30 PM
This month’s most viewed #census post from a #CensusSDC member or affiliate is from MN’s @minnpop.bsky.social @ipums.bsky.social: bsky.app/profile/cens...
Any state can earn #TweetoftheMonth – just have the most RTs and Likes!
Any state can earn #TweetoftheMonth – just have the most RTs and Likes!