


cee
@ceenell.bsky.social
#openscience #dataviz and #scicomm 🏳️⚧️
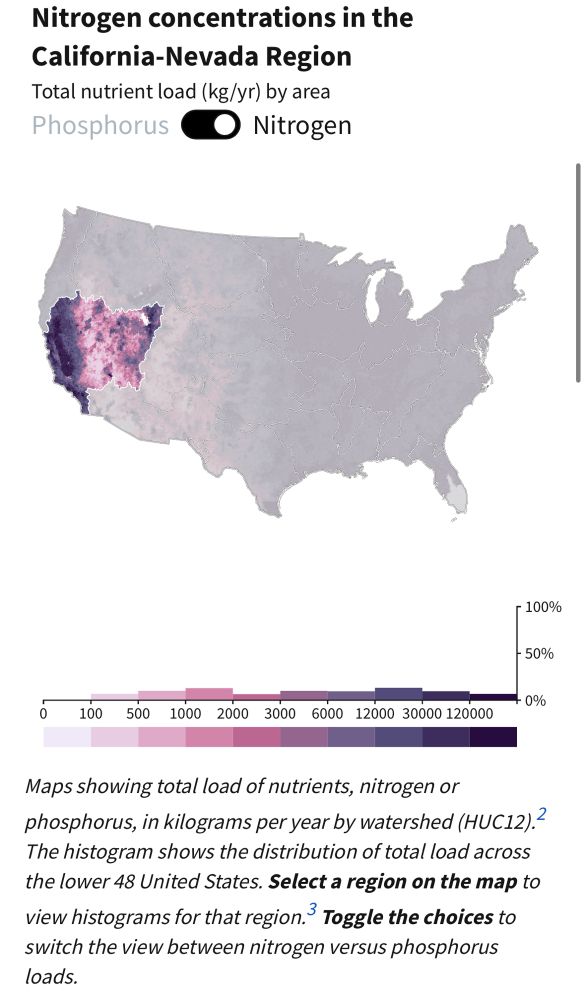
Nice! Here’s another example with an interaction that updates the histogram when a region is selected water.usgs.gov/vizlab/water-availability/05-nutrients
February 18, 2025 at 1:47 PM
Nice! Here’s another example with an interaction that updates the histogram when a region is selected water.usgs.gov/vizlab/water-availability/05-nutrients
really happy with how this bar chart came out

January 16, 2025 at 10:49 PM
really happy with how this bar chart came out
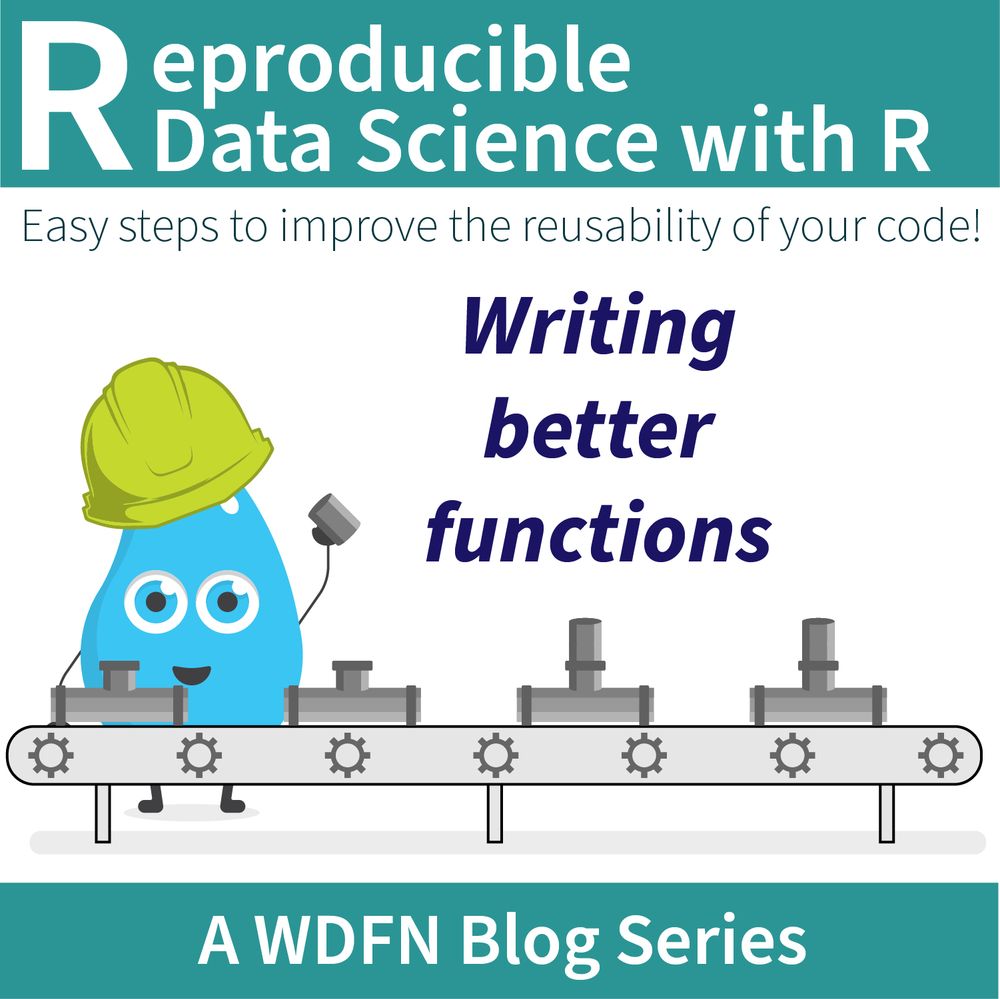
Reproducible Data Science in R: Writing better functions
Write functions in R that run better and are easier to understand. waterdata.usgs.gov/blog/rds-bet... #rstats #waterData
Write functions in R that run better and are easier to understand. waterdata.usgs.gov/blog/rds-bet... #rstats #waterData
December 19, 2024 at 4:01 PM
Reproducible Data Science in R: Writing better functions
Write functions in R that run better and are easier to understand. waterdata.usgs.gov/blog/rds-bet... #rstats #waterData
Write functions in R that run better and are easier to understand. waterdata.usgs.gov/blog/rds-bet... #rstats #waterData
Reproducible Data Science in R: Flexible functions using tidy evaluation. Improve your functions with helpful dataframe evaluation patterns! waterdata.usgs.gov/blog/rds-fun... #rstats

December 17, 2024 at 4:38 PM
Reproducible Data Science in R: Flexible functions using tidy evaluation. Improve your functions with helpful dataframe evaluation patterns! waterdata.usgs.gov/blog/rds-fun... #rstats

A deep learning approach to streamflow drought prediction #AGU24 @shamshaw.bsky.social

December 9, 2024 at 4:06 PM
A deep learning approach to streamflow drought prediction #AGU24 @shamshaw.bsky.social

Reproducible Data Science in R: Writing functions that work for you #rstats waterdata.usgs.gov/blog/rds-fun...

December 7, 2024 at 1:30 PM
Reproducible Data Science in R: Writing functions that work for you #rstats waterdata.usgs.gov/blog/rds-fun...
November streamflow across the U.S. Some dry spells in the East and relatively normal conditions in the West for this time of year.

December 6, 2024 at 3:55 PM
November streamflow across the U.S. Some dry spells in the East and relatively normal conditions in the West for this time of year.
Communities across the United States and the globe rely on clean water flowing from forested watersheds. But these water source areas are impacted by the effects of wildfire. Read more: labs.waterdata.usgs.gov/visualizatio...

December 5, 2024 at 1:56 PM
Communities across the United States and the globe rely on clean water flowing from forested watersheds. But these water source areas are impacted by the effects of wildfire. Read more: labs.waterdata.usgs.gov/visualizatio...


Introducing hyswap: A python package for understanding local- to national-scale stream flow data with historic context waterdata.usgs.gov/blog/introdu... #python #WaterData

November 22, 2024 at 5:48 PM
Introducing hyswap: A python package for understanding local- to national-scale stream flow data with historic context waterdata.usgs.gov/blog/introdu... #python #WaterData
Managing Redband Trout for climate resilience - a new #dataviz story from #USGSvizlab labs.waterdata.usgs.gov/visualizatio...
November 20, 2024 at 10:40 PM
Managing Redband Trout for climate resilience - a new #dataviz story from #USGSvizlab labs.waterdata.usgs.gov/visualizatio...
What are the social determinants that shape water insecurity? See the latest data viz from USGS Vizlab labs.waterdata.usgs.gov/visualizatio...

November 15, 2024 at 7:37 PM
What are the social determinants that shape water insecurity? See the latest data viz from USGS Vizlab labs.waterdata.usgs.gov/visualizatio...

kicking off #AGU23 with @eazadpour.bsky.social and 30 days of data viz!

December 11, 2023 at 4:53 PM
kicking off #AGU23 with @eazadpour.bsky.social and 30 days of data viz!


September #streamflow conditions across the U.S. 💧 Dry conditions persisted across much of the U.S., while parts of New England saw wet conditions. 📊🌎 made with #rstats github.com/DOI-USGS/flo... @eazadpour.bsky.social

October 11, 2023 at 12:53 AM
September #streamflow conditions across the U.S. 💧 Dry conditions persisted across much of the U.S., while parts of New England saw wet conditions. 📊🌎 made with #rstats github.com/DOI-USGS/flo... @eazadpour.bsky.social
This timeline displays the 2,000 most severe drought events at individual streamgages between 1920 and 2020. Severity is a measure of how long (duration) and how dry (intensity) droughts were.

September 21, 2023 at 1:04 AM
This timeline displays the 2,000 most severe drought events at individual streamgages between 1920 and 2020. Severity is a measure of how long (duration) and how dry (intensity) droughts were.
The U.S. has a long history of drought. But in the last 100 years, five drought periods stand out from all the rest.
Learn about the 5 droughts that changed history in this new data viz 📊📈from the USGS VizLab labs.waterdata.usgs.gov/visualizatio...
Learn about the 5 droughts that changed history in this new data viz 📊📈from the USGS VizLab labs.waterdata.usgs.gov/visualizatio...

September 20, 2023 at 9:16 PM
The U.S. has a long history of drought. But in the last 100 years, five drought periods stand out from all the rest.
Learn about the 5 droughts that changed history in this new data viz 📊📈from the USGS VizLab labs.waterdata.usgs.gov/visualizatio...
Learn about the 5 droughts that changed history in this new data viz 📊📈from the USGS VizLab labs.waterdata.usgs.gov/visualizatio...
August #streamflow conditions across the U.S. 💧 #DataViz made with #rstats #dataRetrieval github.com/DOI-USGS/flo...


September 3, 2023 at 4:31 PM
August #streamflow conditions across the U.S. 💧 #DataViz made with #rstats #dataRetrieval github.com/DOI-USGS/flo...
