


Carolyn Anderson
@carolynanderson.bsky.social
Wellesley CS professor and computational linguist. Studies meaning with computational and experimental tools.
I agree!
Also, I think our visualization methodology could very easily be adapted to other tasks. I'm not sure what this would look like for writing specifically, but if you can come up with a way of annotating the data, the graphs make it easy to look at where people get "stuck".
Also, I think our visualization methodology could very easily be adapted to other tasks. I'm not sure what this would look like for writing specifically, but if you can come up with a way of annotating the data, the graphs make it easy to look at where people get "stuck".
January 24, 2025 at 10:37 PM
I agree!
Also, I think our visualization methodology could very easily be adapted to other tasks. I'm not sure what this would look like for writing specifically, but if you can come up with a way of annotating the data, the graphs make it easy to look at where people get "stuck".
Also, I think our visualization methodology could very easily be adapted to other tasks. I'm not sure what this would look like for writing specifically, but if you can come up with a way of annotating the data, the graphs make it easy to look at where people get "stuck".
we had two great students driving this paper-- Francesca Lucchetti (Northeastern) and Wellesley's Zixuan Wu, who is currently applying to PhD programs!
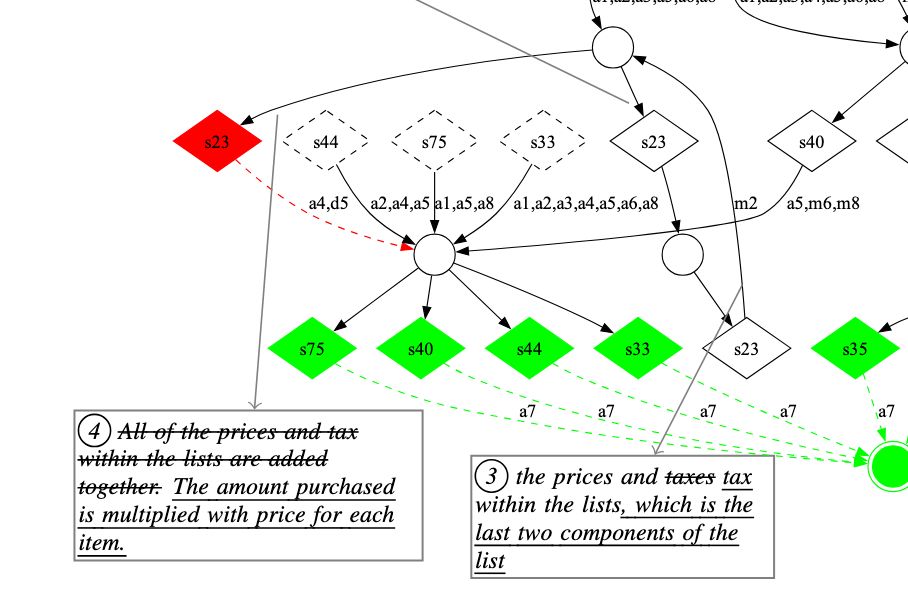
Francesca came up with a really neat way of visualizing edits to the information content of prompts
Francesca came up with a really neat way of visualizing edits to the information content of prompts
January 23, 2025 at 6:57 PM
we had two great students driving this paper-- Francesca Lucchetti (Northeastern) and Wellesley's Zixuan Wu, who is currently applying to PhD programs!
Francesca came up with a really neat way of visualizing edits to the information content of prompts
Francesca came up with a really neat way of visualizing edits to the information content of prompts
This is joint work with Arjun Guha, Federico Cassano, Michael Greenberg, Abhinav Jangda, John Gouwar, Francesca Lucchetti, and Claire Schlesinger. Also: no proprietary LLMs were used in this work :)
August 18, 2023 at 9:08 PM
This is joint work with Arjun Guha, Federico Cassano, Michael Greenberg, Abhinav Jangda, John Gouwar, Francesca Lucchetti, and Claire Schlesinger. Also: no proprietary LLMs were used in this work :)