


Reposted by Britt Staniar

Solution Guide | #Tableau | #WOW2025 | Week 32 | Can you use dynamic spatial parameters?
blog: donnacoles.home.blog/2025/08/13/c...
cc: Kyle Yetter Lorna Brown Erica Hughes @hipstervizninja.com Yoshitaka Arakawa @yusukenakanishi.bsky.social
blog: donnacoles.home.blog/2025/08/13/c...
cc: Kyle Yetter Lorna Brown Erica Hughes @hipstervizninja.com Yoshitaka Arakawa @yusukenakanishi.bsky.social
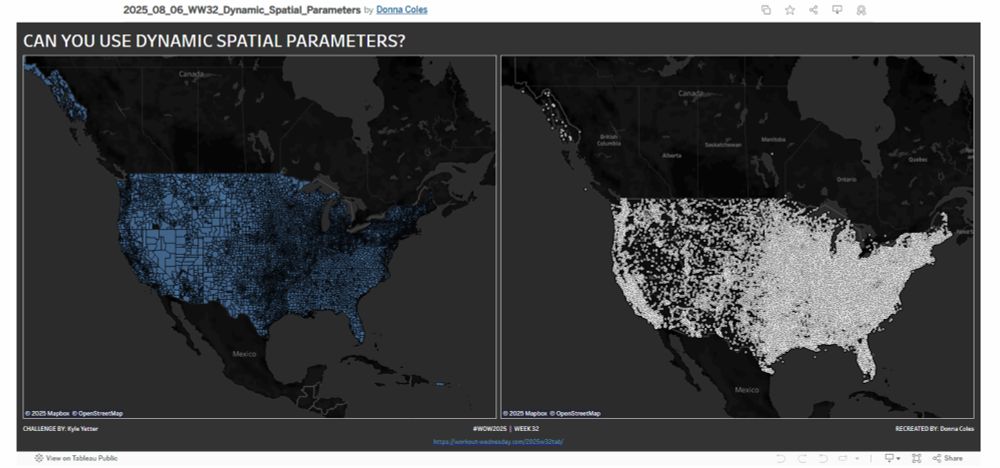
Can you use dynamic spatial parameters?
Kyle set this challenge while I was on my holidays. And because I was away and short on time, I’m cheating a bit this week. I’m not going to provide a full solution guide, but am writin…
donnacoles.home.blog
August 13, 2025 at 7:22 AM
Solution Guide | #Tableau | #WOW2025 | Week 32 | Can you use dynamic spatial parameters?
blog: donnacoles.home.blog/2025/08/13/c...
cc: Kyle Yetter Lorna Brown Erica Hughes @hipstervizninja.com Yoshitaka Arakawa @yusukenakanishi.bsky.social
blog: donnacoles.home.blog/2025/08/13/c...
cc: Kyle Yetter Lorna Brown Erica Hughes @hipstervizninja.com Yoshitaka Arakawa @yusukenakanishi.bsky.social
Reposted by Britt Staniar

Please join our ATX Tableau User Group on Thursday, August 14th, for in-person networking and hybrid presentations from:
Bo McCready (2025 Iron Viz Champ), and Jane Kamata (2024 Student Iron Viz Winner).
#Tableau #Networking #DataVisualization #Austin #Data #DataFam #tableauusergroup
Bo McCready (2025 Iron Viz Champ), and Jane Kamata (2024 Student Iron Viz Winner).
#Tableau #Networking #DataVisualization #Austin #Data #DataFam #tableauusergroup

Austin TUG August 2025 | Iron Viz Unplugged: Stories & Strategies from Center Stage | Tableau
Hybrid Event - Bringing engaging and enlightening content to the Austin Tableau community.
Please join us at our monthly in-person, hybrid, & virtual TUG events.
usergroups.tableau.com
August 11, 2025 at 6:16 PM
Please join our ATX Tableau User Group on Thursday, August 14th, for in-person networking and hybrid presentations from:
Bo McCready (2025 Iron Viz Champ), and Jane Kamata (2024 Student Iron Viz Winner).
#Tableau #Networking #DataVisualization #Austin #Data #DataFam #tableauusergroup
Bo McCready (2025 Iron Viz Champ), and Jane Kamata (2024 Student Iron Viz Winner).
#Tableau #Networking #DataVisualization #Austin #Data #DataFam #tableauusergroup
Reposted by Britt Staniar

New blog post from Kasia Gąsiewska-Holc AND her husband Łukasz Holc!
In this blog post, they introduce their new FREE tool, The Tableau Workbook Explorer!
Link; www.flerlagetwins.com/2025/08/intr...
In this blog post, they introduce their new FREE tool, The Tableau Workbook Explorer!
Link; www.flerlagetwins.com/2025/08/intr...

August 11, 2025 at 1:52 PM
New blog post from Kasia Gąsiewska-Holc AND her husband Łukasz Holc!
In this blog post, they introduce their new FREE tool, The Tableau Workbook Explorer!
Link; www.flerlagetwins.com/2025/08/intr...
In this blog post, they introduce their new FREE tool, The Tableau Workbook Explorer!
Link; www.flerlagetwins.com/2025/08/intr...
Reposted by Britt Staniar
We can't wait to see all our local #datafam members at our quarterly hybrid TUG event! Don't miss this chance to socialize, network, and snag some sweet swag! And join us afterwards for a happy hour sponsored by XeoMatrix. usergroups.tableau.com/events/detai... #tableau #tableauusergroup
Austin TUG March 2025 | Dynamic Messaging in Tableau | Tableau
Hybrid Event - Bringing engaging and enlightening content to the Austin Tableau community.
Please join us at our monthly in-person, hybrid, & virtual TUG events.
usergroups.tableau.com
March 19, 2025 at 2:27 PM
We can't wait to see all our local #datafam members at our quarterly hybrid TUG event! Don't miss this chance to socialize, network, and snag some sweet swag! And join us afterwards for a happy hour sponsored by XeoMatrix. usergroups.tableau.com/events/detai... #tableau #tableauusergroup
Reposted by Britt Staniar

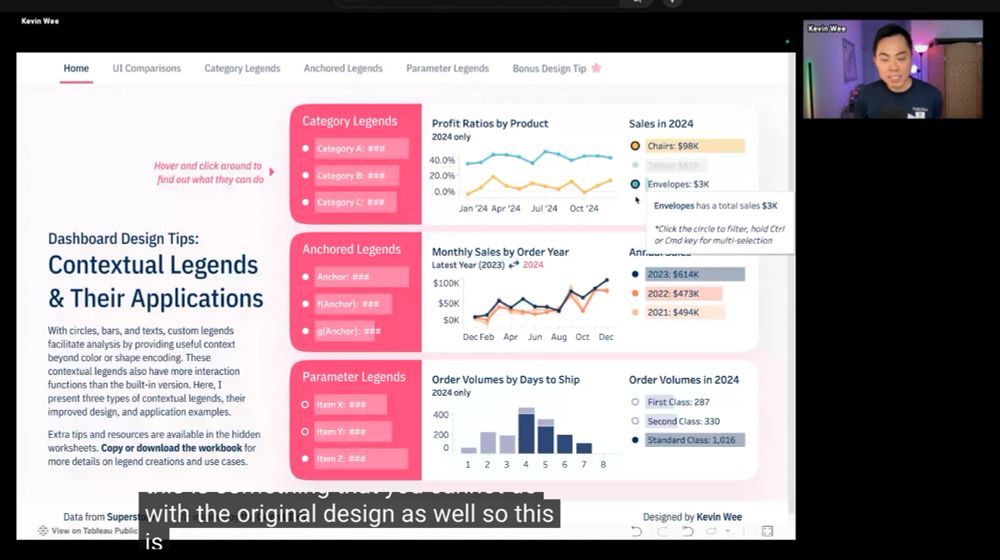
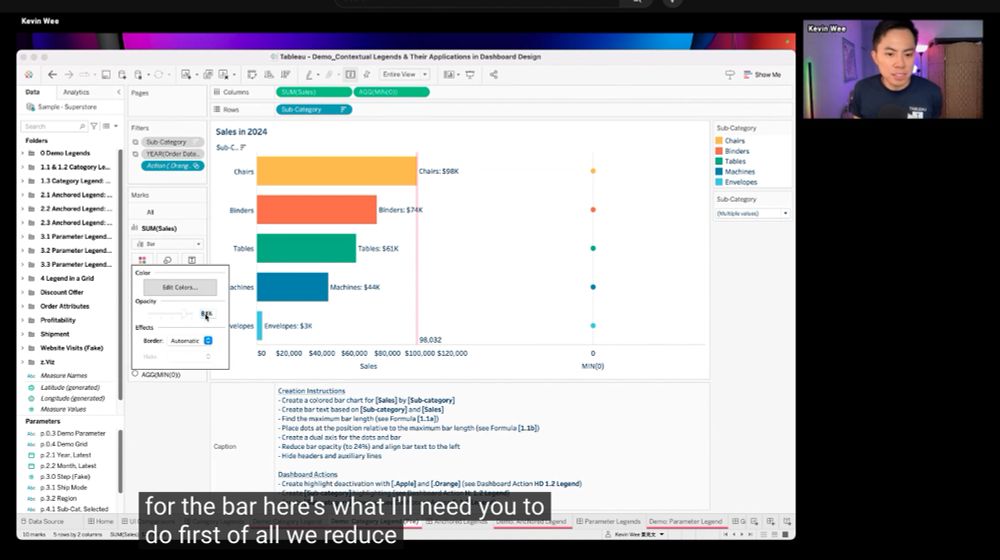
NEW VIDEO: Hey #DataFam, check out my latest talk on contextual legends & their applications on #Tableau dashboards: rb.gy/2yllpn
I explained (1) how these legends have a better #UI vs a default one, (2) the creation processes, (3) #dashboard action setups, & (4) the use cases in #data #analytics.
I explained (1) how these legends have a better #UI vs a default one, (2) the creation processes, (3) #dashboard action setups, & (4) the use cases in #data #analytics.
March 9, 2025 at 10:02 PM
NEW VIDEO: Hey #DataFam, check out my latest talk on contextual legends & their applications on #Tableau dashboards: rb.gy/2yllpn
I explained (1) how these legends have a better #UI vs a default one, (2) the creation processes, (3) #dashboard action setups, & (4) the use cases in #data #analytics.
I explained (1) how these legends have a better #UI vs a default one, (2) the creation processes, (3) #dashboard action setups, & (4) the use cases in #data #analytics.
Reposted by Britt Staniar

🚨 Back 2 Viz Basics Week 5 is live!
This week’s challenge: Build a Scatter Plot. Explore mobile phone specs and pricing data from Kaggle to spot trends in features and cost.
📊Challenge details: bit.ly/4kw1LCt
#B2VB #DataChallenge #Tableau #PowerBI
This week’s challenge: Build a Scatter Plot. Explore mobile phone specs and pricing data from Kaggle to spot trends in features and cost.
📊Challenge details: bit.ly/4kw1LCt
#B2VB #DataChallenge #Tableau #PowerBI
bit.ly
March 10, 2025 at 12:33 PM
🚨 Back 2 Viz Basics Week 5 is live!
This week’s challenge: Build a Scatter Plot. Explore mobile phone specs and pricing data from Kaggle to spot trends in features and cost.
📊Challenge details: bit.ly/4kw1LCt
#B2VB #DataChallenge #Tableau #PowerBI
This week’s challenge: Build a Scatter Plot. Explore mobile phone specs and pricing data from Kaggle to spot trends in features and cost.
📊Challenge details: bit.ly/4kw1LCt
#B2VB #DataChallenge #Tableau #PowerBI
Reposted by Britt Staniar
New Blog Post: The Line Jumper Chart
The Line Jumper Chart combines a standard line chart with a slope chart to subtly provide even more information to the end user. This blog post discusses when to use it and how to build it in Tableau.
Link: www.flerlagetwins.com/2025/01/the-...
The Line Jumper Chart combines a standard line chart with a slope chart to subtly provide even more information to the end user. This blog post discusses when to use it and how to build it in Tableau.
Link: www.flerlagetwins.com/2025/01/the-...

The Line Jumper Chart: Combining a Standard Line Chart with a Slope Chart
I recently released my 200th viz which was all about the words spoken by the four main characters in Seinfeld . As part of this viz, I ...
www.flerlagetwins.com
March 10, 2025 at 1:47 PM
New Blog Post: The Line Jumper Chart
The Line Jumper Chart combines a standard line chart with a slope chart to subtly provide even more information to the end user. This blog post discusses when to use it and how to build it in Tableau.
Link: www.flerlagetwins.com/2025/01/the-...
The Line Jumper Chart combines a standard line chart with a slope chart to subtly provide even more information to the end user. This blog post discusses when to use it and how to build it in Tableau.
Link: www.flerlagetwins.com/2025/01/the-...
Reposted by Britt Staniar

Here is the next blog in my KPI series! Shoutout to Zak Geis on his #tableaupublic dashboard! #datafam #tableau
www.techtipsgirl.com/post/kpi-ser...
www.techtipsgirl.com/post/kpi-ser...
KPI Series: Automatic Highlight Background and Text Swap
In last week's blog Use KPI as a Filter! I reviewed several dashboards that allowed you to click on them to filter the rest of the dashboard! This week I want to discuss how to create Zak Geis's heade...
www.techtipsgirl.com
March 9, 2025 at 3:59 PM
Here is the next blog in my KPI series! Shoutout to Zak Geis on his #tableaupublic dashboard! #datafam #tableau
www.techtipsgirl.com/post/kpi-ser...
www.techtipsgirl.com/post/kpi-ser...
Reposted by Britt Staniar

I really enjoyed listening to this data story, and couldn't resist exploring Lauren Bauer's (@laurenhlb.bsky.social) dataset myself!
public.tableau.com/app/profile/...
public.tableau.com/app/profile/...

March 3, 2025 at 5:10 AM
I really enjoyed listening to this data story, and couldn't resist exploring Lauren Bauer's (@laurenhlb.bsky.social) dataset myself!
public.tableau.com/app/profile/...
public.tableau.com/app/profile/...
Reposted by Britt Staniar

it's the little things - excited to FINALLY have manual control over categories on my Tableau Public profile!
March 4, 2025 at 3:43 AM
it's the little things - excited to FINALLY have manual control over categories on my Tableau Public profile!
Reposted by Britt Staniar

✨New blog post! Make your text tables on dashboards shine with an easy, interactive, custom sort order feature. ✨
sarahpallett.com/index.php/20... #Tableau #DataFam
sarahpallett.com/index.php/20... #Tableau #DataFam
Interactive Text Tables with Custom Sort Order - Sarah Pallett
Make your text tables on dashboards shine with an easy, interactive, custom sort order feature. The concept is simple: give your dashboard viewers a handy-dandy drop-down menu so they can sort their ...
sarahpallett.com
February 27, 2025 at 10:59 PM
✨New blog post! Make your text tables on dashboards shine with an easy, interactive, custom sort order feature. ✨
sarahpallett.com/index.php/20... #Tableau #DataFam
sarahpallett.com/index.php/20... #Tableau #DataFam
Reposted by Britt Staniar

New #dataviz in #Tableau: House Republicans celebrate passing a budget resolution that would almost certainly gut the Medicaid health insurance program. One in four Americans depend on Medicaid for health insurance coverage.
tabsoft.co/3QVSFSd
tabsoft.co/3QVSFSd

February 26, 2025 at 4:53 PM
New #dataviz in #Tableau: House Republicans celebrate passing a budget resolution that would almost certainly gut the Medicaid health insurance program. One in four Americans depend on Medicaid for health insurance coverage.
tabsoft.co/3QVSFSd
tabsoft.co/3QVSFSd
Reposted by Britt Staniar
Which fields for this year's #Tableau Conference Step Tracker should stay? Which ones should go? Let me know through the form (forms.gle/L7af3VrHctTB...) and I'll send you a reminder when the project is live.
Note: I am planning on nuking the twitter field as I can't in good conscience promote it.
Note: I am planning on nuking the twitter field as I can't in good conscience promote it.

February 26, 2025 at 3:38 PM
Which fields for this year's #Tableau Conference Step Tracker should stay? Which ones should go? Let me know through the form (forms.gle/L7af3VrHctTB...) and I'll send you a reminder when the project is live.
Note: I am planning on nuking the twitter field as I can't in good conscience promote it.
Note: I am planning on nuking the twitter field as I can't in good conscience promote it.
Reposted by Britt Staniar
New Blog Post - Variable Offset Label Bar Chart
Ever had so many header labels on a bar chart that they wrap and get cut off? Well, this variable offset label technique might be your solution. Check it out:
Link: www.flerlagetwins.com/2025/02/vari...
Ever had so many header labels on a bar chart that they wrap and get cut off? Well, this variable offset label technique might be your solution. Check it out:
Link: www.flerlagetwins.com/2025/02/vari...

Variable Offset Label Bar Chart
I recently released a viz about th e Saturday Night Live Five-Timers club - stars that have hosted the show at least 5 times . In that v...
www.flerlagetwins.com
February 25, 2025 at 1:45 PM
New Blog Post - Variable Offset Label Bar Chart
Ever had so many header labels on a bar chart that they wrap and get cut off? Well, this variable offset label technique might be your solution. Check it out:
Link: www.flerlagetwins.com/2025/02/vari...
Ever had so many header labels on a bar chart that they wrap and get cut off? Well, this variable offset label technique might be your solution. Check it out:
Link: www.flerlagetwins.com/2025/02/vari...
Fellow Proscratinators: There's one day left to get your submissions in for the 2025 Visionary Program. Now is your time!
tabsoft.co/3Vm3nnr
tabsoft.co/3Vm3nnr

Apply or Nominate the 2025 Tableau Visionaries
Applications to become a 2025 Tableau Visionary are open. Here’s everything you need to know.
tabsoft.co
January 9, 2025 at 12:52 AM
Fellow Proscratinators: There's one day left to get your submissions in for the 2025 Visionary Program. Now is your time!
tabsoft.co/3Vm3nnr
tabsoft.co/3Vm3nnr
Reposted by Britt Staniar
HNY, #datafam! The first Workout Wednesday of 2025 is live! If you’ve been wanting to try a community project, now is awesome time to jump in, build your skills, try new chart types, & connect with the #datafam! 📊
workout-wednesday.com/2025w1tab/
workout-wednesday.com/2025w1tab/
#WOW2025 | Week 1 | Can you replicate Quick Table Calcs? – Workout Wednesday
workout-wednesday.com
January 3, 2025 at 12:05 AM
HNY, #datafam! The first Workout Wednesday of 2025 is live! If you’ve been wanting to try a community project, now is awesome time to jump in, build your skills, try new chart types, & connect with the #datafam! 📊
workout-wednesday.com/2025w1tab/
workout-wednesday.com/2025w1tab/
Reposted by Britt Staniar
My new 5 part series Bringing Tables Together covers everything you need to know about Tableau Data sources, including:
📊 How is a blend different from a join?
📉 Why are my null rows missing?
🧐 How can I make a real join?
Read the series here: playfairdata.com/bringing-tab...
📊 How is a blend different from a join?
📉 Why are my null rows missing?
🧐 How can I make a real join?
Read the series here: playfairdata.com/bringing-tab...

Bringing Tables Together: Tableau's Physical Layer
Learn about the physical layer in Tableau, including unions, joins, and custom SQL to bring tables together.
playfairdata.com
January 5, 2025 at 2:06 AM
My new 5 part series Bringing Tables Together covers everything you need to know about Tableau Data sources, including:
📊 How is a blend different from a join?
📉 Why are my null rows missing?
🧐 How can I make a real join?
Read the series here: playfairdata.com/bringing-tab...
📊 How is a blend different from a join?
📉 Why are my null rows missing?
🧐 How can I make a real join?
Read the series here: playfairdata.com/bringing-tab...
Reposted by Britt Staniar
New year, new skills! 🎉 My first blog post, “Starting to Figma it Out,” is live!
If you’re a #Tableau user looking to level up your dashboard designs with #Figma, this guide is for you. From gradients to rounded corners, let’s get creative, #datafam! 🚀
💡 Check it out: medium.com/@blakefeiza/...
If you’re a #Tableau user looking to level up your dashboard designs with #Figma, this guide is for you. From gradients to rounded corners, let’s get creative, #datafam! 🚀
💡 Check it out: medium.com/@blakefeiza/...
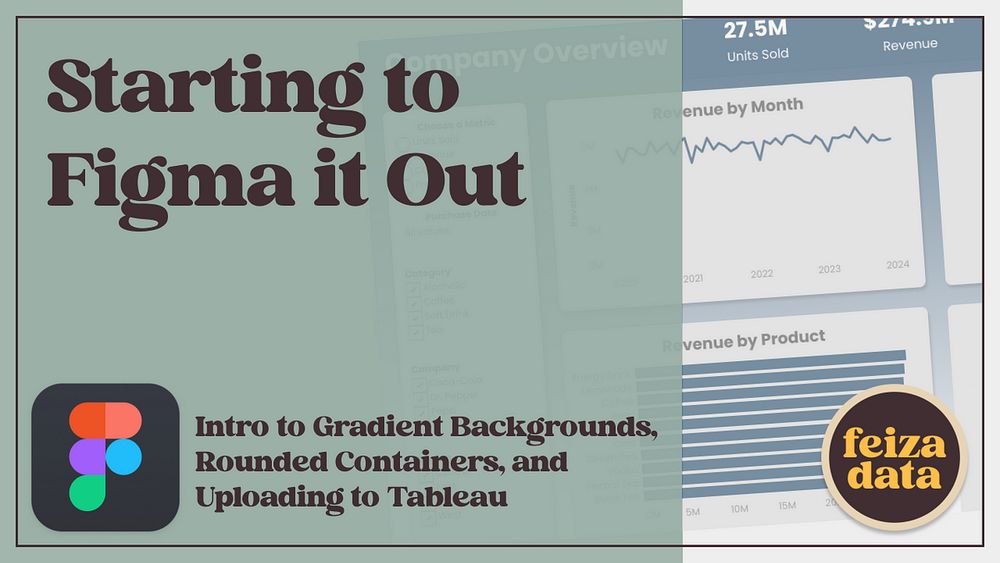
Starting to Figma it Out
I still remember the feeling when I first opened Figma. I was totally overwhelmed. The clean interface was promising, but where do you even…
medium.com
January 1, 2025 at 7:03 PM
New year, new skills! 🎉 My first blog post, “Starting to Figma it Out,” is live!
If you’re a #Tableau user looking to level up your dashboard designs with #Figma, this guide is for you. From gradients to rounded corners, let’s get creative, #datafam! 🚀
💡 Check it out: medium.com/@blakefeiza/...
If you’re a #Tableau user looking to level up your dashboard designs with #Figma, this guide is for you. From gradients to rounded corners, let’s get creative, #datafam! 🚀
💡 Check it out: medium.com/@blakefeiza/...
Reposted by Britt Staniar

Join me & @nicoleklassen.bsky.social for #VizOfficeHours Wed, 12/18 @4pm ET. Discuss ideas & get feedback on #DataPlusTV, #B2VB, #MakeoverMonday or other projects. Learn more at Nicole's blog post nicole-klassen.medium.com/viz-office-h... & our dashboard public.tableau.com/app/profile/...

Viz Office Hours!
Have a viz you’re working on and you’d like a set of eyes on it? Have a viz idea but no idea where to start? Just want to hang out with…
nicole-klassen.medium.com
December 18, 2024 at 1:27 PM
Join me & @nicoleklassen.bsky.social for #VizOfficeHours Wed, 12/18 @4pm ET. Discuss ideas & get feedback on #DataPlusTV, #B2VB, #MakeoverMonday or other projects. Learn more at Nicole's blog post nicole-klassen.medium.com/viz-office-h... & our dashboard public.tableau.com/app/profile/...
Reposted by Britt Staniar

A treat for #datafam in #SecretsOfTheViz 📊 today, I have Brian Moore sharing his mind-blowing gradient 🤯 techniques he used in his #IronViz, analyzing what makes #DataPlusTV spin-offs great (and not so great)! Lots of amazing learnings in this one 😉
youtu.be/57EHkidovfI
youtu.be/57EHkidovfI

Secrets of the Viz: Side Stories - A Visual Analysis
YouTube video by Louis Yu
youtu.be
December 19, 2024 at 3:12 PM
A treat for #datafam in #SecretsOfTheViz 📊 today, I have Brian Moore sharing his mind-blowing gradient 🤯 techniques he used in his #IronViz, analyzing what makes #DataPlusTV spin-offs great (and not so great)! Lots of amazing learnings in this one 😉
youtu.be/57EHkidovfI
youtu.be/57EHkidovfI

December 17, 2024 at 10:29 PM
Reposted by Britt Staniar
In case you missed it, here is our podcast on Cats, Coffee and #Tableau! We had cat trivia, a coffee discussion and reviewed our favorite #Tableaupublic dashboards. www.youtube.com/live/cqFhsvF...
YouTube
Share your videos with friends, family, and the world
www.youtube.com
December 14, 2024 at 1:31 PM
In case you missed it, here is our podcast on Cats, Coffee and #Tableau! We had cat trivia, a coffee discussion and reviewed our favorite #Tableaupublic dashboards. www.youtube.com/live/cqFhsvF...
Reposted by Britt Staniar

#TinyTableauTip If you have multiple reference lines in @tableau, you can multi-select them by holding the CTRL Key down + selecting each line.
When all are selected, you can format all at once, the width, font, color etc.
When all are selected, you can format all at once, the width, font, color etc.


December 11, 2024 at 9:33 AM
#TinyTableauTip If you have multiple reference lines in @tableau, you can multi-select them by holding the CTRL Key down + selecting each line.
When all are selected, you can format all at once, the width, font, color etc.
When all are selected, you can format all at once, the width, font, color etc.
Reposted by Britt Staniar
I know most people are focused on the upcoming holiday season, but I'm looking ahead to Groundhog Day!
My new @tableaupublic.bsky.social viz displays data for the 38 Groundhog Days shown in the 1993 movie.
🔗 bit.ly/3ZvryRs
Many thanks to @zachbowders.bsky.social for providing feedback!
My new @tableaupublic.bsky.social viz displays data for the 38 Groundhog Days shown in the 1993 movie.
🔗 bit.ly/3ZvryRs
Many thanks to @zachbowders.bsky.social for providing feedback!

December 9, 2024 at 4:08 PM
I know most people are focused on the upcoming holiday season, but I'm looking ahead to Groundhog Day!
My new @tableaupublic.bsky.social viz displays data for the 38 Groundhog Days shown in the 1993 movie.
🔗 bit.ly/3ZvryRs
Many thanks to @zachbowders.bsky.social for providing feedback!
My new @tableaupublic.bsky.social viz displays data for the 38 Groundhog Days shown in the 1993 movie.
🔗 bit.ly/3ZvryRs
Many thanks to @zachbowders.bsky.social for providing feedback!
Reposted by Britt Staniar

You love charts, right📊? And you love TV📺 too?
Then join us next Thu, 11am ET for our rundown on our Top 10 TV Charts.
👉https://www.tickettailor.com/events/datarevelations/1468496/r/ac
cc: @abmakulec.bsky.social , @datarevelations.com
Then join us next Thu, 11am ET for our rundown on our Top 10 TV Charts.
👉https://www.tickettailor.com/events/datarevelations/1468496/r/ac
cc: @abmakulec.bsky.social , @datarevelations.com
December 7, 2024 at 12:10 PM
You love charts, right📊? And you love TV📺 too?
Then join us next Thu, 11am ET for our rundown on our Top 10 TV Charts.
👉https://www.tickettailor.com/events/datarevelations/1468496/r/ac
cc: @abmakulec.bsky.social , @datarevelations.com
Then join us next Thu, 11am ET for our rundown on our Top 10 TV Charts.
👉https://www.tickettailor.com/events/datarevelations/1468496/r/ac
cc: @abmakulec.bsky.social , @datarevelations.com