


Brad W
@bradw.bsky.social
Interested in Western Australia's main electricity grid and other goings on in climate and energy.
Weekly summaries of the WEM.
He/Him.
Weekly summaries of the WEM.
He/Him.
WEM stats — week ending 23 November:
WEM generation by technology
• Rooftop Solar: 25.1%
• Utility Solar: 2.8%
• Wind: 16.6%
• Pumped Hydro: 0.0%
• Battery Discharge 2.9% (2.0% Ren.)
• Gas: 26.4%
• Coal: 26.2%
• Distillate: 0.0%
Renewable contribution to demand:
• WA: 46.5%
🔌💡
WEM generation by technology
• Rooftop Solar: 25.1%
• Utility Solar: 2.8%
• Wind: 16.6%
• Pumped Hydro: 0.0%
• Battery Discharge 2.9% (2.0% Ren.)
• Gas: 26.4%
• Coal: 26.2%
• Distillate: 0.0%
Renewable contribution to demand:
• WA: 46.5%
🔌💡

November 29, 2025 at 7:49 AM
WEM stats — week ending 23 November:
WEM generation by technology
• Rooftop Solar: 25.1%
• Utility Solar: 2.8%
• Wind: 16.6%
• Pumped Hydro: 0.0%
• Battery Discharge 2.9% (2.0% Ren.)
• Gas: 26.4%
• Coal: 26.2%
• Distillate: 0.0%
Renewable contribution to demand:
• WA: 46.5%
🔌💡
WEM generation by technology
• Rooftop Solar: 25.1%
• Utility Solar: 2.8%
• Wind: 16.6%
• Pumped Hydro: 0.0%
• Battery Discharge 2.9% (2.0% Ren.)
• Gas: 26.4%
• Coal: 26.2%
• Distillate: 0.0%
Renewable contribution to demand:
• WA: 46.5%
🔌💡
New highest percentage of renewables for a calendar week on the SWIS of 60.1%, for the week ending 16 November 2025.
New minimum scheduled demand on the SWIS of 318 MW recorded on 16 November 2025 at 8:00 AM.
New minimum scheduled demand on the SWIS of 318 MW recorded on 16 November 2025 at 8:00 AM.
November 17, 2025 at 1:55 PM
New highest percentage of renewables for a calendar week on the SWIS of 60.1%, for the week ending 16 November 2025.
New minimum scheduled demand on the SWIS of 318 MW recorded on 16 November 2025 at 8:00 AM.
New minimum scheduled demand on the SWIS of 318 MW recorded on 16 November 2025 at 8:00 AM.
WEM stats — week ending 16 November:
WEM generation by technology
• Rooftop Solar: 34.0%
• Utility Solar: 3.2%
• Wind: 20.7%
• Pumped Hydro: 0.0%
• Battery Discharge 2.7% (2.2% Ren.)
• Gas: 20.1%
• Coal: 19.2%
• Distillate: 0.1%
Renewable contribution to demand:
• WA: 60.1%
🔌💡
WEM generation by technology
• Rooftop Solar: 34.0%
• Utility Solar: 3.2%
• Wind: 20.7%
• Pumped Hydro: 0.0%
• Battery Discharge 2.7% (2.2% Ren.)
• Gas: 20.1%
• Coal: 19.2%
• Distillate: 0.1%
Renewable contribution to demand:
• WA: 60.1%
🔌💡

November 17, 2025 at 1:52 PM
WEM stats — week ending 16 November:
WEM generation by technology
• Rooftop Solar: 34.0%
• Utility Solar: 3.2%
• Wind: 20.7%
• Pumped Hydro: 0.0%
• Battery Discharge 2.7% (2.2% Ren.)
• Gas: 20.1%
• Coal: 19.2%
• Distillate: 0.1%
Renewable contribution to demand:
• WA: 60.1%
🔌💡
WEM generation by technology
• Rooftop Solar: 34.0%
• Utility Solar: 3.2%
• Wind: 20.7%
• Pumped Hydro: 0.0%
• Battery Discharge 2.7% (2.2% Ren.)
• Gas: 20.1%
• Coal: 19.2%
• Distillate: 0.1%
Renewable contribution to demand:
• WA: 60.1%
🔌💡
New peak instantaneous percentage of renewables on the SWIS of 90.8%, recorded on 3 November 2025 at 11:05 AM.
November 12, 2025 at 2:24 PM
New peak instantaneous percentage of renewables on the SWIS of 90.8%, recorded on 3 November 2025 at 11:05 AM.
WEM stats — week ending 9 November:
WEM generation by technology
• Rooftop Solar: 29.1%
• Utility Solar: 2.9%
• Wind: 21.4%
• Pumped Hydro: 0.0%
• Battery Discharge 3.5% (2.6% Ren.)
• Gas: 22.1%
• Coal: 20.8%
• Distillate: 0.2%
Renewable contribution to demand:
• WA: 56.0%
🔌💡
WEM generation by technology
• Rooftop Solar: 29.1%
• Utility Solar: 2.9%
• Wind: 21.4%
• Pumped Hydro: 0.0%
• Battery Discharge 3.5% (2.6% Ren.)
• Gas: 22.1%
• Coal: 20.8%
• Distillate: 0.2%
Renewable contribution to demand:
• WA: 56.0%
🔌💡

November 12, 2025 at 2:18 PM
WEM stats — week ending 9 November:
WEM generation by technology
• Rooftop Solar: 29.1%
• Utility Solar: 2.9%
• Wind: 21.4%
• Pumped Hydro: 0.0%
• Battery Discharge 3.5% (2.6% Ren.)
• Gas: 22.1%
• Coal: 20.8%
• Distillate: 0.2%
Renewable contribution to demand:
• WA: 56.0%
🔌💡
WEM generation by technology
• Rooftop Solar: 29.1%
• Utility Solar: 2.9%
• Wind: 21.4%
• Pumped Hydro: 0.0%
• Battery Discharge 3.5% (2.6% Ren.)
• Gas: 22.1%
• Coal: 20.8%
• Distillate: 0.2%
Renewable contribution to demand:
• WA: 56.0%
🔌💡
New peak instantaneous percentage of renewables on the SWIS of 89.2%, recorded on 2 November 2025 at 9:05 AM.
New minimum scheduled demand on the SWIS of 323 MW recorded on 2 November 2025 at 9:00 AM.
🔌💡
New minimum scheduled demand on the SWIS of 323 MW recorded on 2 November 2025 at 9:00 AM.
🔌💡
November 5, 2025 at 11:16 AM
New peak instantaneous percentage of renewables on the SWIS of 89.2%, recorded on 2 November 2025 at 9:05 AM.
New minimum scheduled demand on the SWIS of 323 MW recorded on 2 November 2025 at 9:00 AM.
🔌💡
New minimum scheduled demand on the SWIS of 323 MW recorded on 2 November 2025 at 9:00 AM.
🔌💡
WEM stats — week ending 2 November:
WEM generation by technology
• Rooftop Solar: 29.6%
• Utility Solar: 3.6%
• Wind: 19.0%
• Pumped Hydro: 0.0%
• Battery Discharge 3.4% (2.8% Ren.)
• Gas: 24.0%
• Coal: 20.4%
• Distillate: 0.0%
Renewable contribution to demand:
• WA: 55.0%
🔌💡
WEM generation by technology
• Rooftop Solar: 29.6%
• Utility Solar: 3.6%
• Wind: 19.0%
• Pumped Hydro: 0.0%
• Battery Discharge 3.4% (2.8% Ren.)
• Gas: 24.0%
• Coal: 20.4%
• Distillate: 0.0%
Renewable contribution to demand:
• WA: 55.0%
🔌💡

November 4, 2025 at 1:24 PM
WEM stats — week ending 2 November:
WEM generation by technology
• Rooftop Solar: 29.6%
• Utility Solar: 3.6%
• Wind: 19.0%
• Pumped Hydro: 0.0%
• Battery Discharge 3.4% (2.8% Ren.)
• Gas: 24.0%
• Coal: 20.4%
• Distillate: 0.0%
Renewable contribution to demand:
• WA: 55.0%
🔌💡
WEM generation by technology
• Rooftop Solar: 29.6%
• Utility Solar: 3.6%
• Wind: 19.0%
• Pumped Hydro: 0.0%
• Battery Discharge 3.4% (2.8% Ren.)
• Gas: 24.0%
• Coal: 20.4%
• Distillate: 0.0%
Renewable contribution to demand:
• WA: 55.0%
🔌💡
WEM stats — week ending 26 October:
WEM generation by technology
• Rooftop Solar: 27.1%
• Utility Solar: 3.0%
• Wind: 15.9%
• Pumped Hydro: 0.0%
• Battery Discharge 3.0% (2.2% Ren.)
• Gas: 27.5%
• Coal: 23.5%
• Distillate: 0.0%
Renewable contribution to demand:
• WA: 48.2%
🔌💡
WEM generation by technology
• Rooftop Solar: 27.1%
• Utility Solar: 3.0%
• Wind: 15.9%
• Pumped Hydro: 0.0%
• Battery Discharge 3.0% (2.2% Ren.)
• Gas: 27.5%
• Coal: 23.5%
• Distillate: 0.0%
Renewable contribution to demand:
• WA: 48.2%
🔌💡

October 28, 2025 at 1:07 PM
WEM stats — week ending 26 October:
WEM generation by technology
• Rooftop Solar: 27.1%
• Utility Solar: 3.0%
• Wind: 15.9%
• Pumped Hydro: 0.0%
• Battery Discharge 3.0% (2.2% Ren.)
• Gas: 27.5%
• Coal: 23.5%
• Distillate: 0.0%
Renewable contribution to demand:
• WA: 48.2%
🔌💡
WEM generation by technology
• Rooftop Solar: 27.1%
• Utility Solar: 3.0%
• Wind: 15.9%
• Pumped Hydro: 0.0%
• Battery Discharge 3.0% (2.2% Ren.)
• Gas: 27.5%
• Coal: 23.5%
• Distillate: 0.0%
Renewable contribution to demand:
• WA: 48.2%
🔌💡
WEM stats — week ending 19 October:
WEM generation by technology
• Rooftop Solar: 29.0%
• Utility Solar: 3.4%
• Wind: 12.5%
• Pumped Hydro: 0.0%
• Battery Discharge 3.2% (2.4% Ren.)
• Gas: 24.1%
• Coal: 27.7%
• Distillate: 0.0%
Renewable contribution to demand:
• WA: 47.4%
🔌💡
WEM generation by technology
• Rooftop Solar: 29.0%
• Utility Solar: 3.4%
• Wind: 12.5%
• Pumped Hydro: 0.0%
• Battery Discharge 3.2% (2.4% Ren.)
• Gas: 24.1%
• Coal: 27.7%
• Distillate: 0.0%
Renewable contribution to demand:
• WA: 47.4%
🔌💡

October 26, 2025 at 5:39 AM
WEM stats — week ending 19 October:
WEM generation by technology
• Rooftop Solar: 29.0%
• Utility Solar: 3.4%
• Wind: 12.5%
• Pumped Hydro: 0.0%
• Battery Discharge 3.2% (2.4% Ren.)
• Gas: 24.1%
• Coal: 27.7%
• Distillate: 0.0%
Renewable contribution to demand:
• WA: 47.4%
🔌💡
WEM generation by technology
• Rooftop Solar: 29.0%
• Utility Solar: 3.4%
• Wind: 12.5%
• Pumped Hydro: 0.0%
• Battery Discharge 3.2% (2.4% Ren.)
• Gas: 24.1%
• Coal: 27.7%
• Distillate: 0.0%
Renewable contribution to demand:
• WA: 47.4%
🔌💡
WEM stats — week ending 12 October:
WEM generation by technology
• Rooftop Solar: 29.8%
• Utility Solar: 3.5%
• Wind: 12.2%
• Pumped Hydro: 0.0%
• Battery Discharge 2.7% (1.9% Ren.)
• Gas: 30.7%
• Coal: 21.1%
• Distillate: 0.0%
Renewable contribution to demand:
• WA: 47.4%
🔌💡
WEM generation by technology
• Rooftop Solar: 29.8%
• Utility Solar: 3.5%
• Wind: 12.2%
• Pumped Hydro: 0.0%
• Battery Discharge 2.7% (1.9% Ren.)
• Gas: 30.7%
• Coal: 21.1%
• Distillate: 0.0%
Renewable contribution to demand:
• WA: 47.4%
🔌💡

October 26, 2025 at 5:08 AM
WEM stats — week ending 12 October:
WEM generation by technology
• Rooftop Solar: 29.8%
• Utility Solar: 3.5%
• Wind: 12.2%
• Pumped Hydro: 0.0%
• Battery Discharge 2.7% (1.9% Ren.)
• Gas: 30.7%
• Coal: 21.1%
• Distillate: 0.0%
Renewable contribution to demand:
• WA: 47.4%
🔌💡
WEM generation by technology
• Rooftop Solar: 29.8%
• Utility Solar: 3.5%
• Wind: 12.2%
• Pumped Hydro: 0.0%
• Battery Discharge 2.7% (1.9% Ren.)
• Gas: 30.7%
• Coal: 21.1%
• Distillate: 0.0%
Renewable contribution to demand:
• WA: 47.4%
🔌💡
WEM stats — week ending 5 October:
WEM generation by technology
• Rooftop Solar: 23.7%
• Utility Solar: 2.7%
• Wind: 14.1%
• Pumped Hydro: 0.0%
• Battery Discharge 3.4% (2.3% Ren.)
• Gas: 31.8%
• Coal: 24.2%
• Distillate: 0.0%
Renewable contribution to demand:
• WA: 42.8%
🔌💡
WEM generation by technology
• Rooftop Solar: 23.7%
• Utility Solar: 2.7%
• Wind: 14.1%
• Pumped Hydro: 0.0%
• Battery Discharge 3.4% (2.3% Ren.)
• Gas: 31.8%
• Coal: 24.2%
• Distillate: 0.0%
Renewable contribution to demand:
• WA: 42.8%
🔌💡

October 10, 2025 at 3:35 AM
WEM stats — week ending 5 October:
WEM generation by technology
• Rooftop Solar: 23.7%
• Utility Solar: 2.7%
• Wind: 14.1%
• Pumped Hydro: 0.0%
• Battery Discharge 3.4% (2.3% Ren.)
• Gas: 31.8%
• Coal: 24.2%
• Distillate: 0.0%
Renewable contribution to demand:
• WA: 42.8%
🔌💡
WEM generation by technology
• Rooftop Solar: 23.7%
• Utility Solar: 2.7%
• Wind: 14.1%
• Pumped Hydro: 0.0%
• Battery Discharge 3.4% (2.3% Ren.)
• Gas: 31.8%
• Coal: 24.2%
• Distillate: 0.0%
Renewable contribution to demand:
• WA: 42.8%
🔌💡
WEM stats — week ending 28 September:
WEM generation by technology
• Rooftop Solar: 29.3%
• Utility Solar: 3.3%
• Wind: 16.2%
• Pumped Hydro: 0.0%
• Battery Discharge 3.2% (2.4% Ren.)
• Gas: 23.9%
• Coal: 24.1%
• Distillate: 0.0%
Renewable contribution to demand:
• WA: 51.2%
🔌💡
WEM generation by technology
• Rooftop Solar: 29.3%
• Utility Solar: 3.3%
• Wind: 16.2%
• Pumped Hydro: 0.0%
• Battery Discharge 3.2% (2.4% Ren.)
• Gas: 23.9%
• Coal: 24.1%
• Distillate: 0.0%
Renewable contribution to demand:
• WA: 51.2%
🔌💡

October 10, 2025 at 2:59 AM
WEM stats — week ending 28 September:
WEM generation by technology
• Rooftop Solar: 29.3%
• Utility Solar: 3.3%
• Wind: 16.2%
• Pumped Hydro: 0.0%
• Battery Discharge 3.2% (2.4% Ren.)
• Gas: 23.9%
• Coal: 24.1%
• Distillate: 0.0%
Renewable contribution to demand:
• WA: 51.2%
🔌💡
WEM generation by technology
• Rooftop Solar: 29.3%
• Utility Solar: 3.3%
• Wind: 16.2%
• Pumped Hydro: 0.0%
• Battery Discharge 3.2% (2.4% Ren.)
• Gas: 23.9%
• Coal: 24.1%
• Distillate: 0.0%
Renewable contribution to demand:
• WA: 51.2%
🔌💡
WEM stats — week ending 21 September:
WEM generation by technology
• Rooftop Solar: 23.2%
• Utility Solar: 2.4%
• Wind: 12.2%
• Pumped Hydro: 0.0%
• Battery Discharge 2.8% (1.7% Ren.)
• Gas: 30.5%
• Coal: 28.9%
• Distillate: 0.0%
Renewable contribution to demand:
• WA: 39.5%
WEM generation by technology
• Rooftop Solar: 23.2%
• Utility Solar: 2.4%
• Wind: 12.2%
• Pumped Hydro: 0.0%
• Battery Discharge 2.8% (1.7% Ren.)
• Gas: 30.5%
• Coal: 28.9%
• Distillate: 0.0%
Renewable contribution to demand:
• WA: 39.5%

September 25, 2025 at 9:58 AM
WEM stats — week ending 21 September:
WEM generation by technology
• Rooftop Solar: 23.2%
• Utility Solar: 2.4%
• Wind: 12.2%
• Pumped Hydro: 0.0%
• Battery Discharge 2.8% (1.7% Ren.)
• Gas: 30.5%
• Coal: 28.9%
• Distillate: 0.0%
Renewable contribution to demand:
• WA: 39.5%
WEM generation by technology
• Rooftop Solar: 23.2%
• Utility Solar: 2.4%
• Wind: 12.2%
• Pumped Hydro: 0.0%
• Battery Discharge 2.8% (1.7% Ren.)
• Gas: 30.5%
• Coal: 28.9%
• Distillate: 0.0%
Renewable contribution to demand:
• WA: 39.5%
WEM stats — week ending 14 September:
WEM generation by technology
• Rooftop Solar: 23.4%
• Utility Solar: 2.2%
• Wind: 18.4%
• Pumped Hydro: 0.0%
• Battery Discharge 2.8% (1.8% Ren.)
• Gas: 21.9%
• Coal: 31.3%
• Distillate: 0.0%
Renewable contribution to demand:
• WA: 45.8%
🔌💡
WEM generation by technology
• Rooftop Solar: 23.4%
• Utility Solar: 2.2%
• Wind: 18.4%
• Pumped Hydro: 0.0%
• Battery Discharge 2.8% (1.8% Ren.)
• Gas: 21.9%
• Coal: 31.3%
• Distillate: 0.0%
Renewable contribution to demand:
• WA: 45.8%
🔌💡

September 19, 2025 at 9:38 AM
WEM stats — week ending 14 September:
WEM generation by technology
• Rooftop Solar: 23.4%
• Utility Solar: 2.2%
• Wind: 18.4%
• Pumped Hydro: 0.0%
• Battery Discharge 2.8% (1.8% Ren.)
• Gas: 21.9%
• Coal: 31.3%
• Distillate: 0.0%
Renewable contribution to demand:
• WA: 45.8%
🔌💡
WEM generation by technology
• Rooftop Solar: 23.4%
• Utility Solar: 2.2%
• Wind: 18.4%
• Pumped Hydro: 0.0%
• Battery Discharge 2.8% (1.8% Ren.)
• Gas: 21.9%
• Coal: 31.3%
• Distillate: 0.0%
Renewable contribution to demand:
• WA: 45.8%
🔌💡
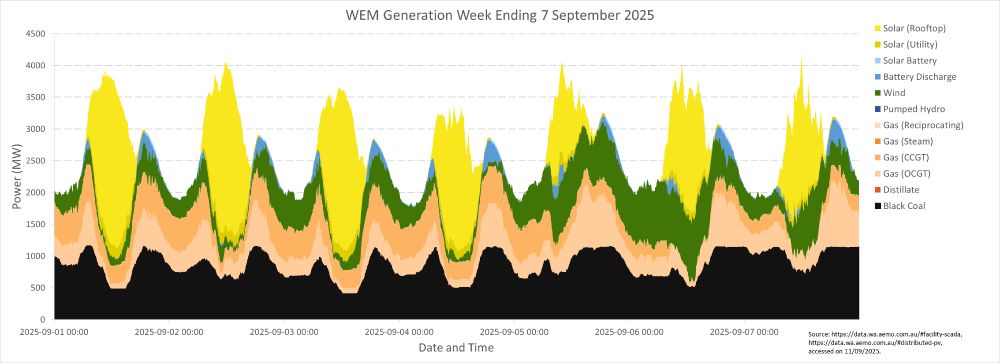
WEM stats — week ending 7 September:
WEM generation by technology
• Rooftop Solar: 21.0%
• Utility Solar: 2.1%
• Wind: 16.5%
• Pumped Hydro: 0.0%
• Battery Discharge 2.1% (1.2% Ren.)
• Gas: 26.8%
• Coal: 31.5%
• Distillate: 0.0%
Renewable contribution to demand:
• WA: 40.8%
🔌💡
WEM generation by technology
• Rooftop Solar: 21.0%
• Utility Solar: 2.1%
• Wind: 16.5%
• Pumped Hydro: 0.0%
• Battery Discharge 2.1% (1.2% Ren.)
• Gas: 26.8%
• Coal: 31.5%
• Distillate: 0.0%
Renewable contribution to demand:
• WA: 40.8%
🔌💡
September 11, 2025 at 9:44 AM
WEM stats — week ending 7 September:
WEM generation by technology
• Rooftop Solar: 21.0%
• Utility Solar: 2.1%
• Wind: 16.5%
• Pumped Hydro: 0.0%
• Battery Discharge 2.1% (1.2% Ren.)
• Gas: 26.8%
• Coal: 31.5%
• Distillate: 0.0%
Renewable contribution to demand:
• WA: 40.8%
🔌💡
WEM generation by technology
• Rooftop Solar: 21.0%
• Utility Solar: 2.1%
• Wind: 16.5%
• Pumped Hydro: 0.0%
• Battery Discharge 2.1% (1.2% Ren.)
• Gas: 26.8%
• Coal: 31.5%
• Distillate: 0.0%
Renewable contribution to demand:
• WA: 40.8%
🔌💡
WEM stats — week ending 31 August:
WEM generation by technology
• Rooftop Solar: 19.8%
• Utility Solar: 1.9%
• Wind: 12.7%
• Pumped Hydro: 0.0%
• Battery Discharge 2.9% (1.4% Ren.)
• Gas: 40.2%
• Coal: 22.4%
• Distillate: 0.1%
Renewable contribution to demand:
• WA: 35.8%
🔌💡
WEM generation by technology
• Rooftop Solar: 19.8%
• Utility Solar: 1.9%
• Wind: 12.7%
• Pumped Hydro: 0.0%
• Battery Discharge 2.9% (1.4% Ren.)
• Gas: 40.2%
• Coal: 22.4%
• Distillate: 0.1%
Renewable contribution to demand:
• WA: 35.8%
🔌💡

September 11, 2025 at 9:36 AM
WEM stats — week ending 31 August:
WEM generation by technology
• Rooftop Solar: 19.8%
• Utility Solar: 1.9%
• Wind: 12.7%
• Pumped Hydro: 0.0%
• Battery Discharge 2.9% (1.4% Ren.)
• Gas: 40.2%
• Coal: 22.4%
• Distillate: 0.1%
Renewable contribution to demand:
• WA: 35.8%
🔌💡
WEM generation by technology
• Rooftop Solar: 19.8%
• Utility Solar: 1.9%
• Wind: 12.7%
• Pumped Hydro: 0.0%
• Battery Discharge 2.9% (1.4% Ren.)
• Gas: 40.2%
• Coal: 22.4%
• Distillate: 0.1%
Renewable contribution to demand:
• WA: 35.8%
🔌💡
WEM stats — week ending 24 August:
WEM generation by technology
• Rooftop Solar: 16.6%
• Utility Solar: 1.4%
• Wind: 14.3%
• Pumped Hydro: 0.0%
• Battery Discharge 3.0% (1.5% Ren.)
• Gas: 37.5%
• Coal: 27.2%
• Distillate: 0.0%
Renewable contribution to demand:
• WA: 33.8%
🔌💡
WEM generation by technology
• Rooftop Solar: 16.6%
• Utility Solar: 1.4%
• Wind: 14.3%
• Pumped Hydro: 0.0%
• Battery Discharge 3.0% (1.5% Ren.)
• Gas: 37.5%
• Coal: 27.2%
• Distillate: 0.0%
Renewable contribution to demand:
• WA: 33.8%
🔌💡

September 11, 2025 at 9:35 AM
WEM stats — week ending 24 August:
WEM generation by technology
• Rooftop Solar: 16.6%
• Utility Solar: 1.4%
• Wind: 14.3%
• Pumped Hydro: 0.0%
• Battery Discharge 3.0% (1.5% Ren.)
• Gas: 37.5%
• Coal: 27.2%
• Distillate: 0.0%
Renewable contribution to demand:
• WA: 33.8%
🔌💡
WEM generation by technology
• Rooftop Solar: 16.6%
• Utility Solar: 1.4%
• Wind: 14.3%
• Pumped Hydro: 0.0%
• Battery Discharge 3.0% (1.5% Ren.)
• Gas: 37.5%
• Coal: 27.2%
• Distillate: 0.0%
Renewable contribution to demand:
• WA: 33.8%
🔌💡
WEM stats — week ending 17 August:
WEM generation by technology
• Rooftop Solar: 22.2%
• Utility Solar: 2.1%
• Wind: 18.7%
• Pumped Hydro: 0.0%
• Battery Discharge 3.0% (1.9% Ren.)
• Gas: 29.6%
• Coal: 24.4%
• Distillate: 0.0%
Renewable contribution to demand:
• WA: 44.9%
🔌💡
WEM generation by technology
• Rooftop Solar: 22.2%
• Utility Solar: 2.1%
• Wind: 18.7%
• Pumped Hydro: 0.0%
• Battery Discharge 3.0% (1.9% Ren.)
• Gas: 29.6%
• Coal: 24.4%
• Distillate: 0.0%
Renewable contribution to demand:
• WA: 44.9%
🔌💡

August 29, 2025 at 8:17 AM
WEM stats — week ending 17 August:
WEM generation by technology
• Rooftop Solar: 22.2%
• Utility Solar: 2.1%
• Wind: 18.7%
• Pumped Hydro: 0.0%
• Battery Discharge 3.0% (1.9% Ren.)
• Gas: 29.6%
• Coal: 24.4%
• Distillate: 0.0%
Renewable contribution to demand:
• WA: 44.9%
🔌💡
WEM generation by technology
• Rooftop Solar: 22.2%
• Utility Solar: 2.1%
• Wind: 18.7%
• Pumped Hydro: 0.0%
• Battery Discharge 3.0% (1.9% Ren.)
• Gas: 29.6%
• Coal: 24.4%
• Distillate: 0.0%
Renewable contribution to demand:
• WA: 44.9%
🔌💡
WEM stats — week ending 10 August:
WEM generation by technology
• Rooftop Solar: 18.4%
• Utility Solar: 1.2%
• Wind: 15.5%
• Pumped Hydro: 0.0%
• Battery Discharge 2.8% (1.4% Ren.)
• Gas: 30.6%
• Coal: 31.5%
• Distillate: 0.0%
Renewable contribution to demand:
• WA: 36.5%
🔌💡
WEM generation by technology
• Rooftop Solar: 18.4%
• Utility Solar: 1.2%
• Wind: 15.5%
• Pumped Hydro: 0.0%
• Battery Discharge 2.8% (1.4% Ren.)
• Gas: 30.6%
• Coal: 31.5%
• Distillate: 0.0%
Renewable contribution to demand:
• WA: 36.5%
🔌💡

August 23, 2025 at 5:09 AM
WEM stats — week ending 10 August:
WEM generation by technology
• Rooftop Solar: 18.4%
• Utility Solar: 1.2%
• Wind: 15.5%
• Pumped Hydro: 0.0%
• Battery Discharge 2.8% (1.4% Ren.)
• Gas: 30.6%
• Coal: 31.5%
• Distillate: 0.0%
Renewable contribution to demand:
• WA: 36.5%
🔌💡
WEM generation by technology
• Rooftop Solar: 18.4%
• Utility Solar: 1.2%
• Wind: 15.5%
• Pumped Hydro: 0.0%
• Battery Discharge 2.8% (1.4% Ren.)
• Gas: 30.6%
• Coal: 31.5%
• Distillate: 0.0%
Renewable contribution to demand:
• WA: 36.5%
🔌💡
WEM stats — week ending 3 August:
WEM generation by technology
• Rooftop Solar: 16.2%
• Utility Solar: 1.2%
• Wind: 18.0%
• Pumped Hydro: 0.0%
• Battery Discharge 2.5% (1.3% Ren.)
• Gas: 30.0%
• Coal: 32.0%
• Distillate: 0.1%
Renewable contribution to demand:
• WA: 36.7%
🔌💡
WEM generation by technology
• Rooftop Solar: 16.2%
• Utility Solar: 1.2%
• Wind: 18.0%
• Pumped Hydro: 0.0%
• Battery Discharge 2.5% (1.3% Ren.)
• Gas: 30.0%
• Coal: 32.0%
• Distillate: 0.1%
Renewable contribution to demand:
• WA: 36.7%
🔌💡

August 23, 2025 at 4:07 AM
WEM stats — week ending 3 August:
WEM generation by technology
• Rooftop Solar: 16.2%
• Utility Solar: 1.2%
• Wind: 18.0%
• Pumped Hydro: 0.0%
• Battery Discharge 2.5% (1.3% Ren.)
• Gas: 30.0%
• Coal: 32.0%
• Distillate: 0.1%
Renewable contribution to demand:
• WA: 36.7%
🔌💡
WEM generation by technology
• Rooftop Solar: 16.2%
• Utility Solar: 1.2%
• Wind: 18.0%
• Pumped Hydro: 0.0%
• Battery Discharge 2.5% (1.3% Ren.)
• Gas: 30.0%
• Coal: 32.0%
• Distillate: 0.1%
Renewable contribution to demand:
• WA: 36.7%
🔌💡
WEM stats — week ending 27 July:
WEM generation by technology
• Rooftop Solar: 9.1%
• Utility Solar: 1.0%
• Wind: 14.5%
• Pumped Hydro: 0.0%
• Battery Discharge 2.7% (1.1% Ren.)
• Gas: 41.3%
• Coal: 31.3%
• Distillate: 0.1%
Renewable contribution to demand:
• WA: 25.7%
🔌💡
WEM generation by technology
• Rooftop Solar: 9.1%
• Utility Solar: 1.0%
• Wind: 14.5%
• Pumped Hydro: 0.0%
• Battery Discharge 2.7% (1.1% Ren.)
• Gas: 41.3%
• Coal: 31.3%
• Distillate: 0.1%
Renewable contribution to demand:
• WA: 25.7%
🔌💡

August 16, 2025 at 8:00 AM
WEM stats — week ending 27 July:
WEM generation by technology
• Rooftop Solar: 9.1%
• Utility Solar: 1.0%
• Wind: 14.5%
• Pumped Hydro: 0.0%
• Battery Discharge 2.7% (1.1% Ren.)
• Gas: 41.3%
• Coal: 31.3%
• Distillate: 0.1%
Renewable contribution to demand:
• WA: 25.7%
🔌💡
WEM generation by technology
• Rooftop Solar: 9.1%
• Utility Solar: 1.0%
• Wind: 14.5%
• Pumped Hydro: 0.0%
• Battery Discharge 2.7% (1.1% Ren.)
• Gas: 41.3%
• Coal: 31.3%
• Distillate: 0.1%
Renewable contribution to demand:
• WA: 25.7%
🔌💡
WEM stats — week ending 20 July:
WEM generation by technology
• Rooftop Solar: 9.0%
• Utility Solar: 1.2%
• Wind: 12.8%
• Pumped Hydro: 0.0%
• Battery Discharge 2.1% (0.8% Ren.)
• Gas: 41.4%
• Coal: 33.4%
• Distillate: 0.0%
Renewable contribution to demand:
• WA: 23.8%
🔌💡
WEM generation by technology
• Rooftop Solar: 9.0%
• Utility Solar: 1.2%
• Wind: 12.8%
• Pumped Hydro: 0.0%
• Battery Discharge 2.1% (0.8% Ren.)
• Gas: 41.4%
• Coal: 33.4%
• Distillate: 0.0%
Renewable contribution to demand:
• WA: 23.8%
🔌💡

August 16, 2025 at 4:31 AM
WEM stats — week ending 20 July:
WEM generation by technology
• Rooftop Solar: 9.0%
• Utility Solar: 1.2%
• Wind: 12.8%
• Pumped Hydro: 0.0%
• Battery Discharge 2.1% (0.8% Ren.)
• Gas: 41.4%
• Coal: 33.4%
• Distillate: 0.0%
Renewable contribution to demand:
• WA: 23.8%
🔌💡
WEM generation by technology
• Rooftop Solar: 9.0%
• Utility Solar: 1.2%
• Wind: 12.8%
• Pumped Hydro: 0.0%
• Battery Discharge 2.1% (0.8% Ren.)
• Gas: 41.4%
• Coal: 33.4%
• Distillate: 0.0%
Renewable contribution to demand:
• WA: 23.8%
🔌💡
WEM stats — week ending 13 July:
WEM generation by technology
• Rooftop Solar: 13.4%
• Utility Solar: 1.3%
• Wind: 15.6%
• Pumped Hydro: 0.0%
• Battery Discharge 2.1% (0.9% Ren.)
• Gas: 36.2%
• Coal: 31.4%
• Distillate: 0.0%
Renewable contribution to demand:
• WA: 31.2%
🔌💡
WEM generation by technology
• Rooftop Solar: 13.4%
• Utility Solar: 1.3%
• Wind: 15.6%
• Pumped Hydro: 0.0%
• Battery Discharge 2.1% (0.9% Ren.)
• Gas: 36.2%
• Coal: 31.4%
• Distillate: 0.0%
Renewable contribution to demand:
• WA: 31.2%
🔌💡

August 16, 2025 at 3:57 AM
WEM stats — week ending 13 July:
WEM generation by technology
• Rooftop Solar: 13.4%
• Utility Solar: 1.3%
• Wind: 15.6%
• Pumped Hydro: 0.0%
• Battery Discharge 2.1% (0.9% Ren.)
• Gas: 36.2%
• Coal: 31.4%
• Distillate: 0.0%
Renewable contribution to demand:
• WA: 31.2%
🔌💡
WEM generation by technology
• Rooftop Solar: 13.4%
• Utility Solar: 1.3%
• Wind: 15.6%
• Pumped Hydro: 0.0%
• Battery Discharge 2.1% (0.9% Ren.)
• Gas: 36.2%
• Coal: 31.4%
• Distillate: 0.0%
Renewable contribution to demand:
• WA: 31.2%
🔌💡
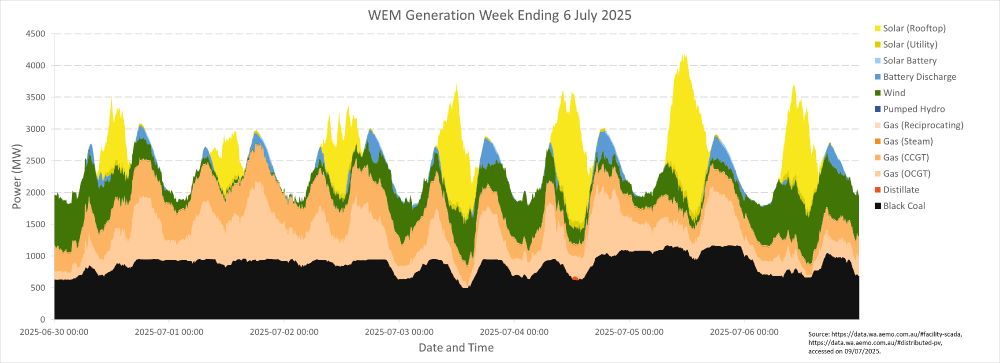
WEM stats — week ending 6 July:
WEM generation by technology
• Rooftop Solar: 12.1%
• Utility Solar: 1.0%
• Wind: 14.9%
• Pumped Hydro: 0.0%
• Battery Discharge 2.4% (1.1% Ren.)
• Gas: 35.3%
• Coal: 34.3%
• Distillate: 0.0%
Renewable contribution to demand:
• WA: 29.1%
🔌💡
WEM generation by technology
• Rooftop Solar: 12.1%
• Utility Solar: 1.0%
• Wind: 14.9%
• Pumped Hydro: 0.0%
• Battery Discharge 2.4% (1.1% Ren.)
• Gas: 35.3%
• Coal: 34.3%
• Distillate: 0.0%
Renewable contribution to demand:
• WA: 29.1%
🔌💡
July 9, 2025 at 9:15 AM
WEM stats — week ending 6 July:
WEM generation by technology
• Rooftop Solar: 12.1%
• Utility Solar: 1.0%
• Wind: 14.9%
• Pumped Hydro: 0.0%
• Battery Discharge 2.4% (1.1% Ren.)
• Gas: 35.3%
• Coal: 34.3%
• Distillate: 0.0%
Renewable contribution to demand:
• WA: 29.1%
🔌💡
WEM generation by technology
• Rooftop Solar: 12.1%
• Utility Solar: 1.0%
• Wind: 14.9%
• Pumped Hydro: 0.0%
• Battery Discharge 2.4% (1.1% Ren.)
• Gas: 35.3%
• Coal: 34.3%
• Distillate: 0.0%
Renewable contribution to demand:
• WA: 29.1%
🔌💡
WEM stats — week ending 29 June:
WEM generation by technology
• Rooftop Solar: 15.4%
• Utility Solar: 1.4%
• Wind: 15.7%
• Pumped Hydro: 0.0%
• Battery Discharge 1.9% (0.8% Ren.)
• Gas: 37.6%
• Coal: 27.9%
• Distillate: 0.0%
Renewable contribution to demand:
• WA: 33.4%
🔌💡
WEM generation by technology
• Rooftop Solar: 15.4%
• Utility Solar: 1.4%
• Wind: 15.7%
• Pumped Hydro: 0.0%
• Battery Discharge 1.9% (0.8% Ren.)
• Gas: 37.6%
• Coal: 27.9%
• Distillate: 0.0%
Renewable contribution to demand:
• WA: 33.4%
🔌💡

July 6, 2025 at 9:39 AM
WEM stats — week ending 29 June:
WEM generation by technology
• Rooftop Solar: 15.4%
• Utility Solar: 1.4%
• Wind: 15.7%
• Pumped Hydro: 0.0%
• Battery Discharge 1.9% (0.8% Ren.)
• Gas: 37.6%
• Coal: 27.9%
• Distillate: 0.0%
Renewable contribution to demand:
• WA: 33.4%
🔌💡
WEM generation by technology
• Rooftop Solar: 15.4%
• Utility Solar: 1.4%
• Wind: 15.7%
• Pumped Hydro: 0.0%
• Battery Discharge 1.9% (0.8% Ren.)
• Gas: 37.6%
• Coal: 27.9%
• Distillate: 0.0%
Renewable contribution to demand:
• WA: 33.4%
🔌💡