


Brad Hershbein
@bradhershbein.bsky.social
Senior economist and deputy director of research at the @upjohninstitute. My research focuses on the transition between education and career and how employers hire and compensate workers. Creator of New Hires Quality Index. #NHQI
Taking a longer view, over the past 25 years, real wage growth of new hires has lagged considerably at the very bottom, even as inequality has closed between the lower-middle and the top. 20/20

September 3, 2025 at 1:11 PM
Taking a longer view, over the past 25 years, real wage growth of new hires has lagged considerably at the very bottom, even as inequality has closed between the lower-middle and the top. 20/20
This recent narrowing since the pandemic can be seen below, with the strongest cumulative gains in inflation-adjusted wages of new hires around the 30th percentile, with lower growth in the top half. 19/20

September 3, 2025 at 1:11 PM
This recent narrowing since the pandemic can be seen below, with the strongest cumulative gains in inflation-adjusted wages of new hires around the 30th percentile, with lower growth in the top half. 19/20
This means that the stagnation in mean wage growth, now in its 4th year, has been driven by different parts of the distribution since 2022. 17/20

September 3, 2025 at 1:11 PM
This means that the stagnation in mean wage growth, now in its 4th year, has been driven by different parts of the distribution since 2022. 17/20
These changes have been uneven, though. We can look at inflation-adjusted, self-reported hourly wages of new hires since 1999 at different parts of the wage distribution. 12/20
September 3, 2025 at 1:11 PM
These changes have been uneven, though. We can look at inflation-adjusted, self-reported hourly wages of new hires since 1999 at different parts of the wage distribution. 12/20
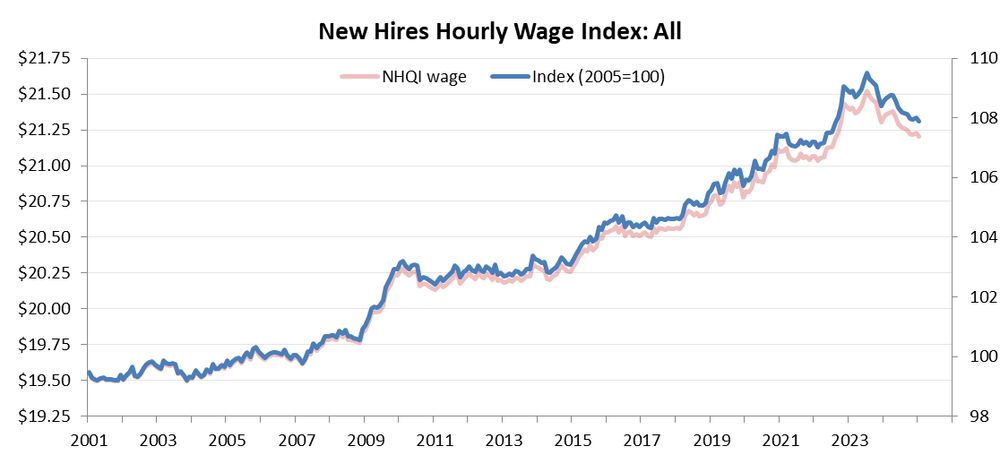
This stagnation over the past 3.5 years follows a blistering 23 percent inflation-adjusted increase between January 2015 and January 2022. 4/20

September 3, 2025 at 1:11 PM
This stagnation over the past 3.5 years follows a blistering 23 percent inflation-adjusted increase between January 2015 and January 2022. 4/20
Actual, inflation-adjusted wage growth of newly hired workers surged at an annualized rate of 3.5 percent between July 2020 and July 2022, then declined slightly over the next two years before recovering slightly in the 12 months to date. 2/20

September 3, 2025 at 1:11 PM
Actual, inflation-adjusted wage growth of newly hired workers surged at an annualized rate of 3.5 percent between July 2020 and July 2022, then declined slightly over the next two years before recovering slightly in the 12 months to date. 2/20
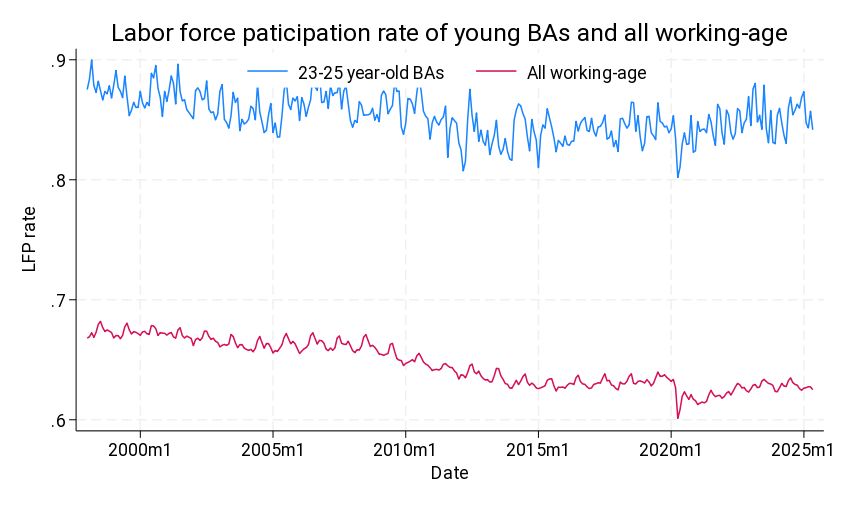
The reason for the different patterns? Changing labor force participation rates. Young college grads are about as likely to be in the labor force as they were at the end of the Greta Recession. All working age folks, not so much, as they have gotten much older on average.
June 26, 2025 at 2:30 PM
The reason for the different patterns? Changing labor force participation rates. Young college grads are about as likely to be in the labor force as they were at the end of the Greta Recession. All working age folks, not so much, as they have gotten much older on average.
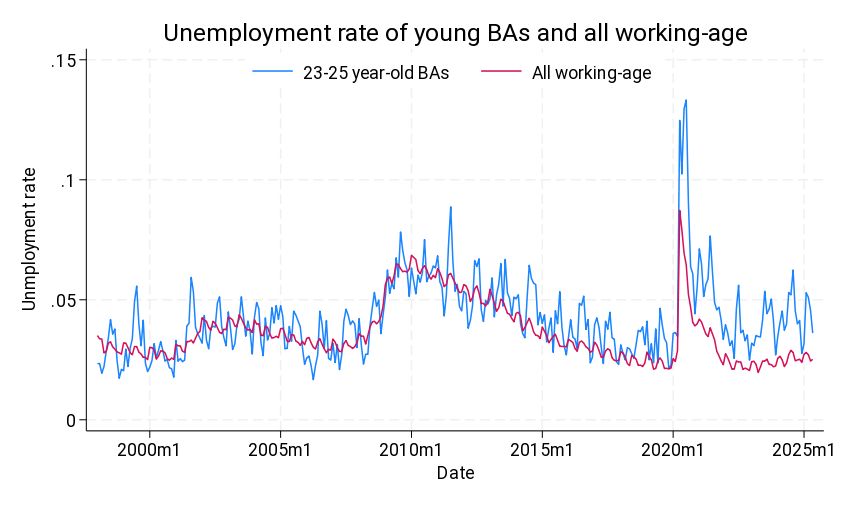
If we look at the *unemployment rate*--the fraction of people without a job and looking for one relative to people either with jobs or unemployed--we get this picture:
June 26, 2025 at 2:30 PM
If we look at the *unemployment rate*--the fraction of people without a job and looking for one relative to people either with jobs or unemployed--we get this picture:
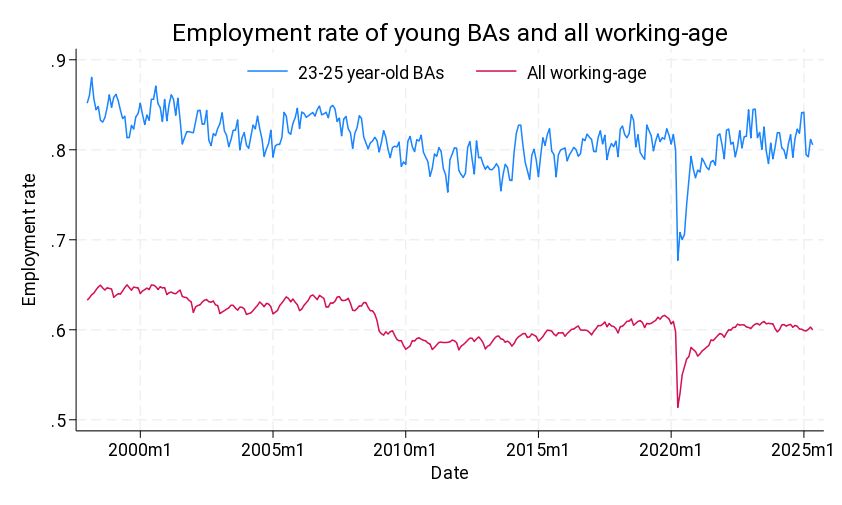
*Employment rates* are the share of people with jobs. Here's the graph for young BAs (age 23-25) and all working-age adults:
June 26, 2025 at 2:30 PM
*Employment rates* are the share of people with jobs. Here's the graph for young BAs (age 23-25) and all working-age adults:
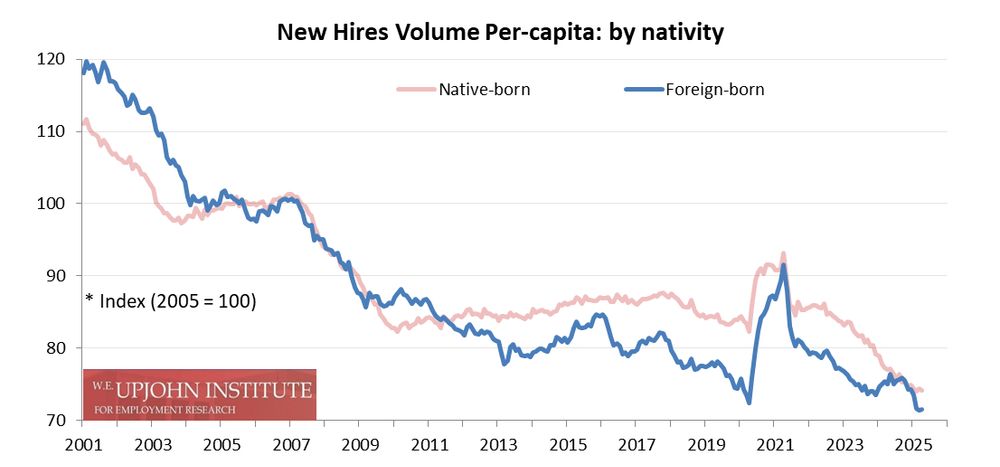
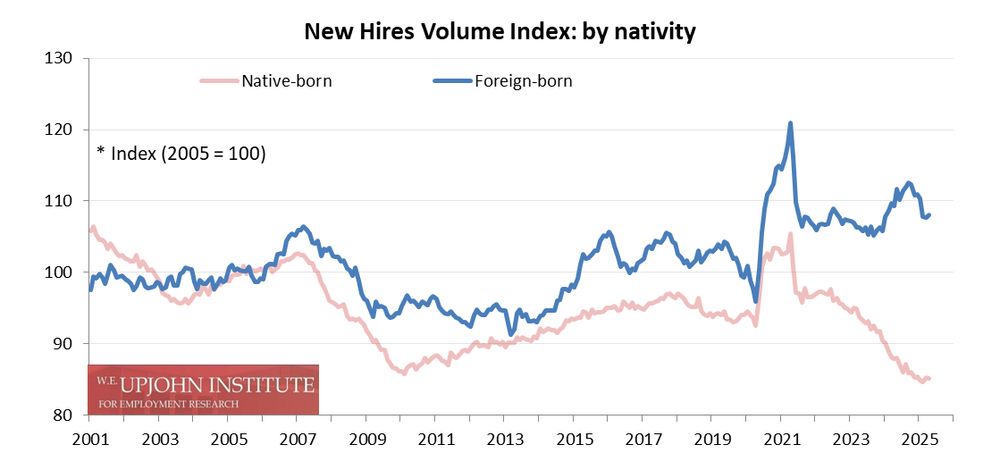
Of course, the number of the foreign-born in the U.S. has also increased, so if we look at *hiring rates* (hires per capita), it turns out that that the likelihood of taking a new job is essentially at record lows for both groups, with an especially sharp decline for the foreign-born recently. 5/8
June 4, 2025 at 2:18 PM
Of course, the number of the foreign-born in the U.S. has also increased, so if we look at *hiring rates* (hires per capita), it turns out that that the likelihood of taking a new job is essentially at record lows for both groups, with an especially sharp decline for the foreign-born recently. 5/8
Hiring *volume* is another story: after jumping in 2024, hiring of foreign-born workers has dropped precipitously in the year to date, although hiring of native-born workers has also fallen, continuing a a nearly three-year trend. 4/8
June 4, 2025 at 2:18 PM
Hiring *volume* is another story: after jumping in 2024, hiring of foreign-born workers has dropped precipitously in the year to date, although hiring of native-born workers has also fallen, continuing a a nearly three-year trend. 4/8
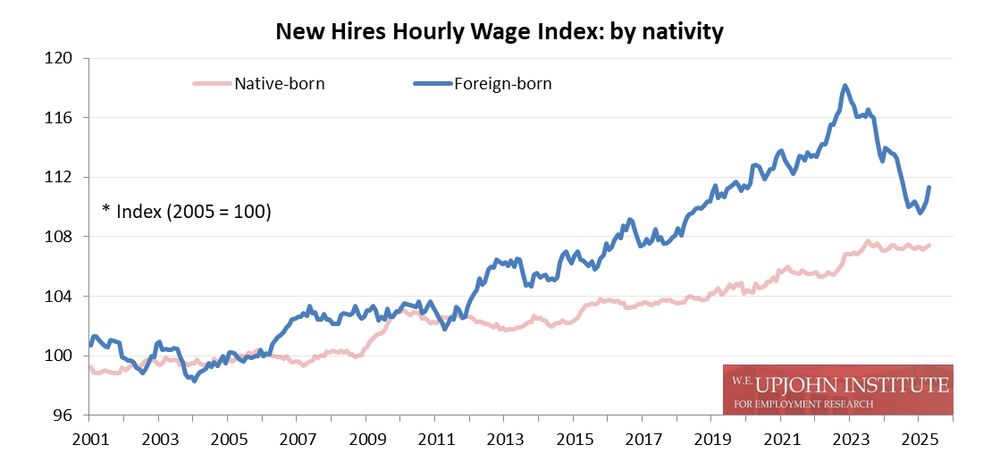
If anything, there has been a slight uptick over the past few months, even as earnings power for newly-hired native-born workers has stayed flat. 3/8
June 4, 2025 at 2:18 PM
If anything, there has been a slight uptick over the past few months, even as earnings power for newly-hired native-born workers has stayed flat. 3/8
But with multiple administration policies making the work climate harder for immigrants, how has hiring changed for foreign-born workers? Their earnings power has fallen sharply, but this has been going on for two years... 2/8
June 4, 2025 at 2:18 PM
But with multiple administration policies making the work climate harder for immigrants, how has hiring changed for foreign-born workers? Their earnings power has fallen sharply, but this has been going on for two years... 2/8
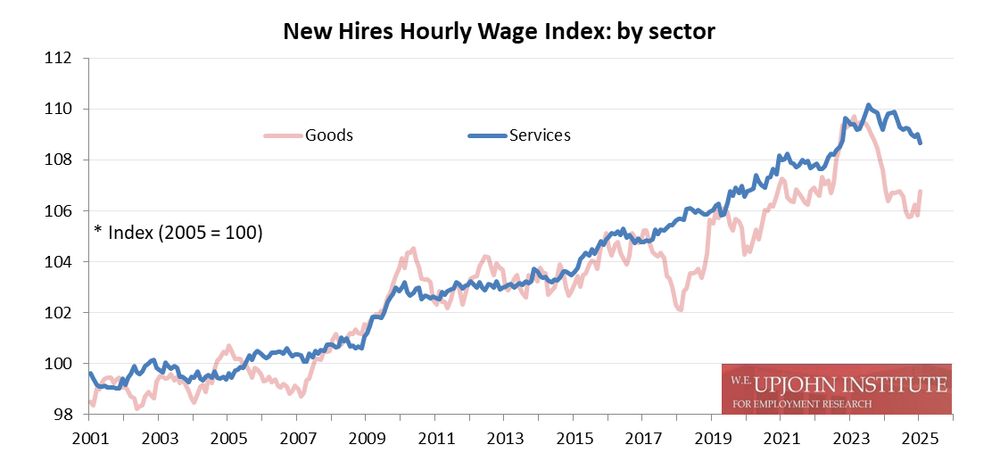
But the earnings power of those jobs in the goods sector has been dropping sharply, much faster than in the services sector:
March 5, 2025 at 2:49 PM
But the earnings power of those jobs in the goods sector has been dropping sharply, much faster than in the services sector:
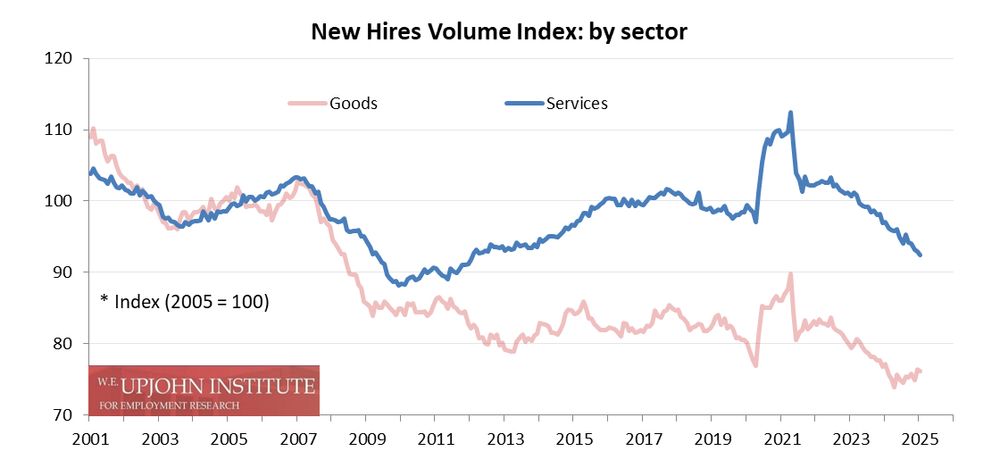
The hiring slowdown has been occurring most sharply in the service sector, down 2.7 percent just in the past seven months, even as hiring in the goods sector has ticked up slightly:
March 5, 2025 at 2:49 PM
The hiring slowdown has been occurring most sharply in the service sector, down 2.7 percent just in the past seven months, even as hiring in the goods sector has ticked up slightly:
In January 2025 (www.upjohn.org/sites/defaul...), the earnings index slipped 0.1 percent over the month, continuing a slide begun in late 2023. It is down 0.6 percent over the year, but is still well above its prepandemic level.
March 5, 2025 at 2:49 PM
In January 2025 (www.upjohn.org/sites/defaul...), the earnings index slipped 0.1 percent over the month, continuing a slide begun in late 2023. It is down 0.6 percent over the year, but is still well above its prepandemic level.