


Peder R. Braadland
@braadland.bsky.social
https://peder.quarto.pub/blog
Father x3. Rstats & data visualisation
Currently studying gut bacterial metabolism in primary sclerosing cholangitis
Norwegian green party 🌱
🇳🇴 🇩🇪 🏴
Father x3. Rstats & data visualisation
Currently studying gut bacterial metabolism in primary sclerosing cholangitis
Norwegian green party 🌱
🇳🇴 🇩🇪 🏴
Litt lenger vest, se under.
Har vært lite der de siste årene, men kan ikke huske at jeg så den sist jeg var der, men mulig jeg tar feil
Har vært lite der de siste årene, men kan ikke huske at jeg så den sist jeg var der, men mulig jeg tar feil

October 13, 2025 at 6:36 PM
Litt lenger vest, se under.
Har vært lite der de siste årene, men kan ikke huske at jeg så den sist jeg var der, men mulig jeg tar feil
Har vært lite der de siste årene, men kan ikke huske at jeg så den sist jeg var der, men mulig jeg tar feil


Til tross for at halvparten av Høyrevelgerne i Oslo er for eiendomsskatt, vil Høyre altså fjerne eiendomsskatten. Samtidig er det slik at de som får mest skattekutt ved kutt i eiendomsskatten typisk er Høyre-velgere på Oslo Vest (riktignok data fra Kommunevalget 2023).

September 3, 2025 at 11:56 AM
Til tross for at halvparten av Høyrevelgerne i Oslo er for eiendomsskatt, vil Høyre altså fjerne eiendomsskatten. Samtidig er det slik at de som får mest skattekutt ved kutt i eiendomsskatten typisk er Høyre-velgere på Oslo Vest (riktignok data fra Kommunevalget 2023).
Sånn ser det forresten ut hvis man zoomer litt ut. Tallene er fra pollofpolls.no forresten

September 2, 2025 at 8:19 PM
Sånn ser det forresten ut hvis man zoomer litt ut. Tallene er fra pollofpolls.no forresten
Utfra min egne kjappe analyse, står ditt punkt 1 seg også om man bruker gjennomsnitt for valgkampenes siste 14 dager ved siste tre stortingsvalg. (alt som havner under diagonalen hinter om underprestering ift meningsmålingene; "dårligere resultat enn man skulle tro")

September 2, 2025 at 8:18 PM
Utfra min egne kjappe analyse, står ditt punkt 1 seg også om man bruker gjennomsnitt for valgkampenes siste 14 dager ved siste tre stortingsvalg. (alt som havner under diagonalen hinter om underprestering ift meningsmålingene; "dårligere resultat enn man skulle tro")
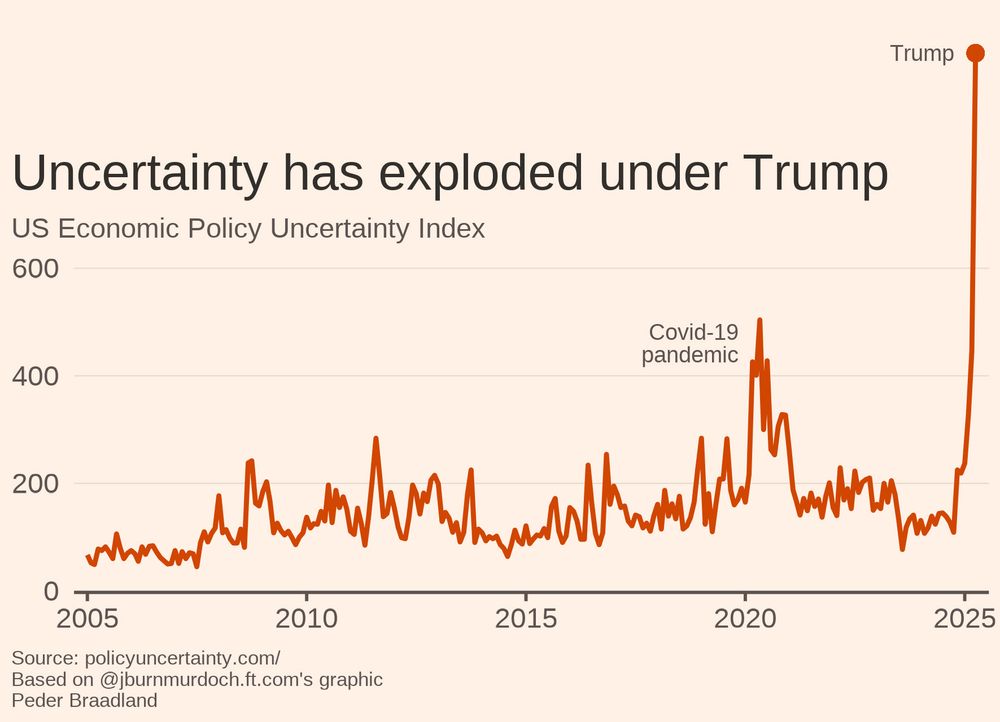
Selv om den støtt og stadig postes her, synes jeg den er så passende at jeg poster den en gang til

September 2, 2025 at 7:54 PM
Selv om den støtt og stadig postes her, synes jeg den er så passende at jeg poster den en gang til
Fra NRKs forside

September 1, 2025 at 7:41 AM
Fra NRKs forside
Går jo i riktig retning dette, så her er det bare å holde dampen oppe 🟩

August 22, 2025 at 8:26 PM
Går jo i riktig retning dette, så her er det bare å holde dampen oppe 🟩
(PS: Det er samvariasjon også om man ser på bydelene med gjennomsnittlig betalt eiendomsskatt under 1000/år)

May 22, 2025 at 3:48 PM
(PS: Det er samvariasjon også om man ser på bydelene med gjennomsnittlig betalt eiendomsskatt under 1000/år)
Vet ikke hvem som trenger dette, men her er altså en sammenlikning av uvektede snitt av meningsmålingsdata fra @pollofpolls.no for de siste to ukene før de tre siste Stortingsvalgene, og faktiske valgresultater. Overraskende god "kalibrering" her? #ggplot2 #rstats
peder.quarto.pub/blog/posts/a...
peder.quarto.pub/blog/posts/a...

May 13, 2025 at 9:32 AM
Vet ikke hvem som trenger dette, men her er altså en sammenlikning av uvektede snitt av meningsmålingsdata fra @pollofpolls.no for de siste to ukene før de tre siste Stortingsvalgene, og faktiske valgresultater. Overraskende god "kalibrering" her? #ggplot2 #rstats
peder.quarto.pub/blog/posts/a...
peder.quarto.pub/blog/posts/a...
Not sure if youre looking for how to make them but @mjskay.com's ggdist::stat_interval does the job
mjskay.r-universe.dev/articles/ggd...
mjskay.r-universe.dev/articles/ggd...

April 30, 2025 at 5:56 PM
Not sure if youre looking for how to make them but @mjskay.com's ggdist::stat_interval does the job
mjskay.r-universe.dev/articles/ggd...
mjskay.r-universe.dev/articles/ggd...
A non-conventionally plotted Kaplan-Meier plot using data from a 1994 PBC trial of UDCA vs placebo. Previous post wrongly said endpoints were only transplant or death (made outcomes seem overly dim) - in reality, endpoint also included treatment failure 📊
#30daychartchallenge #rstats #ggplot2
#30daychartchallenge #rstats #ggplot2

April 25, 2025 at 1:50 PM
A non-conventionally plotted Kaplan-Meier plot using data from a 1994 PBC trial of UDCA vs placebo. Previous post wrongly said endpoints were only transplant or death (made outcomes seem overly dim) - in reality, endpoint also included treatment failure 📊
#30daychartchallenge #rstats #ggplot2
#30daychartchallenge #rstats #ggplot2
Agree it's busy with all the parties! I originally made this plot as a way to compare how we perceive scattered points vs confidence intervals (plot below). I think the scattered points communicate a more nuanced story. So many ways to smooth which has a big impact on how people interpret the plot!

April 21, 2025 at 5:59 AM
Agree it's busy with all the parties! I originally made this plot as a way to compare how we perceive scattered points vs confidence intervals (plot below). I think the scattered points communicate a more nuanced story. So many ways to smooth which has a big impact on how people interpret the plot!
For day 19 (smooth) of the #30daychartchallenge I show some long-term political party polling data (pollofpolls.no) from Norway (Stortingsvalg). Made with #rstats #ggplot2. The viz is probably helpful to appreciate long-term trends but not so much recent developments
peder.quarto.pub/blog/posts/a...
peder.quarto.pub/blog/posts/a...

April 20, 2025 at 7:47 PM
For day 19 (smooth) of the #30daychartchallenge I show some long-term political party polling data (pollofpolls.no) from Norway (Stortingsvalg). Made with #rstats #ggplot2. The viz is probably helpful to appreciate long-term trends but not so much recent developments
peder.quarto.pub/blog/posts/a...
peder.quarto.pub/blog/posts/a...
Looking at the major threats birds face today. Remember seeing a plot dealing w/"overflow" ike this, but can't remember where. Anyways, here's day 17 of the #30daychartchallenge 99% #rstats #ggplot2 📊
Perhaps not ideal for making friends with cat people 😄
peder.quarto.pub/blog/posts/a...
Perhaps not ideal for making friends with cat people 😄
peder.quarto.pub/blog/posts/a...

April 17, 2025 at 4:49 PM
Looking at the major threats birds face today. Remember seeing a plot dealing w/"overflow" ike this, but can't remember where. Anyways, here's day 17 of the #30daychartchallenge 99% #rstats #ggplot2 📊
Perhaps not ideal for making friends with cat people 😄
peder.quarto.pub/blog/posts/a...
Perhaps not ideal for making friends with cat people 😄
peder.quarto.pub/blog/posts/a...
Actually not sure if they are called that. Thinking of it, having all countries in the same plot would lead to them all overlapping in the first period. Could facet by country which would emphasize the downward trend in all countries

April 16, 2025 at 1:38 PM
Actually not sure if they are called that. Thinking of it, having all countries in the same plot would lead to them all overlapping in the first period. Could facet by country which would emphasize the downward trend in all countries
#30daychartchallenge 📊 Day 15 Complicated. Using simulations to plot and "prove" the surprising birthday paradox in #rstats #ggplot2. Why surprising? You only need to gather *23* random people for P(two or more shared birthdays) to exceed 50%!
peder.quarto.pub/blog/posts/a...
peder.quarto.pub/blog/posts/a...

April 15, 2025 at 7:05 PM
#30daychartchallenge 📊 Day 15 Complicated. Using simulations to plot and "prove" the surprising birthday paradox in #rstats #ggplot2. Why surprising? You only need to gather *23* random people for P(two or more shared birthdays) to exceed 50%!
peder.quarto.pub/blog/posts/a...
peder.quarto.pub/blog/posts/a...
Late day 11 of #30daychartchallenge. #rstats #ggplot2 climate stripes 📊 with a twist or two. Northern Hemisphere data. Code coming to peder.quarto.pub/blog/posts/a...

April 14, 2025 at 1:07 PM
Late day 11 of #30daychartchallenge. #rstats #ggplot2 climate stripes 📊 with a twist or two. Northern Hemisphere data. Code coming to peder.quarto.pub/blog/posts/a...

#30daychartchallenge playing around with "back-to-back" histograms using #rstats ggdist::stat_histinterval() #ggplot2 #dataviz
peder.quarto.pub/blog/posts/a...
peder.quarto.pub/blog/posts/a...

April 10, 2025 at 7:41 AM
#30daychartchallenge playing around with "back-to-back" histograms using #rstats ggdist::stat_histinterval() #ggplot2 #dataviz
peder.quarto.pub/blog/posts/a...
peder.quarto.pub/blog/posts/a...
In your example you dont let z predict x, but you allow x to predict z, right?
So in my example, I'm clear of committing the crime of allowing ID to predict age and sex?
So in my example, I'm clear of committing the crime of allowing ID to predict age and sex?

April 8, 2025 at 1:17 PM
In your example you dont let z predict x, but you allow x to predict z, right?
So in my example, I'm clear of committing the crime of allowing ID to predict age and sex?
So in my example, I'm clear of committing the crime of allowing ID to predict age and sex?