


Benjamin Lesné
@benjaminlesne.bsky.social
Reposted by Benjamin Lesné
Reposted by Benjamin Lesné

types also _are_ documentation :)
December 1, 2025 at 6:10 PM
types also _are_ documentation :)
Reposted by Benjamin Lesné
Feedback I got yesterday was mostly: "I tried it but it showed a lot of findings, I looked at the first two and they were false-positives so I dismissed it"
The false-positives would go away with better config, but people need to see the benefit _immediately_
The false-positives would go away with better config, but people need to see the benefit _immediately_
October 30, 2025 at 12:11 PM
Feedback I got yesterday was mostly: "I tried it but it showed a lot of findings, I looked at the first two and they were false-positives so I dismissed it"
The false-positives would go away with better config, but people need to see the benefit _immediately_
The false-positives would go away with better config, but people need to see the benefit _immediately_
Now that the project is live, I’m looking for new opportunities!
If you're looking for a developer who can turn complex ideas into powerful tools, my DMs are open!
Reposts appreciated 🙏
#WholeLifeCarbon #EmbodiedCarbon #PolicyScience #OpenScience
If you're looking for a developer who can turn complex ideas into powerful tools, my DMs are open!
Reposts appreciated 🙏
#WholeLifeCarbon #EmbodiedCarbon #PolicyScience #OpenScience
July 10, 2025 at 10:01 AM
Now that the project is live, I’m looking for new opportunities!
If you're looking for a developer who can turn complex ideas into powerful tools, my DMs are open!
Reposts appreciated 🙏
#WholeLifeCarbon #EmbodiedCarbon #PolicyScience #OpenScience
If you're looking for a developer who can turn complex ideas into powerful tools, my DMs are open!
Reposts appreciated 🙏
#WholeLifeCarbon #EmbodiedCarbon #PolicyScience #OpenScience
Also, special thanks to the team at @kuleuvenuniversity.bsky.social and Technische Universität Graz - @martinroeck.com, Nicolas Alaux, Delphine Ramon, Alexander Passer, Karen Allacker and Ronny Moreas.
The collaboration with all of you was fantastic.
The collaboration with all of you was fantastic.
July 10, 2025 at 10:01 AM
Also, special thanks to the team at @kuleuvenuniversity.bsky.social and Technische Universität Graz - @martinroeck.com, Nicolas Alaux, Delphine Ramon, Alexander Passer, Karen Allacker and Ronny Moreas.
The collaboration with all of you was fantastic.
The collaboration with all of you was fantastic.
A huge thank you to Shadwa Eissa for the amazing data visualization and overall design! I closely collaborated with her to build the app.
July 10, 2025 at 10:01 AM
A huge thank you to Shadwa Eissa for the amazing data visualization and overall design! I closely collaborated with her to build the app.
On the tech side, I built the app entirely from scratch with:
🔹 Reactjs (@react.dev)
🔹 TanStack Router (@tanstack.com)
🔹 React Query (@tkdodo.eu)
🔹 Shadcn/ui (@shadcn.com)
🔹 Recharts
🔹 Flask
🔹 DuckDB (@duckdb.org)
🔹 Reactjs (@react.dev)
🔹 TanStack Router (@tanstack.com)
🔹 React Query (@tkdodo.eu)
🔹 Shadcn/ui (@shadcn.com)
🔹 Recharts
🔹 Flask
🔹 DuckDB (@duckdb.org)
July 10, 2025 at 10:01 AM
On the tech side, I built the app entirely from scratch with:
🔹 Reactjs (@react.dev)
🔹 TanStack Router (@tanstack.com)
🔹 React Query (@tkdodo.eu)
🔹 Shadcn/ui (@shadcn.com)
🔹 Recharts
🔹 Flask
🔹 DuckDB (@duckdb.org)
🔹 Reactjs (@react.dev)
🔹 TanStack Router (@tanstack.com)
🔹 React Query (@tkdodo.eu)
🔹 Shadcn/ui (@shadcn.com)
🔹 Recharts
🔹 Flask
🔹 DuckDB (@duckdb.org)
The data comes from building LCA and building stock modelling of KU Leuven and TU Graz developed as part of the ‘Analysis of Life-cycle Greenhouse Gas Emissions and Removals of EU Buildings and Construction’ study funded by the European Commission
See more on the About page of the Scenario Explorer
See more on the About page of the Scenario Explorer

Analysis of Life-Cycle Greenhouse Gas Emissions of EU Buildings and Construction
Learn more about the analysis of Life-Cycle Greenhouse Gas Emissions of EU Buildings and Construction
c.ramboll.com
July 10, 2025 at 10:01 AM
The data comes from building LCA and building stock modelling of KU Leuven and TU Graz developed as part of the ‘Analysis of Life-cycle Greenhouse Gas Emissions and Removals of EU Buildings and Construction’ study funded by the European Commission
See more on the About page of the Scenario Explorer
See more on the About page of the Scenario Explorer
- The material with the highest emissions?
👉 Line chart
- How emissions change over time for Residential buildings?
👉 Stacked area chart
- Compare emissions between two scenarios?
👉 Stacked bar chart
👉 Line chart
- How emissions change over time for Residential buildings?
👉 Stacked area chart
- Compare emissions between two scenarios?
👉 Stacked bar chart
July 10, 2025 at 10:01 AM
- The material with the highest emissions?
👉 Line chart
- How emissions change over time for Residential buildings?
👉 Stacked area chart
- Compare emissions between two scenarios?
👉 Stacked bar chart
👉 Line chart
- How emissions change over time for Residential buildings?
👉 Stacked area chart
- Compare emissions between two scenarios?
👉 Stacked bar chart
Users can view emissions for each building type, country, material, and more!
You can download the displayed data as an image or as a spreadsheet and visualize it with three type of graphs in the app.
If you want to know...
You can download the displayed data as an image or as a spreadsheet and visualize it with three type of graphs in the app.
If you want to know...
July 10, 2025 at 10:01 AM
Users can view emissions for each building type, country, material, and more!
You can download the displayed data as an image or as a spreadsheet and visualize it with three type of graphs in the app.
If you want to know...
You can download the displayed data as an image or as a spreadsheet and visualize it with three type of graphs in the app.
If you want to know...
👉 Explore the web app at ae-scenario-explorer.cloud.set.kuleuven.be
👉 The code and related papers via linktr.ee/wlcscenarioe...
👉 The code and related papers via linktr.ee/wlcscenarioe...
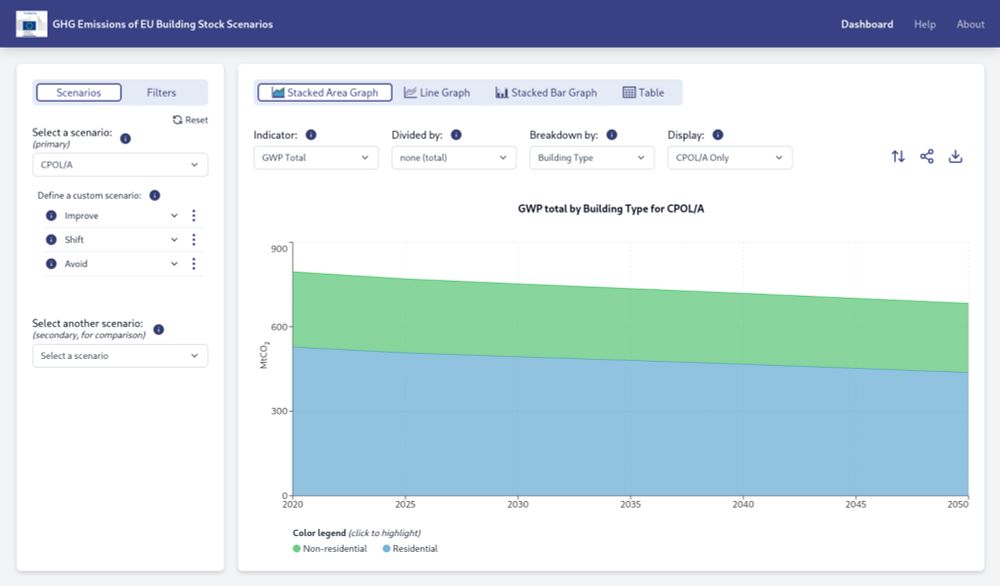
WLC Scenario Explorer
Interactive tool that visualizes carbon reduction strategies across Europe's entire building stock. Analyze emissions by building life cycle stages, building types, and more.
ae-scenario-explorer.cloud.set.kuleuven.be
July 10, 2025 at 10:01 AM
👉 Explore the web app at ae-scenario-explorer.cloud.set.kuleuven.be
👉 The code and related papers via linktr.ee/wlcscenarioe...
👉 The code and related papers via linktr.ee/wlcscenarioe...