


Great to revisit this photo! Many people I now know in the field whom I don't recall meeting at this, one of my first real science meetings.
July 30, 2025 at 1:04 PM
Great to revisit this photo! Many people I now know in the field whom I don't recall meeting at this, one of my first real science meetings.
A minor update to Pyriod is now available (v0.3.3), addressing some pesky depreciation warnings that would crop up. pypi.org/project/Pyri...
July 9, 2025 at 12:51 PM
A minor update to Pyriod is now available (v0.3.3), addressing some pesky depreciation warnings that would crop up. pypi.org/project/Pyri...
Also another notebook showing how to automate prewhitening analysis (I will try to build more convenience functions into Pyriod for this soon). github.com/keatonb/Pyri...
July 9, 2025 at 12:51 PM
Also another notebook showing how to automate prewhitening analysis (I will try to build more convenience functions into Pyriod for this soon). github.com/keatonb/Pyri...
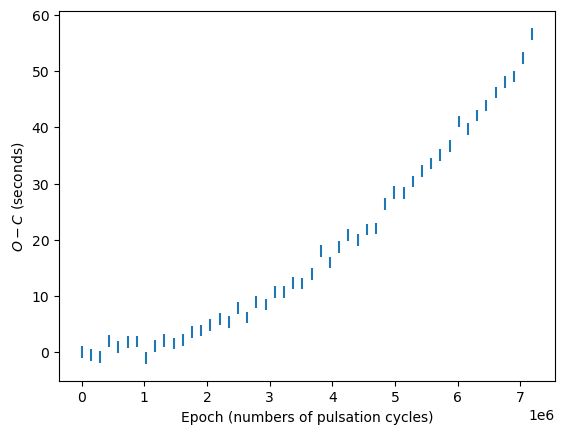
For this presentation, I have also uploaded a demonstration of how to use Pyriod to measure O-C diagrams to track timing variations of a signal. github.com/keatonb/Pyri...
July 9, 2025 at 12:51 PM
For this presentation, I have also uploaded a demonstration of how to use Pyriod to measure O-C diagrams to track timing variations of a signal. github.com/keatonb/Pyri...
The development of Pyriod is supported by the National Science Foundation under Grant No. AST-2406917.
June 9, 2025 at 7:52 PM
The development of Pyriod is supported by the National Science Foundation under Grant No. AST-2406917.
Learn more at github.com/keatonb/Pyriod, install for yourself with "pip install Pyriod", or try it first in your browser with Binder mybinder.org/v2/gh/keaton... (no download, but a bit slow).
GitHub - keatonb/Pyriod: Python implementation of basic period detection and fitting routines for astronomical time series.
Python implementation of basic period detection and fitting routines for astronomical time series. - keatonb/Pyriod
github.com
June 9, 2025 at 7:52 PM
Learn more at github.com/keatonb/Pyriod, install for yourself with "pip install Pyriod", or try it first in your browser with Binder mybinder.org/v2/gh/keaton... (no download, but a bit slow).
The interface works in Jupyter, and it can also be scripted for automated analysis. We are grateful to lightkurve, astropy, lmfit, qgrid, and qgridnext, which make Pyriod work. I am working to improve tutorials and documentation. Submit issues/feature requests at github.com/keatonb/Pyriod
GitHub - keatonb/Pyriod: Python implementation of basic period detection and fitting routines for astronomical time series.
Python implementation of basic period detection and fitting routines for astronomical time series. - keatonb/Pyriod
github.com
June 9, 2025 at 7:52 PM
The interface works in Jupyter, and it can also be scripted for automated analysis. We are grateful to lightkurve, astropy, lmfit, qgrid, and qgridnext, which make Pyriod work. I am working to improve tutorials and documentation. Submit issues/feature requests at github.com/keatonb/Pyriod
Pyriod is inspired by Period04 (www.period04.net), aiming to provide a similar interactive data analysis experience for the modern Python workflow, with open-source code, and with a faster periodogram better-suited for the big data era.
Period04 - Homepage
www.period04.net
June 9, 2025 at 7:52 PM
Pyriod is inspired by Period04 (www.period04.net), aiming to provide a similar interactive data analysis experience for the modern Python workflow, with open-source code, and with a faster periodogram better-suited for the big data era.
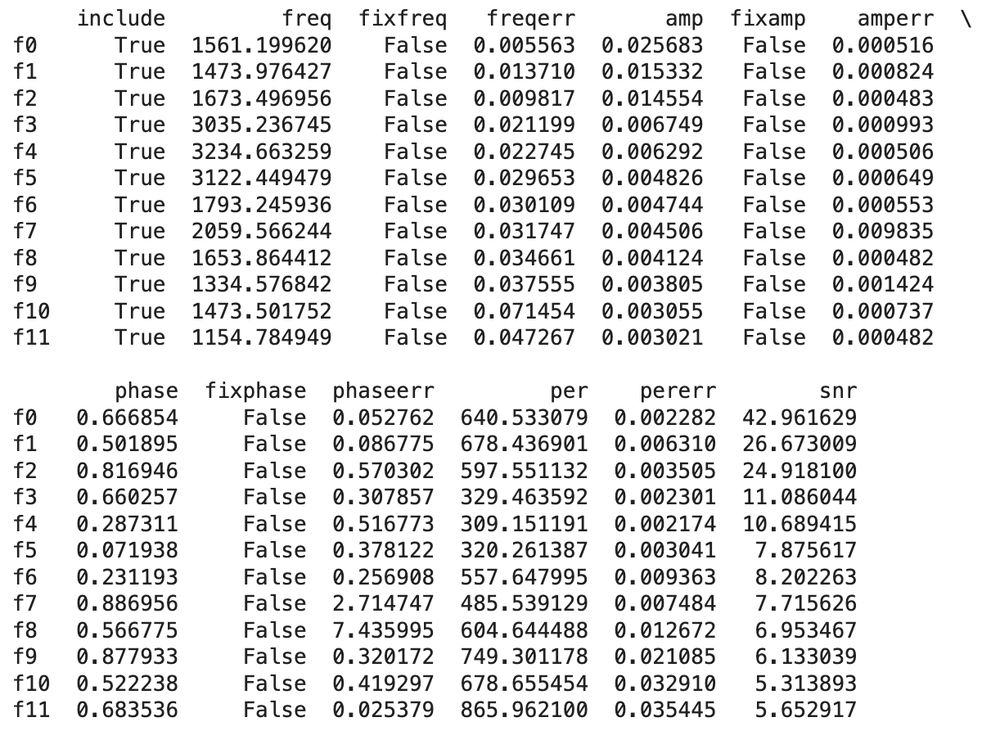
Our reward for completing this process is a table of signal frequencies, amplitudes, and phases, with estimated uncertainties. These measurements of resonant frequencies of a white dwarf star are published and interpreted in Bell et al. (2019, ui.adsabs.harvard.edu/abs/2019A%26A...632A..42B).
June 9, 2025 at 7:52 PM
Our reward for completing this process is a table of signal frequencies, amplitudes, and phases, with estimated uncertainties. These measurements of resonant frequencies of a white dwarf star are published and interpreted in Bell et al. (2019, ui.adsabs.harvard.edu/abs/2019A%26A...632A..42B).
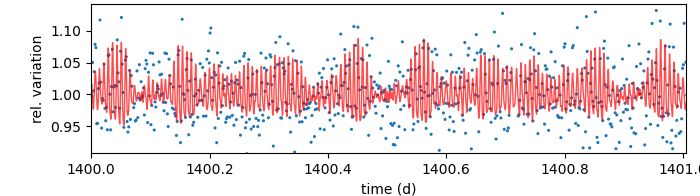
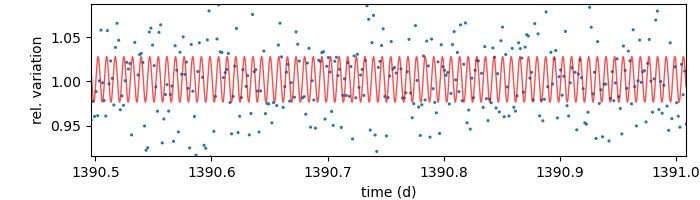
The fit to the light curve reveals the complex variability that we otherwise couldn't visibly see for all the measurement noise, shown here for one day of the TESS light curve.
June 9, 2025 at 7:52 PM
The fit to the light curve reveals the complex variability that we otherwise couldn't visibly see for all the measurement noise, shown here for one day of the TESS light curve.
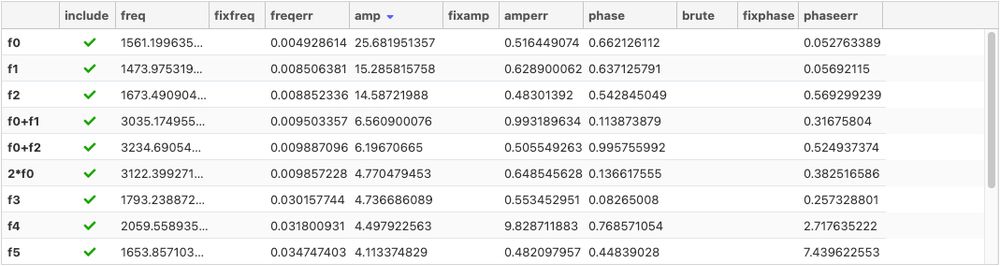
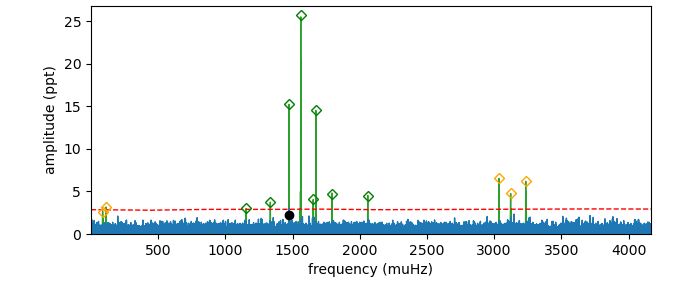
Pyriod can enforce strict relationships between combination frequencies and independent frequencies when they are identified by their arithmetic relations. We proceed to pre-whiten all significant signals, with combinations marked with gold diamonds.
June 9, 2025 at 7:52 PM
Pyriod can enforce strict relationships between combination frequencies and independent frequencies when they are identified by their arithmetic relations. We proceed to pre-whiten all significant signals, with combinations marked with gold diamonds.
Three signals down, but the next three are "combination frequencies" that appear at precise sums, multiples, and differences of frequencies. If the first three signals are f0, f1, and f2, this next cluster of peaks are f0+f1, 2*f0, and f0+f2.
June 9, 2025 at 7:52 PM
Three signals down, but the next three are "combination frequencies" that appear at precise sums, multiples, and differences of frequencies. If the first three signals are f0, f1, and f2, this next cluster of peaks are f0+f1, 2*f0, and f0+f2.
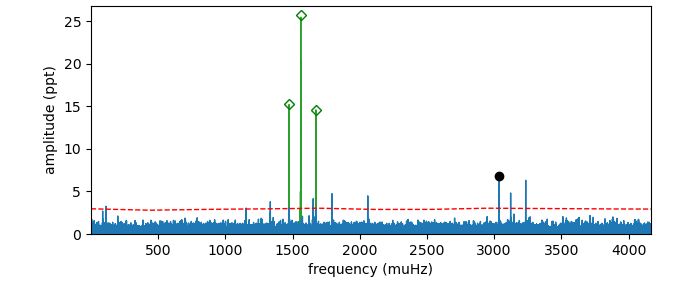
We then identify additional signals from the periodogram of fit residuals (the "pre-whitened" data). Pyriod displays the periodogram of the residuals in blue (highest peak marked). The model is displayed in green. In practice, we move significant peaks from blue to green.
June 9, 2025 at 7:52 PM
We then identify additional signals from the periodogram of fit residuals (the "pre-whitened" data). Pyriod displays the periodogram of the residuals in blue (highest peak marked). The model is displayed in green. In practice, we move significant peaks from blue to green.
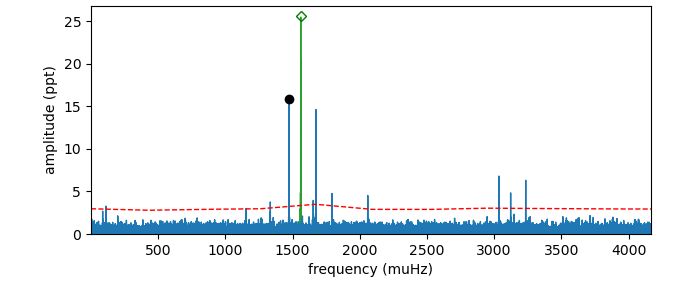
We "pre-whiten" signals by fitting and subtracting sinusoids from the light curve. We currently fit the frequency, amplitude, and phase of one sinusoidal signal. The data may be noisy, but TESS collected enough that we detect this signal to high significance.
June 9, 2025 at 7:52 PM
We "pre-whiten" signals by fitting and subtracting sinusoids from the light curve. We currently fit the frequency, amplitude, and phase of one sinusoidal signal. The data may be noisy, but TESS collected enough that we detect this signal to high significance.
The periodogram displays the frequency content of the light curve, and we identify significant signals as having amplitudes well above the noise floor. The red curve gives an approximate significance threshold, and Pyriod marks the highest peak for inclusion in the model. Let's add it.
June 9, 2025 at 7:52 PM
The periodogram displays the frequency content of the light curve, and we identify significant signals as having amplitudes well above the noise floor. The red curve gives an approximate significance threshold, and Pyriod marks the highest peak for inclusion in the model. Let's add it.
The pre-whitening algorithm is a method for measuring sinusoidal signals in time series data. It is best suited for signals that are coherent for the duration of the observations. We start with the periodogram of the TESS Sector 3 light curve of the pulsating white dwarf WD 0158-160.

June 9, 2025 at 7:52 PM
The pre-whitening algorithm is a method for measuring sinusoidal signals in time series data. It is best suited for signals that are coherent for the duration of the observations. We start with the periodogram of the TESS Sector 3 light curve of the pulsating white dwarf WD 0158-160.