


archie.md
@archie.sarrewood.com
SQL, data viz, duckdb, markdown
building @evidence.dev
archie.evidence.app
building @evidence.dev
archie.evidence.app
@duckdb-gsheets.com now supports ducklake!
July 17, 2025 at 2:03 PM
@duckdb-gsheets.com now supports ducklake!
what a beautiful day to be sat inside debugging github actions

March 21, 2025 at 6:56 PM
what a beautiful day to be sat inside debugging github actions
I have a video doorbell with both a chime and wireless hookup. it was very difficult to install
you’ll be needing a dc transformer
and to be prepared to read lots of simple diagrams like this
you’ll be needing a dc transformer
and to be prepared to read lots of simple diagrams like this

March 6, 2025 at 3:41 AM
I have a video doorbell with both a chime and wireless hookup. it was very difficult to install
you’ll be needing a dc transformer
and to be prepared to read lots of simple diagrams like this
you’ll be needing a dc transformer
and to be prepared to read lots of simple diagrams like this
@a13x.bsky.social ripping some cool forecasting workflows with @duckdb-gsheets.com
February 27, 2025 at 5:01 PM
@a13x.bsky.social ripping some cool forecasting workflows with @duckdb-gsheets.com
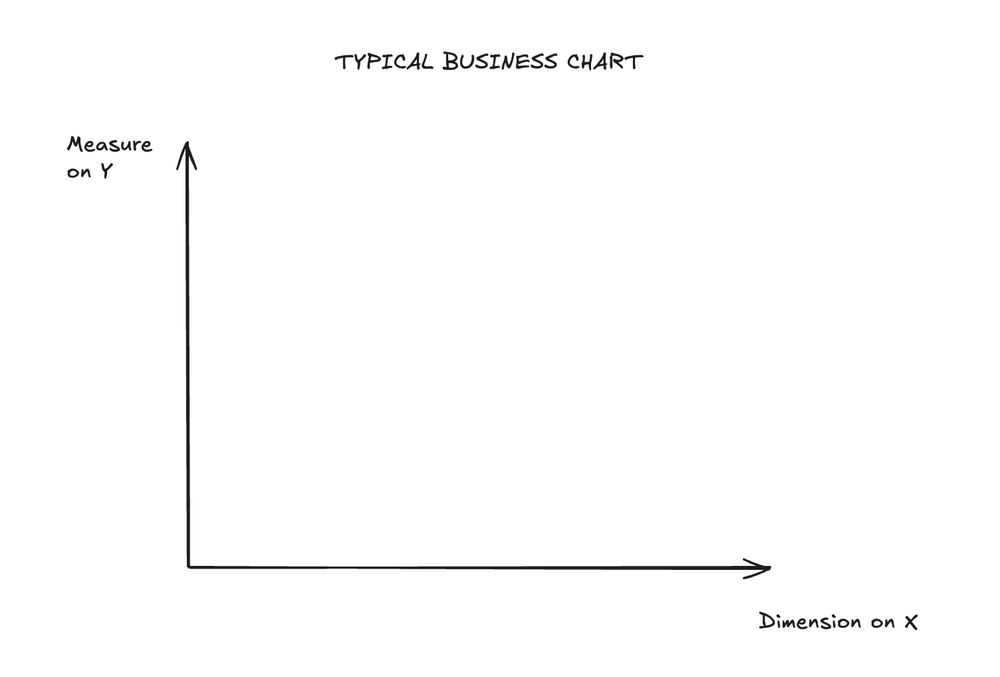
all BI charts end up looking the same, but why?
it's because we're normally doing the same thing - discrete dimension on X axis, continuous measure on Y
evidence.dev/blog/discret...
it's because we're normally doing the same thing - discrete dimension on X axis, continuous measure on Y
evidence.dev/blog/discret...
February 12, 2025 at 9:46 PM
all BI charts end up looking the same, but why?
it's because we're normally doing the same thing - discrete dimension on X axis, continuous measure on Y
evidence.dev/blog/discret...
it's because we're normally doing the same thing - discrete dimension on X axis, continuous measure on Y
evidence.dev/blog/discret...
working on improving the login experience for @duckdb-gsheets.com
no more pasting tokens into the terminal
no more pasting tokens into the terminal
February 7, 2025 at 6:11 PM
working on improving the login experience for @duckdb-gsheets.com
no more pasting tokens into the terminal
no more pasting tokens into the terminal
run query-> get chart, using @duckdb-gsheets.com
February 6, 2025 at 7:54 PM
run query-> get chart, using @duckdb-gsheets.com
some musings on continuous vs discrete data
- basically all dimensions are discrete, except time
- basically all measures are continuous, except counts
- basically all dimensions are discrete, except time
- basically all measures are continuous, except counts


February 6, 2025 at 6:14 PM
some musings on continuous vs discrete data
- basically all dimensions are discrete, except time
- basically all measures are continuous, except counts
- basically all dimensions are discrete, except time
- basically all measures are continuous, except counts
@duckdb-gsheets.com v0.0.5 is now live!
big news with this version is now you can force duckdb to read EVERYTHING as a string with the all_varchar flag
we also welcomed a new contributor to the project in this release - props to Michael Harris for all the new features!
big news with this version is now you can force duckdb to read EVERYTHING as a string with the all_varchar flag
we also welcomed a new contributor to the project in this release - props to Michael Harris for all the new features!
February 4, 2025 at 7:08 PM
@duckdb-gsheets.com v0.0.5 is now live!
big news with this version is now you can force duckdb to read EVERYTHING as a string with the all_varchar flag
we also welcomed a new contributor to the project in this release - props to Michael Harris for all the new features!
big news with this version is now you can force duckdb to read EVERYTHING as a string with the all_varchar flag
we also welcomed a new contributor to the project in this release - props to Michael Harris for all the new features!
@duckdb-gsheets.com is starting to get a lot of downloads
credit for chart @dtenwolde.bsky.social
duckdb-ce-analysis.evidence.app
credit for chart @dtenwolde.bsky.social
duckdb-ce-analysis.evidence.app

January 30, 2025 at 10:48 PM
@duckdb-gsheets.com is starting to get a lot of downloads
credit for chart @dtenwolde.bsky.social
duckdb-ce-analysis.evidence.app
credit for chart @dtenwolde.bsky.social
duckdb-ce-analysis.evidence.app
the caveat here is hilarious…
so what is the intended purpose here?
so what is the intended purpose here?

January 23, 2025 at 4:53 AM
the caveat here is hilarious…
so what is the intended purpose here?
so what is the intended purpose here?
in this case, i’m using it to distinguish orientation of the bars

January 21, 2025 at 7:51 AM
in this case, i’m using it to distinguish orientation of the bars
prior art
this is quite good but i feel like:
1. the first question is too subjective
2. there are charts here that no business should use (radar, pie, surface plot)
this is quite good but i feel like:
1. the first question is too subjective
2. there are charts here that no business should use (radar, pie, surface plot)

January 21, 2025 at 4:59 AM
prior art
this is quite good but i feel like:
1. the first question is too subjective
2. there are charts here that no business should use (radar, pie, surface plot)
this is quite good but i feel like:
1. the first question is too subjective
2. there are charts here that no business should use (radar, pie, surface plot)
was interested to see if I could extend this to create a deterministic way to choose a chart based on your data:
- how many dimensions?
- discrete or continuous?
- how many values?
etc
this is my first attempt - what did i get wrong here?
- how many dimensions?
- discrete or continuous?
- how many values?
etc
this is my first attempt - what did i get wrong here?

January 21, 2025 at 4:51 AM
was interested to see if I could extend this to create a deterministic way to choose a chart based on your data:
- how many dimensions?
- discrete or continuous?
- how many values?
etc
this is my first attempt - what did i get wrong here?
- how many dimensions?
- discrete or continuous?
- how many values?
etc
this is my first attempt - what did i get wrong here?
just shipped - you can now query APIs from @evidence.dev sources
I used this to make this cool app using US housing index data from fhfa.gov in 80 mins and <100 lines of markdown
I used this to make this cool app using US housing index data from fhfa.gov in 80 mins and <100 lines of markdown
January 17, 2025 at 10:28 PM
just shipped - you can now query APIs from @evidence.dev sources
I used this to make this cool app using US housing index data from fhfa.gov in 80 mins and <100 lines of markdown
I used this to make this cool app using US housing index data from fhfa.gov in 80 mins and <100 lines of markdown
proud of myself for tracking down a gnarly bug by learning
`git log --online --graph`
it's not often that the github UI fails me, but if you are looking for a bug in a large feature branch, then its chronological commit view can't help you (and wont show >250 commits in a PR)
`git log --online --graph`
it's not often that the github UI fails me, but if you are looking for a bug in a large feature branch, then its chronological commit view can't help you (and wont show >250 commits in a PR)

January 17, 2025 at 7:52 PM
proud of myself for tracking down a gnarly bug by learning
`git log --online --graph`
it's not often that the github UI fails me, but if you are looking for a bug in a large feature branch, then its chronological commit view can't help you (and wont show >250 commits in a PR)
`git log --online --graph`
it's not often that the github UI fails me, but if you are looking for a bug in a large feature branch, then its chronological commit view can't help you (and wont show >250 commits in a PR)
linkedin seriously feels like it’s serving me someone else’s feed
10 notifications in a row about comments by a single connection on posts by people i’ve never met
in under an hour
10 notifications in a row about comments by a single connection on posts by people i’ve never met
in under an hour

January 17, 2025 at 3:36 AM
linkedin seriously feels like it’s serving me someone else’s feed
10 notifications in a row about comments by a single connection on posts by people i’ve never met
in under an hour
10 notifications in a row about comments by a single connection on posts by people i’ve never met
in under an hour

playing around with an AgGrid component for @evidence.dev
January 13, 2025 at 8:34 PM
playing around with an AgGrid component for @evidence.dev

December 19, 2024 at 6:29 PM
are you a chatGPT poweruser?
do you know the keyboard shortcuts?
cmd + / to see them
do you know the keyboard shortcuts?
cmd + / to see them
December 19, 2024 at 4:54 PM
are you a chatGPT poweruser?
do you know the keyboard shortcuts?
cmd + / to see them
do you know the keyboard shortcuts?
cmd + / to see them
it’s less than a 2C error in reasonable rages for outdoor temperature

December 19, 2024 at 5:03 AM
it’s less than a 2C error in reasonable rages for outdoor temperature
i raise you toronto
it’s sunny, but dropping to 3F
it’s sunny, but dropping to 3F

December 18, 2024 at 3:42 AM
i raise you toronto
it’s sunny, but dropping to 3F
it’s sunny, but dropping to 3F
to unsubscribe from microsoft marketing emails you need to…
*checks notes*
…request another email
*checks notes*
…request another email

December 18, 2024 at 3:13 AM
to unsubscribe from microsoft marketing emails you need to…
*checks notes*
…request another email
*checks notes*
…request another email