


Andrew Price
@andrewbprice.bsky.social
Geospatial Intelligence & analytics professional | International Security & Defence | Retired basketball nerd
🇳🇿 🗺️ 🛰️ 🏀 📊 👨💻 🌏 🥝
🇳🇿 🗺️ 🛰️ 🏀 📊 👨💻 🌏 🥝
Summer has arrived in Auckland today. View from Stanley Bay, across the Waitemata Harbour towards the CBD.
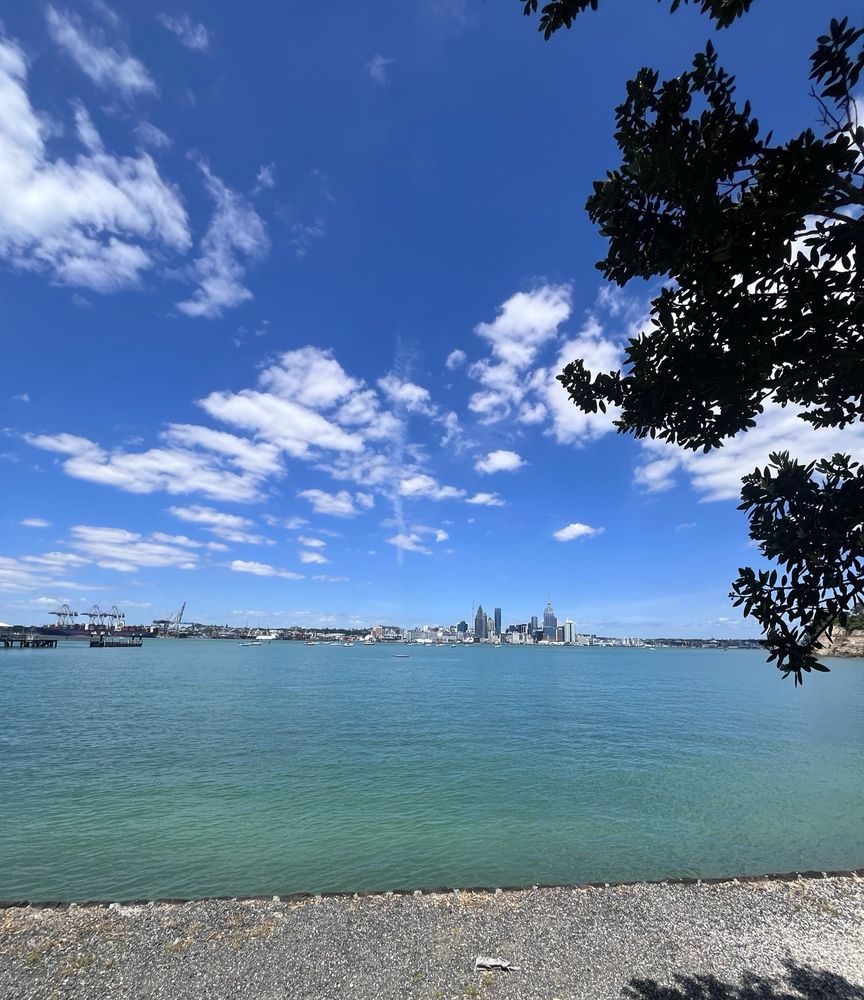
November 19, 2024 at 1:57 AM
Summer has arrived in Auckland today. View from Stanley Bay, across the Waitemata Harbour towards the CBD.
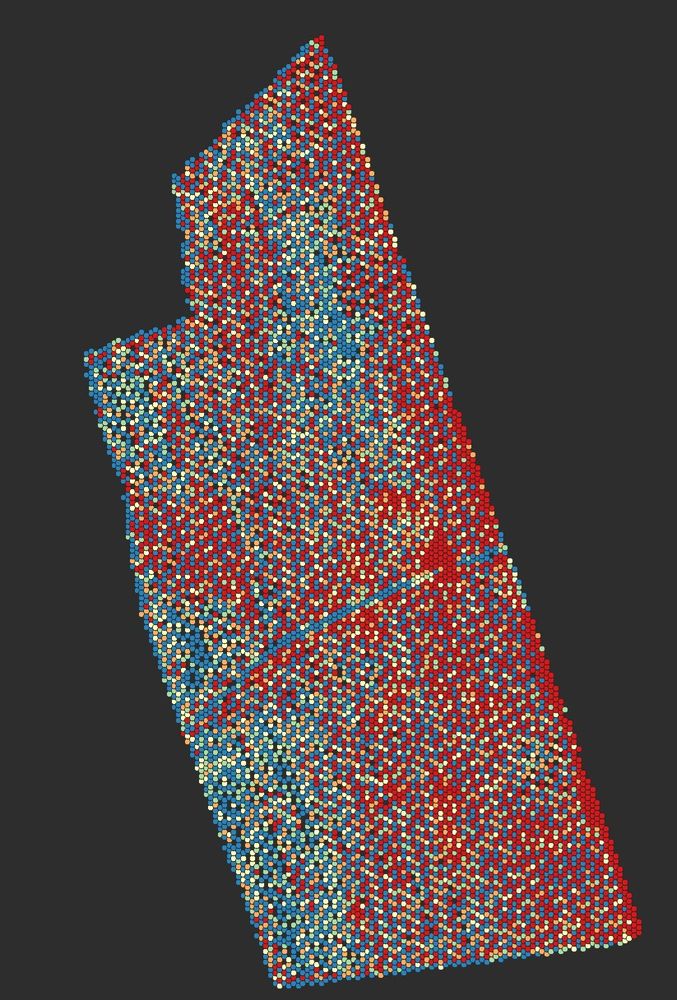
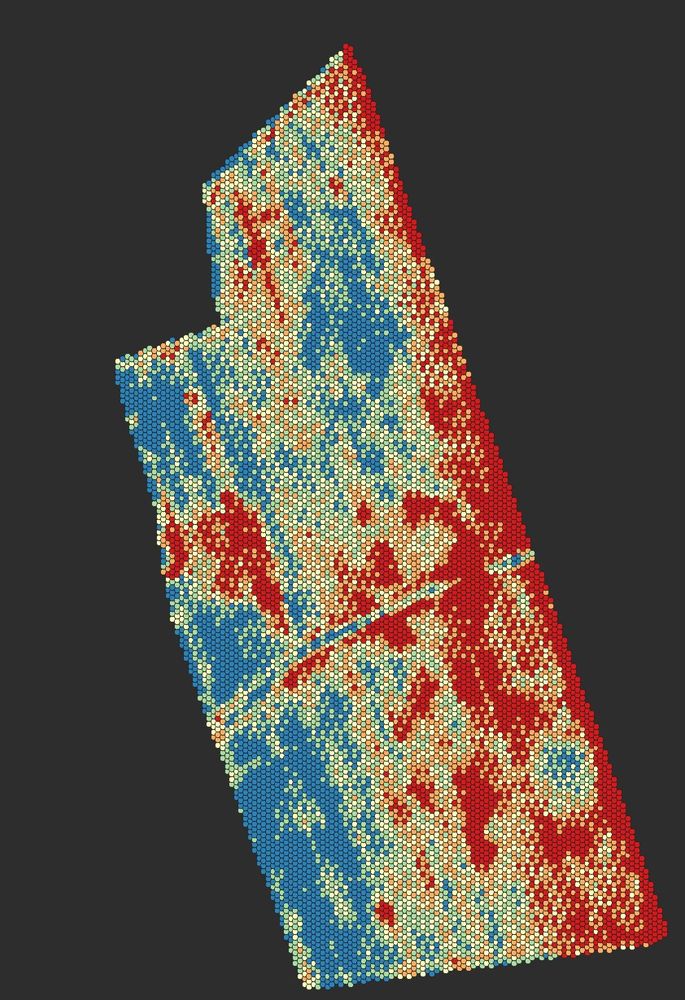
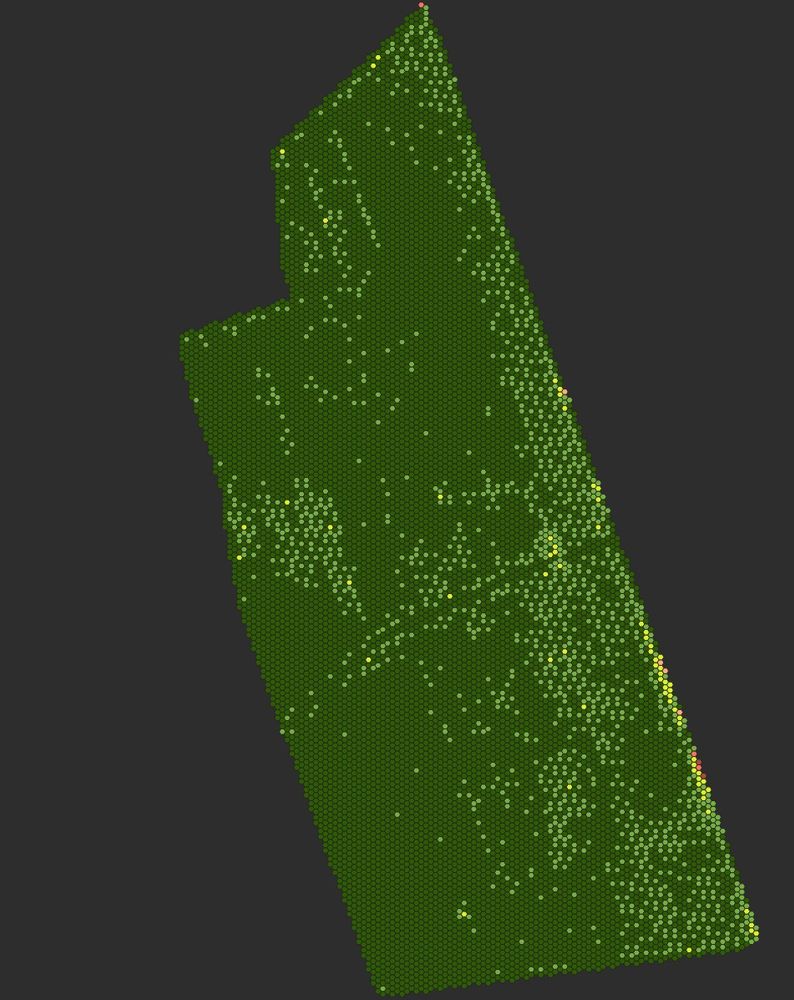
Having fun w/ ChatGPT's data processing:
- 1 shows pts, containing an NDVI value at given (evenly distributed) locations.
- 2 shows the value after being averaged with its nearest 6 points.
The smoothed layer made sense of the underlying data & instantly highlighted trends - in less than a minute
- 1 shows pts, containing an NDVI value at given (evenly distributed) locations.
- 2 shows the value after being averaged with its nearest 6 points.
The smoothed layer made sense of the underlying data & instantly highlighted trends - in less than a minute
November 15, 2024 at 12:50 AM
Having fun w/ ChatGPT's data processing:
- 1 shows pts, containing an NDVI value at given (evenly distributed) locations.
- 2 shows the value after being averaged with its nearest 6 points.
The smoothed layer made sense of the underlying data & instantly highlighted trends - in less than a minute
- 1 shows pts, containing an NDVI value at given (evenly distributed) locations.
- 2 shows the value after being averaged with its nearest 6 points.
The smoothed layer made sense of the underlying data & instantly highlighted trends - in less than a minute
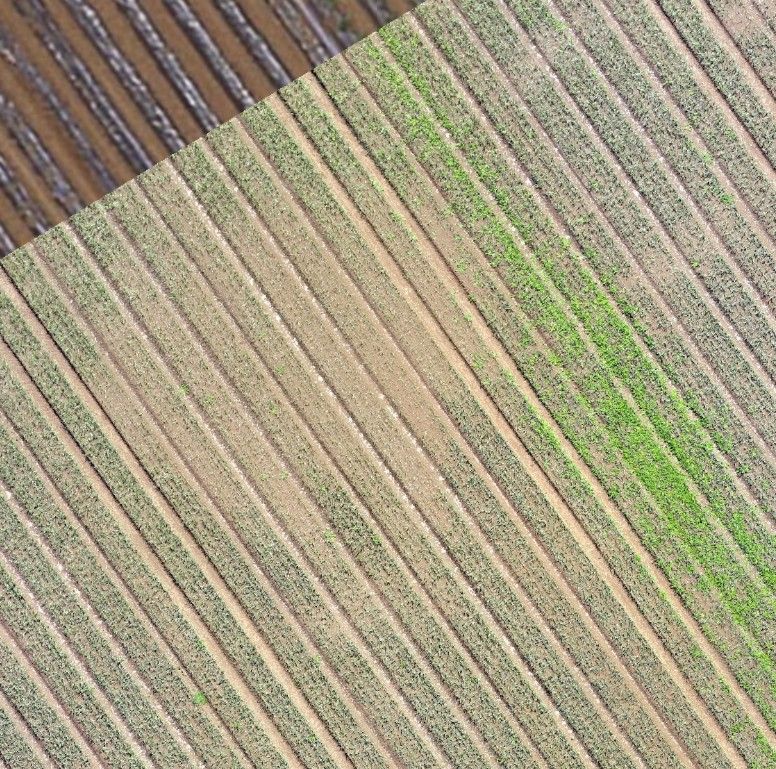
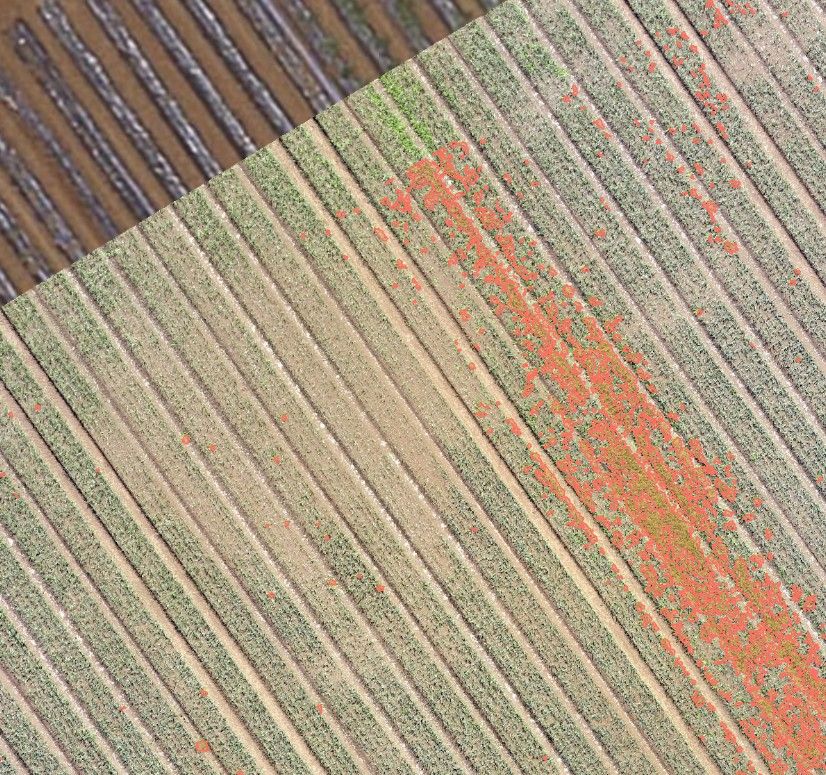
Another exciting success we've had over the past month has been identifying both weeds and gaps in planting patterns:
📸 1 : Raw RGB drone imagery
📸 2 : Weed classification
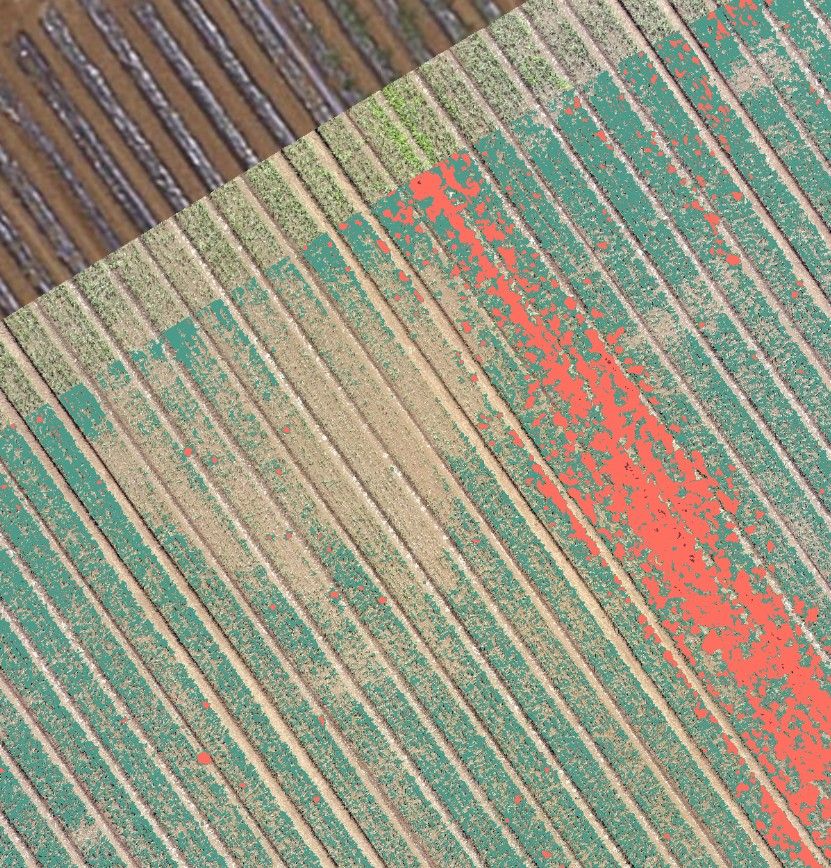
📸 3 : Comparing plant (onion) classification to weed classification
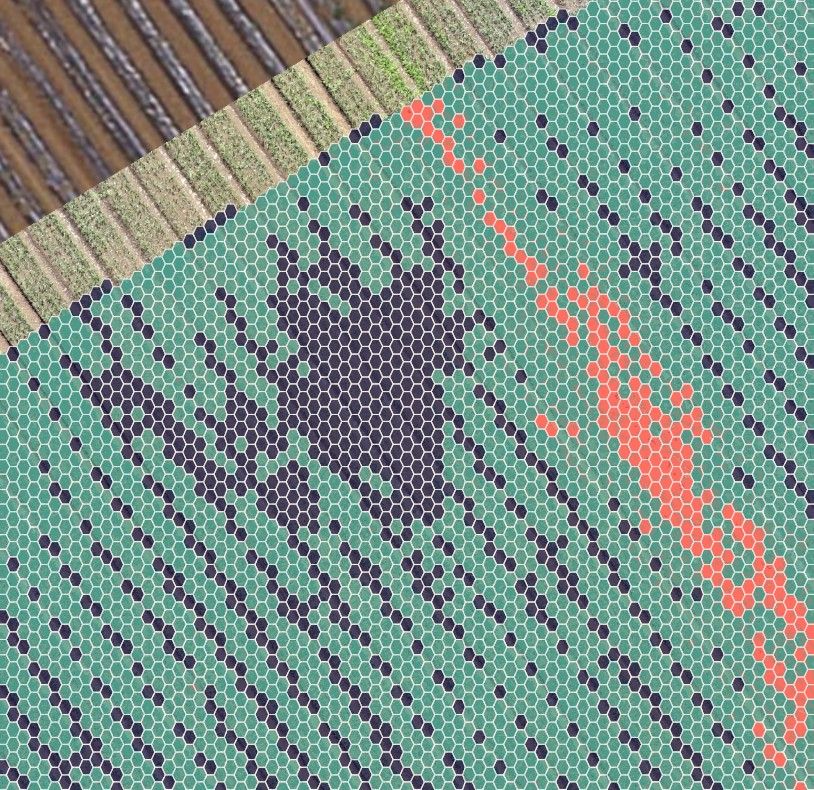
📸 4 : Binned gap (dark blue) and weed (pink) analysis
📸 1 : Raw RGB drone imagery
📸 2 : Weed classification
📸 3 : Comparing plant (onion) classification to weed classification
📸 4 : Binned gap (dark blue) and weed (pink) analysis
November 14, 2024 at 12:10 AM
Another exciting success we've had over the past month has been identifying both weeds and gaps in planting patterns:
📸 1 : Raw RGB drone imagery
📸 2 : Weed classification
📸 3 : Comparing plant (onion) classification to weed classification
📸 4 : Binned gap (dark blue) and weed (pink) analysis
📸 1 : Raw RGB drone imagery
📸 2 : Weed classification
📸 3 : Comparing plant (onion) classification to weed classification
📸 4 : Binned gap (dark blue) and weed (pink) analysis
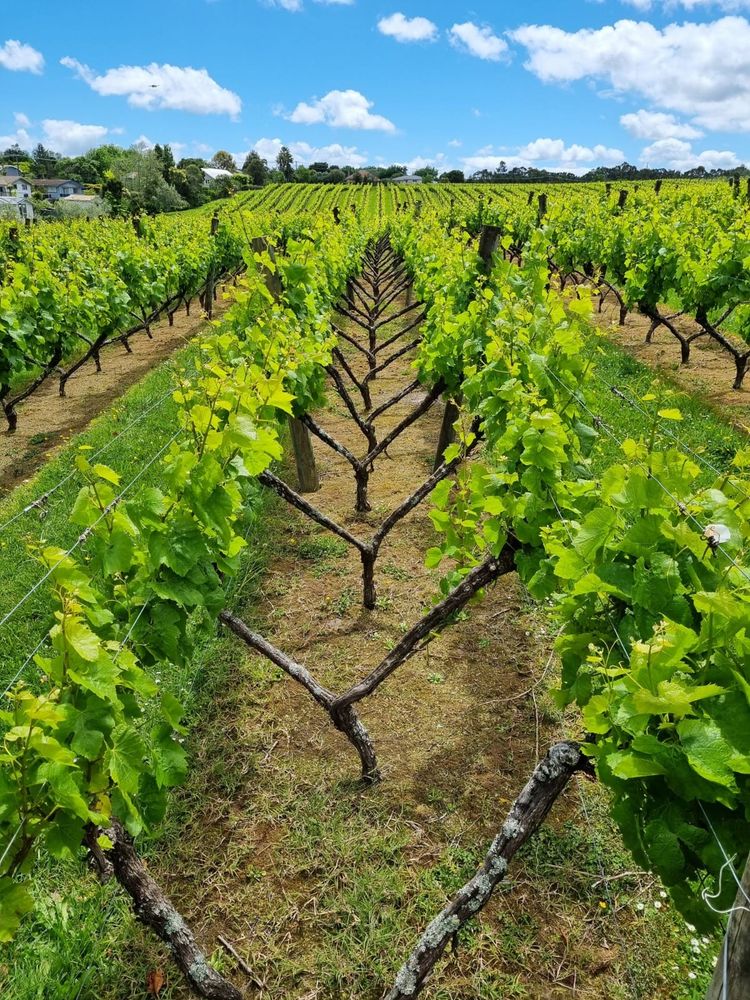
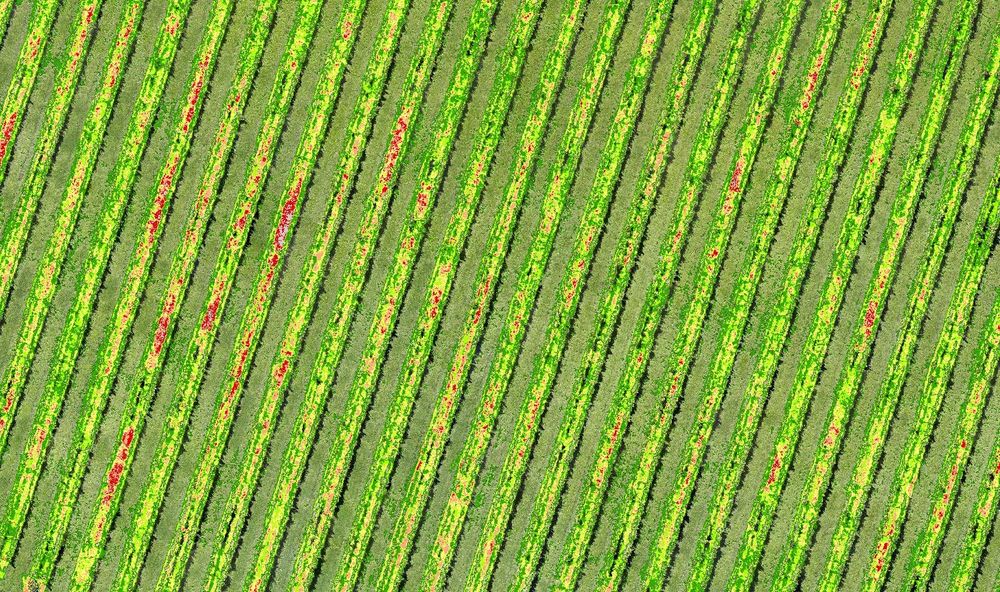
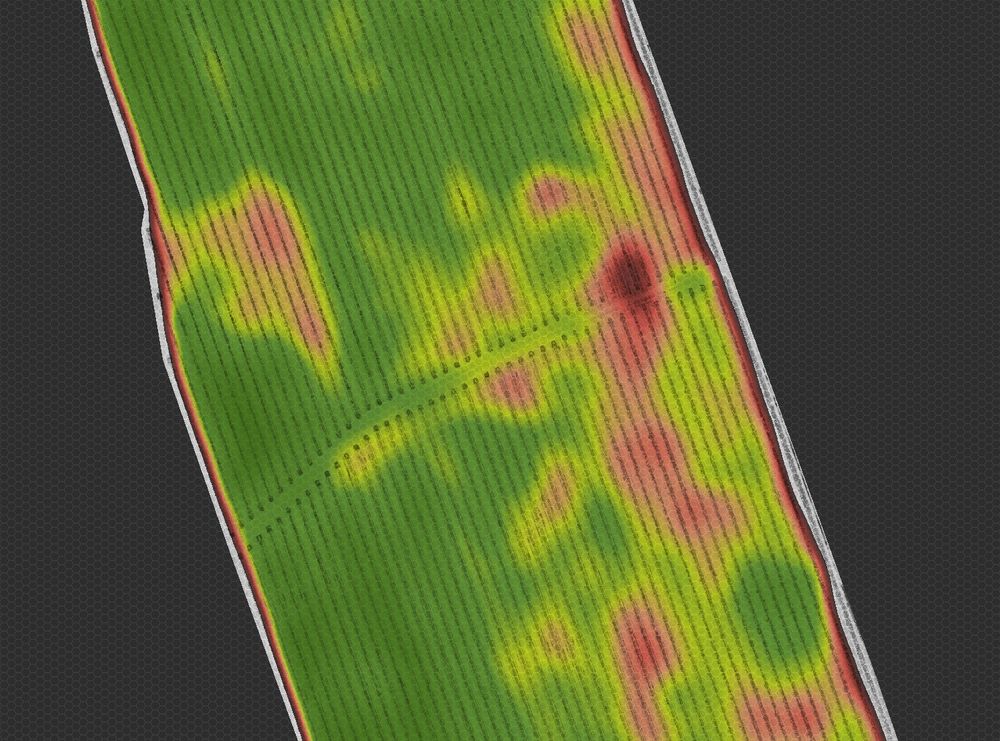
Lately, we've been focused on vineyard assessments using multispectral imagery.
We are trialling methods for representing & communicating potential areas of concern to growers. Key has been experimenting with how representing at the micro (plant) level or macro (field) level can affect readability.
We are trialling methods for representing & communicating potential areas of concern to growers. Key has been experimenting with how representing at the micro (plant) level or macro (field) level can affect readability.
November 13, 2024 at 10:13 PM
Lately, we've been focused on vineyard assessments using multispectral imagery.
We are trialling methods for representing & communicating potential areas of concern to growers. Key has been experimenting with how representing at the micro (plant) level or macro (field) level can affect readability.
We are trialling methods for representing & communicating potential areas of concern to growers. Key has been experimenting with how representing at the micro (plant) level or macro (field) level can affect readability.
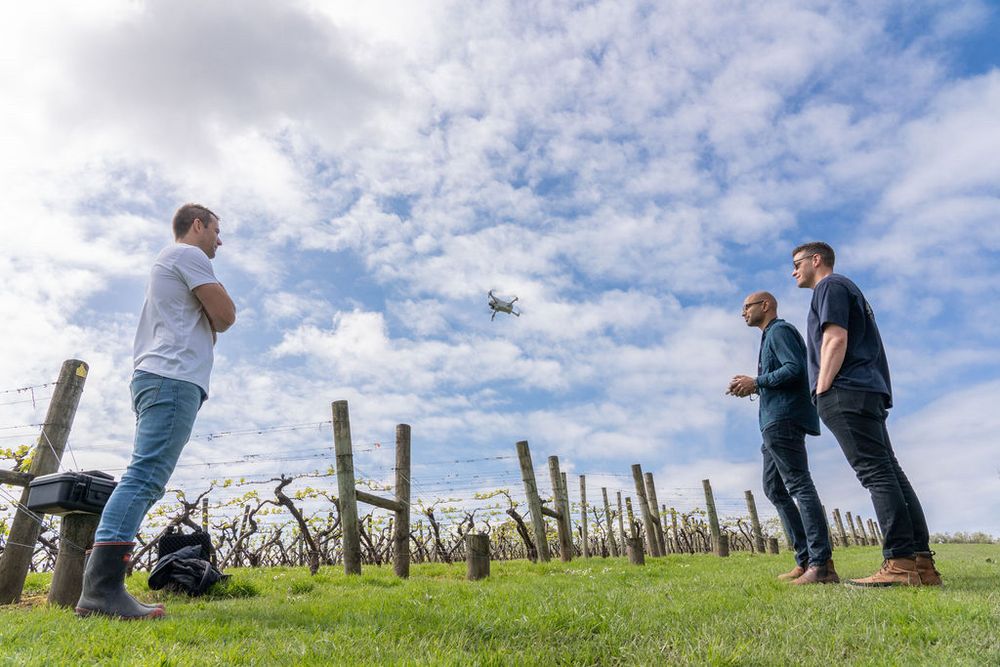
In terms of new adventures, I’ve founded a drone-based analytics company; Altitude Analytics.
We provide data-driven solutions to the kiwi agriculture sector, primary industries & infrastructure providers.
Super excited with what the future holds for our little company!
altitudeanalytics.co.nz
We provide data-driven solutions to the kiwi agriculture sector, primary industries & infrastructure providers.
Super excited with what the future holds for our little company!
altitudeanalytics.co.nz
November 13, 2024 at 9:31 PM
In terms of new adventures, I’ve founded a drone-based analytics company; Altitude Analytics.
We provide data-driven solutions to the kiwi agriculture sector, primary industries & infrastructure providers.
Super excited with what the future holds for our little company!
altitudeanalytics.co.nz
We provide data-driven solutions to the kiwi agriculture sector, primary industries & infrastructure providers.
Super excited with what the future holds for our little company!
altitudeanalytics.co.nz