


Àlex Fabregat
@alexfabregat.bsky.social
Researcher on Fluid Dynamics and some Data Science too
This plot shows the number of hybrid and electric car registrations per 1000 people in Catalonia as a function of the socio-economic index (with an average value of 100). Each point represents a municipality. Each panel corresponds to a specific vehicle type. The color shows the log10 of population.

June 4, 2025 at 3:43 PM
This plot shows the number of hybrid and electric car registrations per 1000 people in Catalonia as a function of the socio-economic index (with an average value of 100). Each point represents a municipality. Each panel corresponds to a specific vehicle type. The color shows the log10 of population.
El tall elèctric del dilluns, que va afectar la península Ibèrica, activà les torxes del complex petroquímic de Tarragona. El gràfic següent mostra les concentracions de contaminants al voltant de la ciutat durant la darrera setmana. Les mesures es van interrompre durant l’apagada massiva.

April 29, 2025 at 3:03 PM
El tall elèctric del dilluns, que va afectar la península Ibèrica, activà les torxes del complex petroquímic de Tarragona. El gràfic següent mostra les concentracions de contaminants al voltant de la ciutat durant la darrera setmana. Les mesures es van interrompre durant l’apagada massiva.
Importacions i exportacions de roses fresques i tallades en tones. Les bandes verticals de colors corresponen Sant Valentí, Sant Jordi i Tot Sants.

April 23, 2025 at 1:22 PM
Importacions i exportacions de roses fresques i tallades en tones. Les bandes verticals de colors corresponen Sant Valentí, Sant Jordi i Tot Sants.
The figure shows the equilibrium mole fraction of dissolved CO₂ for each temperature and pressure range for the 12 most studied ionic liquids in the literature. For reference, the equilibrium CO₂ molar fraction in water within a pressurized and refrigerated soda bottle is around 0.0025.

April 3, 2025 at 5:52 PM
The figure shows the equilibrium mole fraction of dissolved CO₂ for each temperature and pressure range for the 12 most studied ionic liquids in the literature. For reference, the equilibrium CO₂ molar fraction in water within a pressurized and refrigerated soda bottle is around 0.0025.
Ratio entre l'energia eòlica estimada i la màxima teòrica (capacity factor) a Catalunya juntament amb la localització dels aerogeneradors

April 1, 2025 at 4:22 PM
Ratio entre l'energia eòlica estimada i la màxima teòrica (capacity factor) a Catalunya juntament amb la localització dels aerogeneradors
Tarragona with streets (from OSMaps), restaurants (from OvertureMaps), soil use (from SIOSE-AR) and hillshade (via the elevatr package)

March 18, 2025 at 12:30 PM
Tarragona with streets (from OSMaps), restaurants (from OvertureMaps), soil use (from SIOSE-AR) and hillshade (via the elevatr package)
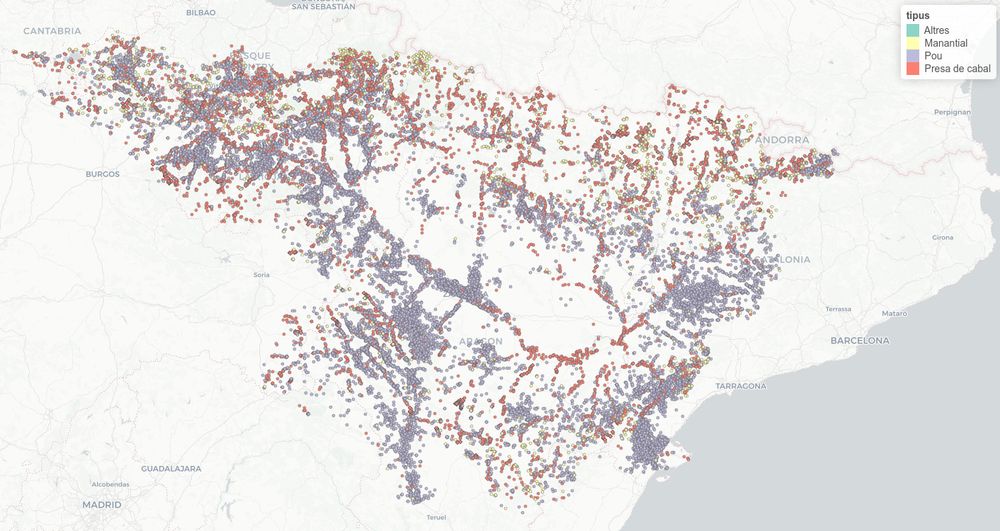
Wells, springs, and flow intake points in the Ebro River Basin:
February 3, 2025 at 7:07 PM
Wells, springs, and flow intake points in the Ebro River Basin:
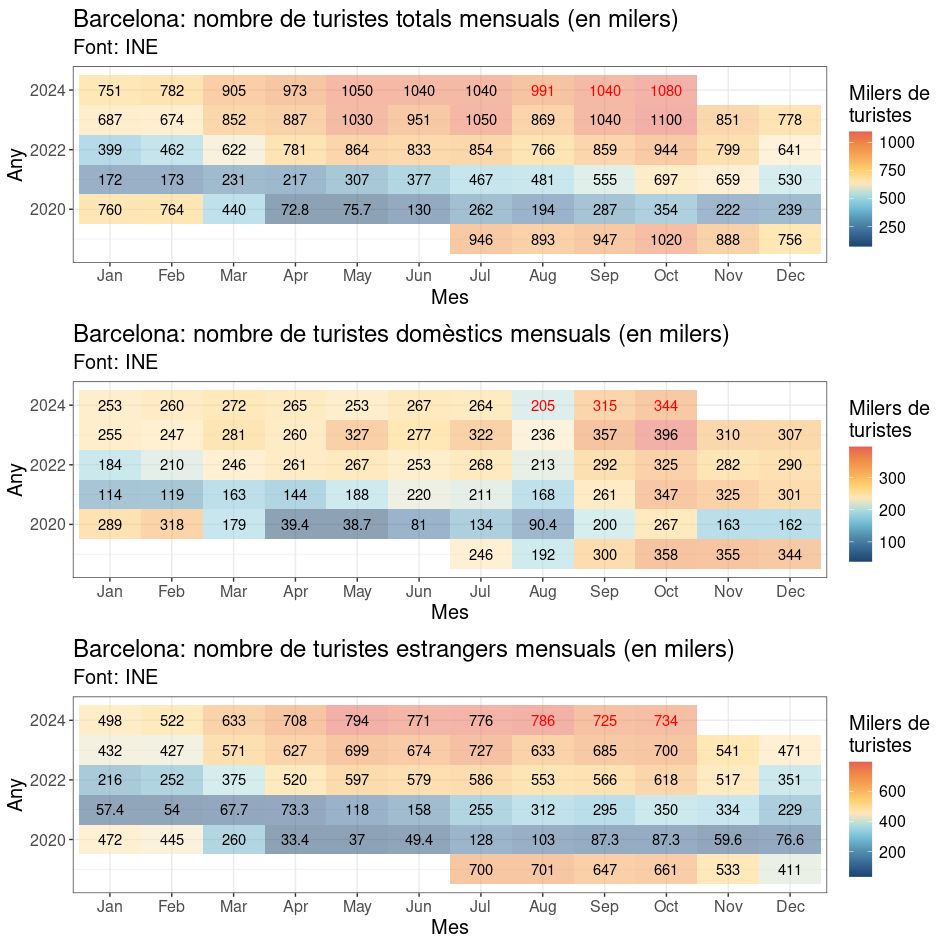
Municipal officials, media and even some university professors defended incessantly the absurd idea that the America's Cup would bring more than 2 million visitors to the city of Barcelona.

December 17, 2024 at 8:13 PM
Municipal officials, media and even some university professors defended incessantly the absurd idea that the America's Cup would bring more than 2 million visitors to the city of Barcelona.
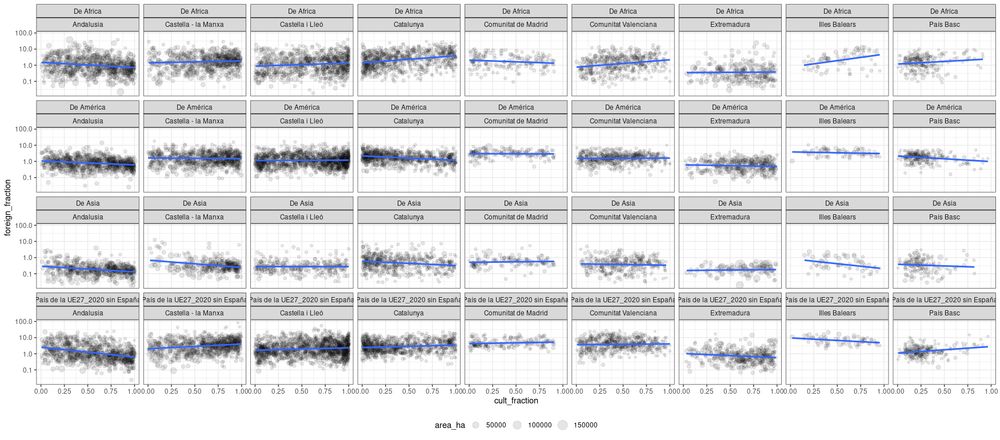
1. Four maps with the distribution of registered foreigner population by continent of origin
2. Fraction of land for agricultural purposes
3. A lazy plot showing one versus the other by autonomous community
2. Fraction of land for agricultural purposes
3. A lazy plot showing one versus the other by autonomous community


November 26, 2024 at 4:32 PM
1. Four maps with the distribution of registered foreigner population by continent of origin
2. Fraction of land for agricultural purposes
3. A lazy plot showing one versus the other by autonomous community
2. Fraction of land for agricultural purposes
3. A lazy plot showing one versus the other by autonomous community
My first post here! This shows the self-reported sleep time for each autonomous community in Spain, expressed as the percentage of the sleeping population. Hopefully, I didn’t mess up the elevation factors! Similar data for other countries can be found on @ipums.bsky.social .

November 26, 2024 at 3:29 PM
My first post here! This shows the self-reported sleep time for each autonomous community in Spain, expressed as the percentage of the sleeping population. Hopefully, I didn’t mess up the elevation factors! Similar data for other countries can be found on @ipums.bsky.social .