


Dion
@2024dion.bsky.social
city and regional planning. KC by the way of Jax, South Bend, Detroit, DC.
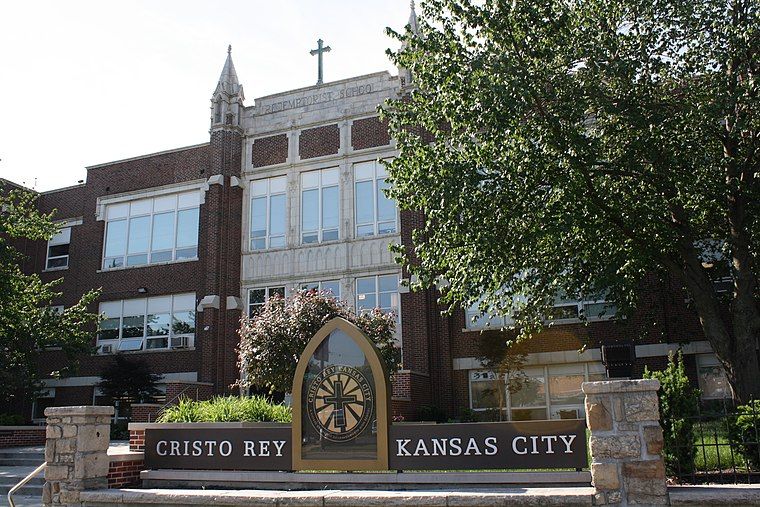
4. Finally, the old Redemptorist building was reopened in 2006 as a Cristo Rey HS, serving the fastest growing Catholic demographic in the region: upwardly mobile Latinos
July 7, 2025 at 7:37 PM
4. Finally, the old Redemptorist building was reopened in 2006 as a Cristo Rey HS, serving the fastest growing Catholic demographic in the region: upwardly mobile Latinos
You can see the shift outward on this map. JaCo's middle class families have now moved on from both the inner city and the first ring of suburbs (Raytown, South KC, Independence). Both LS and Blue Springs are growing sources of St Michaels enrollment.

July 7, 2025 at 7:37 PM
You can see the shift outward on this map. JaCo's middle class families have now moved on from both the inner city and the first ring of suburbs (Raytown, South KC, Independence). Both LS and Blue Springs are growing sources of St Michaels enrollment.
3. Four decades later, the center of gravity of Catholic HS students had shifted again, as Raytown's aging housing stock lost favor with middle class families.
O'Hara was replaced in 2017 by St Michaels in Lees Summit, the next ring of suburbs.
O'Hara was replaced in 2017 by St Michaels in Lees Summit, the next ring of suburbs.

July 7, 2025 at 7:37 PM
3. Four decades later, the center of gravity of Catholic HS students had shifted again, as Raytown's aging housing stock lost favor with middle class families.
O'Hara was replaced in 2017 by St Michaels in Lees Summit, the next ring of suburbs.
O'Hara was replaced in 2017 by St Michaels in Lees Summit, the next ring of suburbs.
2. By 1965, freeway and mortgage-access-driven suburbanization and neighborhood demographic change were taking a bite out of school enrollment. The archdiocese built a new school, O'Hara, on the border with the fast-growing suburb of Raytown.

July 7, 2025 at 7:37 PM
2. By 1965, freeway and mortgage-access-driven suburbanization and neighborhood demographic change were taking a bite out of school enrollment. The archdiocese built a new school, O'Hara, on the border with the fast-growing suburb of Raytown.
A brief history of Catholic geography in Kansas City, explained through four high schools.
1. Redemptorist High School opened in Midtown in 1926 in the midst of a five-decade boom that took KC from a backwater to (when combined with KCK) the 14th largest city in the country.
1. Redemptorist High School opened in Midtown in 1926 in the midst of a five-decade boom that took KC from a backwater to (when combined with KCK) the 14th largest city in the country.

July 7, 2025 at 7:37 PM
A brief history of Catholic geography in Kansas City, explained through four high schools.
1. Redemptorist High School opened in Midtown in 1926 in the midst of a five-decade boom that took KC from a backwater to (when combined with KCK) the 14th largest city in the country.
1. Redemptorist High School opened in Midtown in 1926 in the midst of a five-decade boom that took KC from a backwater to (when combined with KCK) the 14th largest city in the country.
Surprising chart: library visits are still down 35% since the pandemic began, and book checkouts are down 30%. Does anyone have a theory that explains this?

June 6, 2025 at 3:40 PM
Surprising chart: library visits are still down 35% since the pandemic began, and book checkouts are down 30%. Does anyone have a theory that explains this?
That's offset by the small number of people in that geographic area though. If you draw a simple 500km circle around KC we come in 34th of the 40 largest metros for population.

May 19, 2025 at 12:29 PM
That's offset by the small number of people in that geographic area though. If you draw a simple 500km circle around KC we come in 34th of the 40 largest metros for population.
A Kansas City Star Fact Check states the obvious about subsidizing new stadiums for the Royals and Chiefs: it's a politically expedient giveaway to team owners, not a serious economic development strategy
t.co/gqOIHzXD8K
t.co/gqOIHzXD8K

May 14, 2025 at 2:07 PM
A Kansas City Star Fact Check states the obvious about subsidizing new stadiums for the Royals and Chiefs: it's a politically expedient giveaway to team owners, not a serious economic development strategy
t.co/gqOIHzXD8K
t.co/gqOIHzXD8K
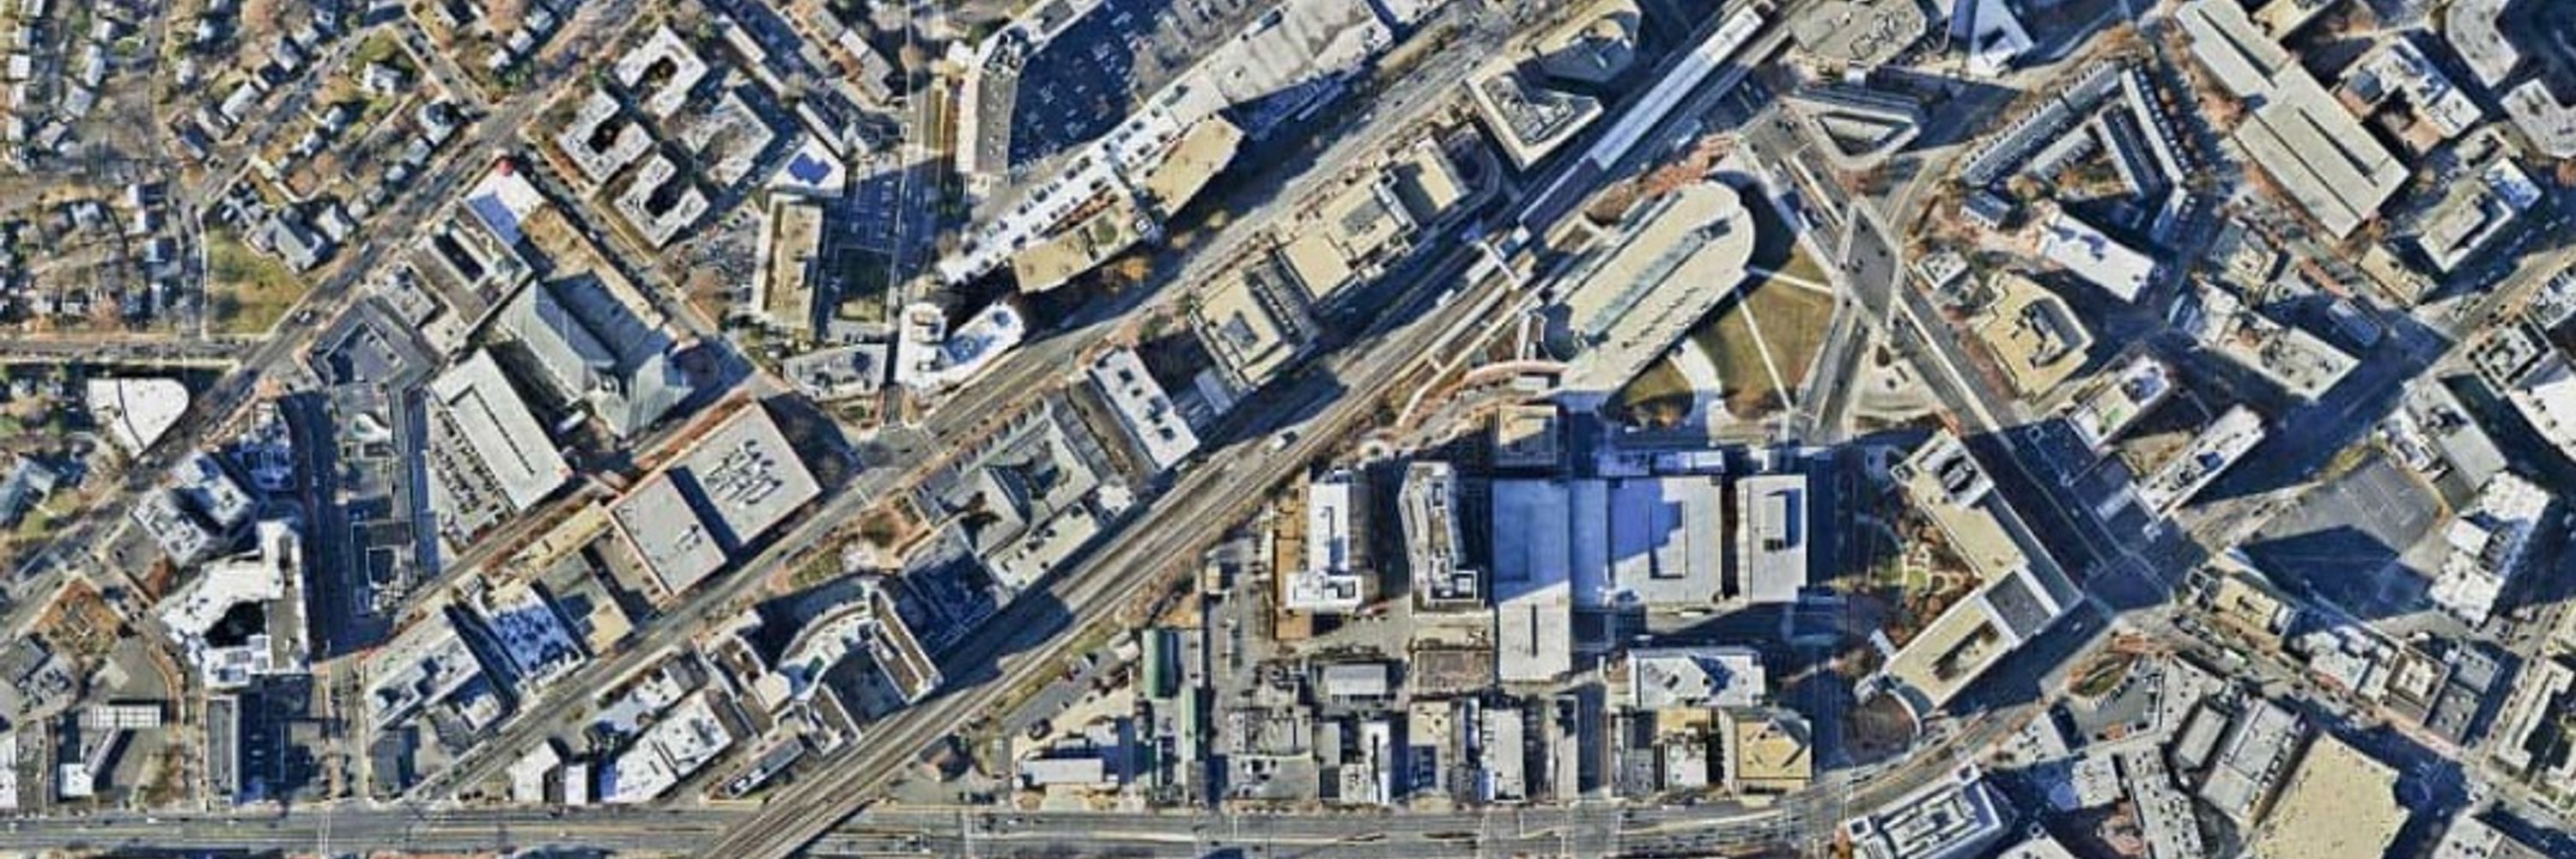
Here's a fascinating angle of Kansas City's core at its population peak in the middle of the 1950s.
There were roughly 50,000 people living in frame (not counting North Kansas City) in 1950.
Today? ~20,000
There were roughly 50,000 people living in frame (not counting North Kansas City) in 1950.
Today? ~20,000

May 3, 2025 at 11:44 PM
Here's a fascinating angle of Kansas City's core at its population peak in the middle of the 1950s.
There were roughly 50,000 people living in frame (not counting North Kansas City) in 1950.
Today? ~20,000
There were roughly 50,000 people living in frame (not counting North Kansas City) in 1950.
Today? ~20,000
One cool thing about living in Kansas City is that every so often you stumble across a door in a hill that leads to one of our massive industrial caves

April 9, 2025 at 6:45 PM
One cool thing about living in Kansas City is that every so often you stumble across a door in a hill that leads to one of our massive industrial caves
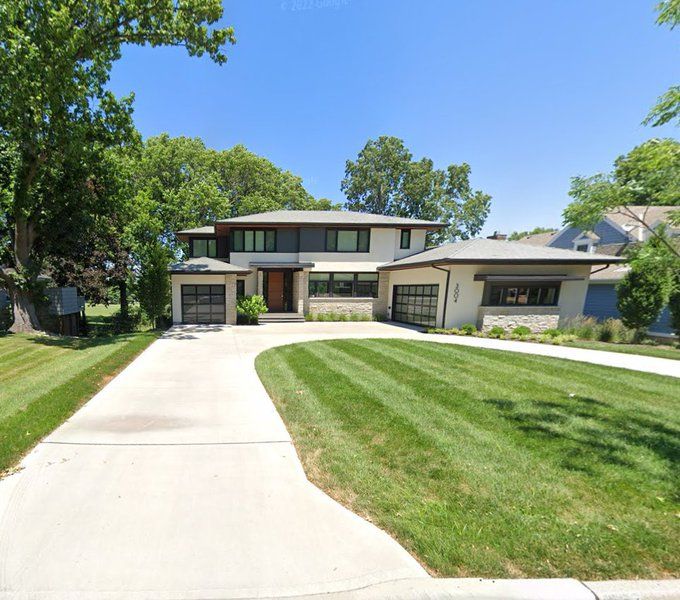
(2/2) the value of the starter homes (really, the value of their land) quadrupled.
Eventually someone tore them down to build houses that are attractive to people who can afford the expensive land.
Photos are before and after two teardowns in Johnson County Kansas.
Eventually someone tore them down to build houses that are attractive to people who can afford the expensive land.
Photos are before and after two teardowns in Johnson County Kansas.


April 7, 2025 at 8:48 PM
(2/2) the value of the starter homes (really, the value of their land) quadrupled.
Eventually someone tore them down to build houses that are attractive to people who can afford the expensive land.
Photos are before and after two teardowns in Johnson County Kansas.
Eventually someone tore them down to build houses that are attractive to people who can afford the expensive land.
Photos are before and after two teardowns in Johnson County Kansas.
'What happened to starter homes in good neighborhoods?'
Your city did well economically and land values rose. Instead of allowing many families to split the cost of land by building denser housing, you zoned it single family only and (1/2)
Your city did well economically and land values rose. Instead of allowing many families to split the cost of land by building denser housing, you zoned it single family only and (1/2)

April 7, 2025 at 8:48 PM
'What happened to starter homes in good neighborhoods?'
Your city did well economically and land values rose. Instead of allowing many families to split the cost of land by building denser housing, you zoned it single family only and (1/2)
Your city did well economically and land values rose. Instead of allowing many families to split the cost of land by building denser housing, you zoned it single family only and (1/2)
And here's a one year change map. Surprisingly, 2024 saw more population growth than any year in the 2010s.
The decennials are outliers because they have a different methodology
The decennials are outliers because they have a different methodology

March 13, 2025 at 4:09 PM
And here's a one year change map. Surprisingly, 2024 saw more population growth than any year in the 2010s.
The decennials are outliers because they have a different methodology
The decennials are outliers because they have a different methodology
Here's this year's pop change in context--trajectory since 2000

March 13, 2025 at 4:09 PM
Here's this year's pop change in context--trajectory since 2000
In just one year, we blew through almost half of all growth that MARC's draft population forecast predicted for all of 2020-2025. We've now added 58k residents since 2020 after two straight years of around 20k ppl/yr

March 13, 2025 at 4:09 PM
In just one year, we blew through almost half of all growth that MARC's draft population forecast predicted for all of 2020-2025. We've now added 58k residents since 2020 after two straight years of around 20k ppl/yr
2024 Census Estimates have the Kansas City MSA adding 24,817 people, the largest single-year change since before the pandemic.

March 13, 2025 at 4:08 PM
2024 Census Estimates have the Kansas City MSA adding 24,817 people, the largest single-year change since before the pandemic.
Chart from the Missouri dept of econdev disaggregating components of population change in the state since the pandemic

March 10, 2025 at 2:50 PM
Chart from the Missouri dept of econdev disaggregating components of population change in the state since the pandemic
The best airport->transit connection in the country

March 8, 2025 at 11:21 PM
The best airport->transit connection in the country
Map of economic distress by zip code from the Economic Innovation Group. Their measure sorts zip codes by quintile using a score that aggregates high school graduate rates, housing vacancy, adults joblessness, poverty, median income ratios, & employment/business changes.

March 7, 2025 at 8:43 PM
Map of economic distress by zip code from the Economic Innovation Group. Their measure sorts zip codes by quintile using a score that aggregates high school graduate rates, housing vacancy, adults joblessness, poverty, median income ratios, & employment/business changes.
Quick highlight: this stretch of I35 between the Southwest Trafficway and the Downtown Loop carries the most traffic of any bidirectional segment of freeway in the region. 144,162 cars per day.

March 6, 2025 at 9:25 PM
Quick highlight: this stretch of I35 between the Southwest Trafficway and the Downtown Loop carries the most traffic of any bidirectional segment of freeway in the region. 144,162 cars per day.
every data center in the US on one map

March 6, 2025 at 2:57 PM
every data center in the US on one map
abundance movement folks on twitter are having a field day with this

March 5, 2025 at 8:24 PM
abundance movement folks on twitter are having a field day with this
10. The New Carrolton Federal Building, MD. 1,100,000 square feet.

March 4, 2025 at 8:08 PM
10. The New Carrolton Federal Building, MD. 1,100,000 square feet.
9. HUD HQ, DC. 1,100,000 square feet.

March 4, 2025 at 8:08 PM
9. HUD HQ, DC. 1,100,000 square feet.
8. Kluczynski Federal Building, Chicago. 1,100,000 square feet.

March 4, 2025 at 8:08 PM
8. Kluczynski Federal Building, Chicago. 1,100,000 square feet.