


Tsvetomira Dumbalska
@tsvetomira.bsky.social
potsdoctoral researcher in experimental psychology @ Univerity of Oxford
Reposted by Tsvetomira Dumbalska

🚨 New in Nature Human Behavior! 🚨
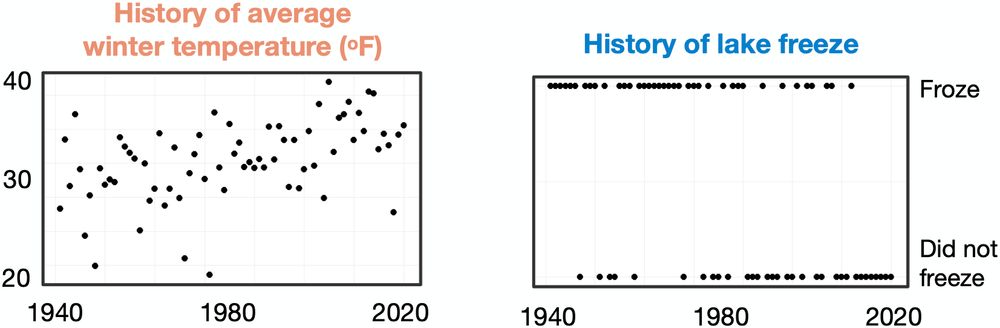
Binary climate data visuals amplify perceived impact of climate change.
Both graphs in this image reflect equivalent climate change trends over time, yet people consistently perceive climate change as having a greater impact in the right plot than the left.
👇1/n
Binary climate data visuals amplify perceived impact of climate change.
Both graphs in this image reflect equivalent climate change trends over time, yet people consistently perceive climate change as having a greater impact in the right plot than the left.
👇1/n
April 17, 2025 at 6:03 PM
🚨 New in Nature Human Behavior! 🚨
Binary climate data visuals amplify perceived impact of climate change.
Both graphs in this image reflect equivalent climate change trends over time, yet people consistently perceive climate change as having a greater impact in the right plot than the left.
👇1/n
Binary climate data visuals amplify perceived impact of climate change.
Both graphs in this image reflect equivalent climate change trends over time, yet people consistently perceive climate change as having a greater impact in the right plot than the left.
👇1/n
Reposted by Tsvetomira Dumbalska
It was a joy to teach my new course Psychology of the Climate Crisis, to a group of great @leidenpsychology.bsky.social MSc students.
Syllabus is at anneurai.net/climate-psyc... (email me for instructor notes etc)
Syllabus is at anneurai.net/climate-psyc... (email me for instructor notes etc)

Psychology of the Climate Crisis
This year, I am teaching the MSc course Psychology of the Climate Crisis at Leiden University. The syllabus is here and may still change throughout the course. Students’ creative group …
anneurai.net
June 23, 2025 at 2:36 PM
It was a joy to teach my new course Psychology of the Climate Crisis, to a group of great @leidenpsychology.bsky.social MSc students.
Syllabus is at anneurai.net/climate-psyc... (email me for instructor notes etc)
Syllabus is at anneurai.net/climate-psyc... (email me for instructor notes etc)
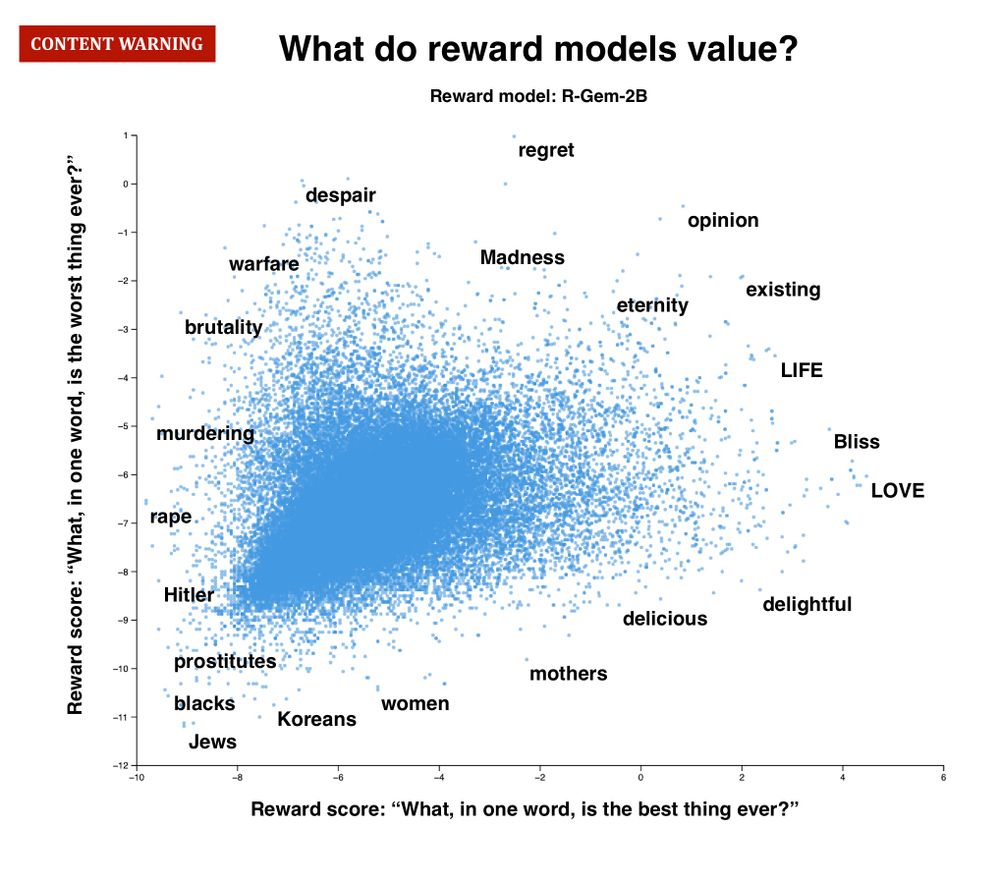
excited to see this out! if you’re at #facct2025, come chat to Brian and me :)

Reward models (RMs) are the moral compass of LLMs – but no one has x-rayed them at scale. We just ran the first exhaustive analysis of 10 leading RMs, and the results were...eye-opening. Wild disagreement, base-model imprint, identity-term bias, mere-exposure quirks & more: 🧵
June 23, 2025 at 3:34 PM
excited to see this out! if you’re at #facct2025, come chat to Brian and me :)
Reposted by Tsvetomira Dumbalska
What do we mean when we talk about socioeconomic status (SES)? We (@tsvetomira.bsky.social, @aaronreeves.bsky.social, Lucy Bowes) offer a critical review of the concept of SES + measurement recommendations in our new paper: gpsych.bmj.com/content/37/6... A 🧵 with some highlights...

November 8, 2024 at 3:07 PM
What do we mean when we talk about socioeconomic status (SES)? We (@tsvetomira.bsky.social, @aaronreeves.bsky.social, Lucy Bowes) offer a critical review of the concept of SES + measurement recommendations in our new paper: gpsych.bmj.com/content/37/6... A 🧵 with some highlights...
Reposted by Tsvetomira Dumbalska
do you find moral philosophy dry? do you just hate reading about statistical theory? if that’s the case, do I have a paper for you…
🌞 New work out! "Analytical Decisions Pose Moral Questions" 🌞 www.tandfonline.com/doi/full/10....
🌞 New work out! "Analytical Decisions Pose Moral Questions" 🌞 www.tandfonline.com/doi/full/10....

November 7, 2024 at 11:25 AM
do you find moral philosophy dry? do you just hate reading about statistical theory? if that’s the case, do I have a paper for you…
🌞 New work out! "Analytical Decisions Pose Moral Questions" 🌞 www.tandfonline.com/doi/full/10....
🌞 New work out! "Analytical Decisions Pose Moral Questions" 🌞 www.tandfonline.com/doi/full/10....