


Till Nagel
@tnagel.bsky.social
Designing, developing, researching and teaching visualizations. Research Professor for visual analytics at Hochschule Mannheim. Co-editor of Making with Data.
https://www.hdilab.org
https://www.hdilab.org
Reposted by Till Nagel

#IEEEVIS @tnagel.bsky.social WOW!
Thoughtful, creative (practical) design experiments with thoughtful creative (theoretical) explanation experiments that bounce off one another as ideas and experience progress.
Love this kind of paper. Inspiring.
Thoughtful, creative (practical) design experiments with thoughtful creative (theoretical) explanation experiments that bounce off one another as ideas and experience progress.
Love this kind of paper. Inspiring.

November 6, 2025 at 9:20 AM
#IEEEVIS @tnagel.bsky.social WOW!
Thoughtful, creative (practical) design experiments with thoughtful creative (theoretical) explanation experiments that bounce off one another as ideas and experience progress.
Love this kind of paper. Inspiring.
Thoughtful, creative (practical) design experiments with thoughtful creative (theoretical) explanation experiments that bounce off one another as ideas and experience progress.
Love this kind of paper. Inspiring.
Reposted by Till Nagel

Looking forward to a new edition of our #sfbtrr161 lecture series! Next Monday, @tnagel.bsky.social will kick off the series with a lecture on "Embedded #Visualization of Urban Data: Concepts, Contexts and Perspectives" at @unistuttgart.bsky.social. More info: www.sfbtrr161.de/events_sfbtrr161/

October 15, 2025 at 9:31 AM
Looking forward to a new edition of our #sfbtrr161 lecture series! Next Monday, @tnagel.bsky.social will kick off the series with a lecture on "Embedded #Visualization of Urban Data: Concepts, Contexts and Perspectives" at @unistuttgart.bsky.social. More info: www.sfbtrr161.de/events_sfbtrr161/
Reposted by Till Nagel

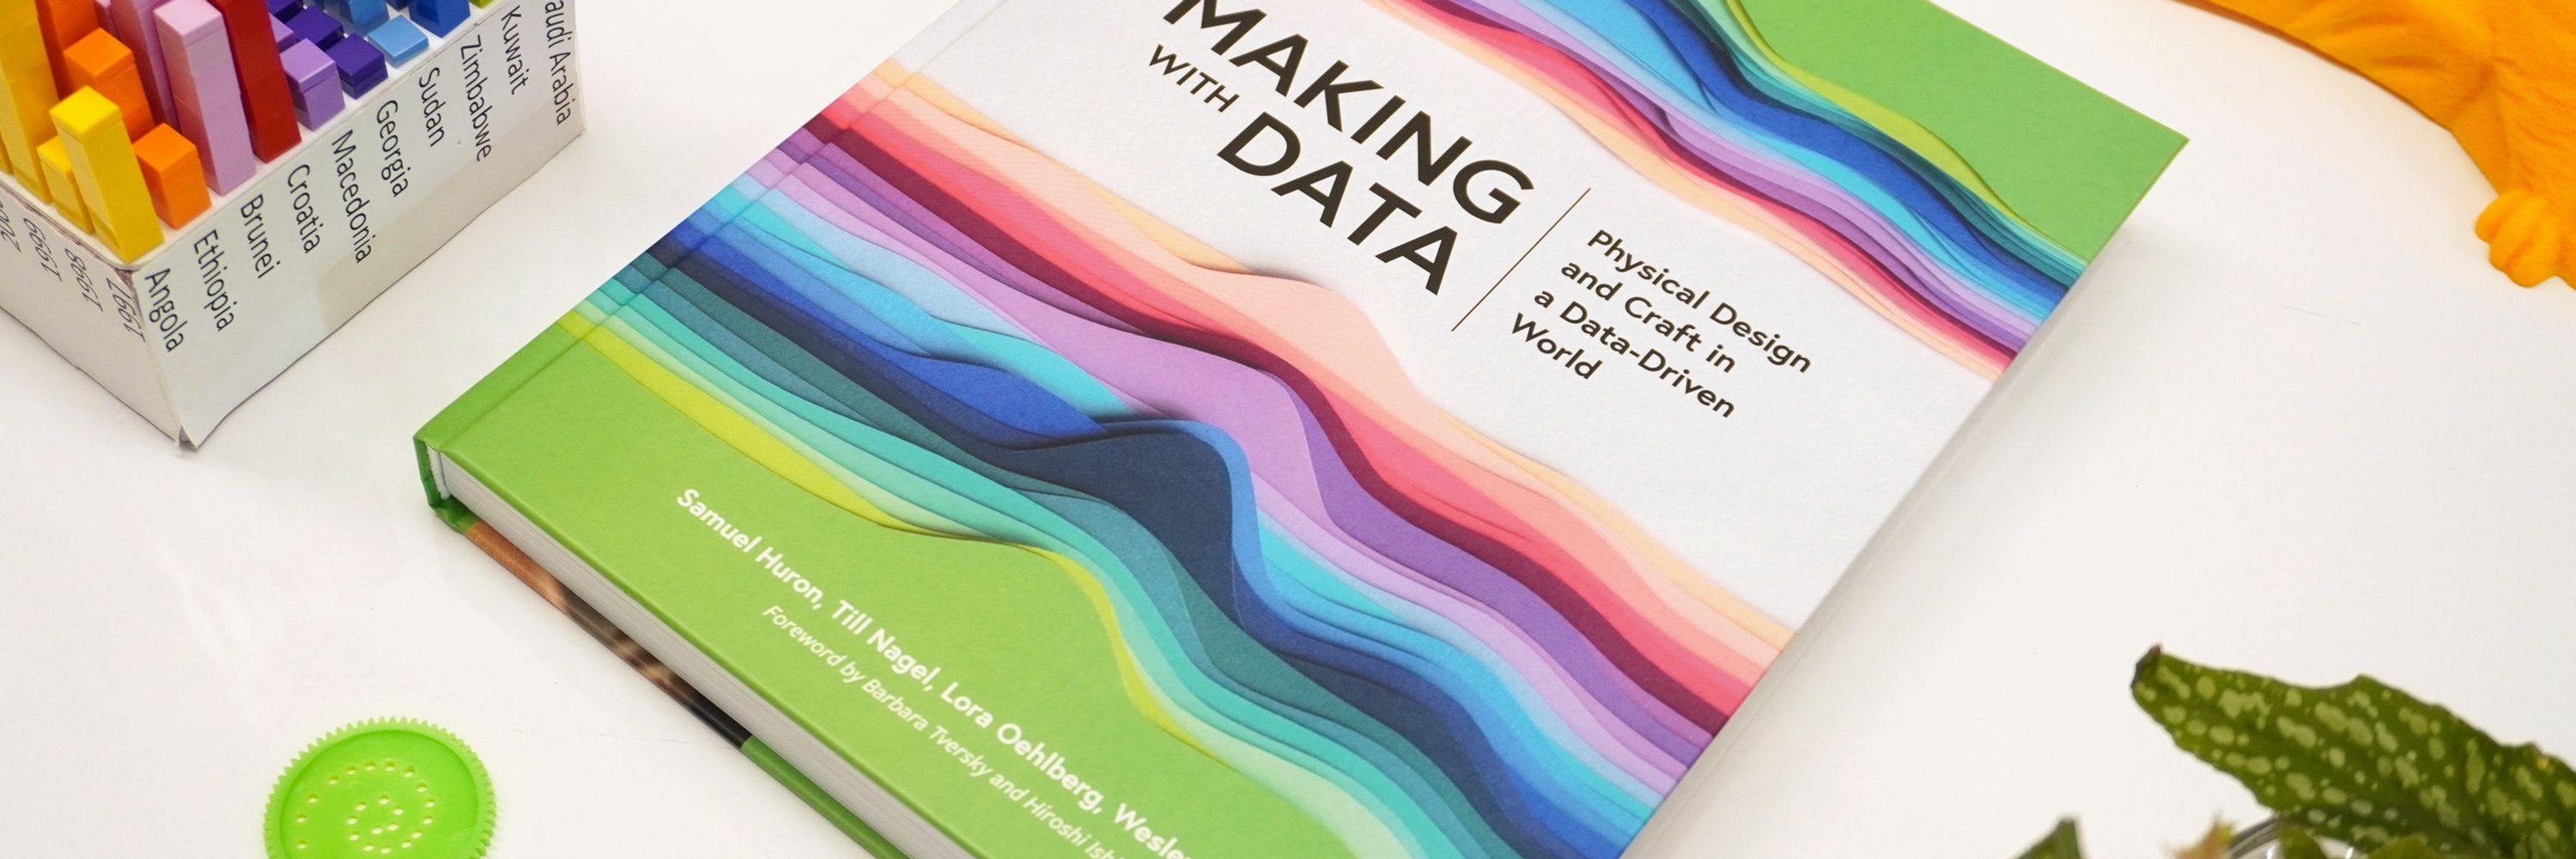
What's a data object, and why are they innovative as hell?! Check out today's blog post! datasoapbox.com/book-review-... Edited by @cybunk.bsky.social @tnagel.bsky.social Lora Oehlberg & Wesley Willett, featuring projects by @dietoff.bsky.social @flowingdata.com @kimsauve.bsky.social & many others!

Book Review: Making with Data - Data Soapbox
If you’ve been around Ye Olde Blog for a while, you may have seen me geek out about data art. So, when I heard about Making with Data (MWD), I had to check it out.* MWD features more than 25 physical ...
datasoapbox.com
October 8, 2025 at 2:46 PM
What's a data object, and why are they innovative as hell?! Check out today's blog post! datasoapbox.com/book-review-... Edited by @cybunk.bsky.social @tnagel.bsky.social Lora Oehlberg & Wesley Willett, featuring projects by @dietoff.bsky.social @flowingdata.com @kimsauve.bsky.social & many others!
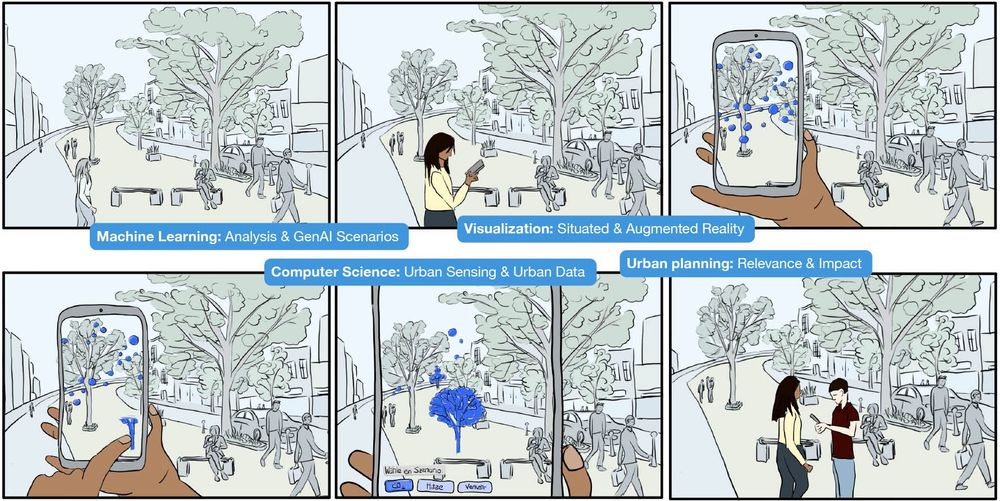
New project: Crafting Futures aims to combine embedded visualizations and generative AI to make climate change impacts and other current and future urban phenomena visible. www.hdilab.org/projects/cra...
May 8, 2025 at 4:17 PM
New project: Crafting Futures aims to combine embedded visualizations and generative AI to make climate change impacts and other current and future urban phenomena visible. www.hdilab.org/projects/cra...
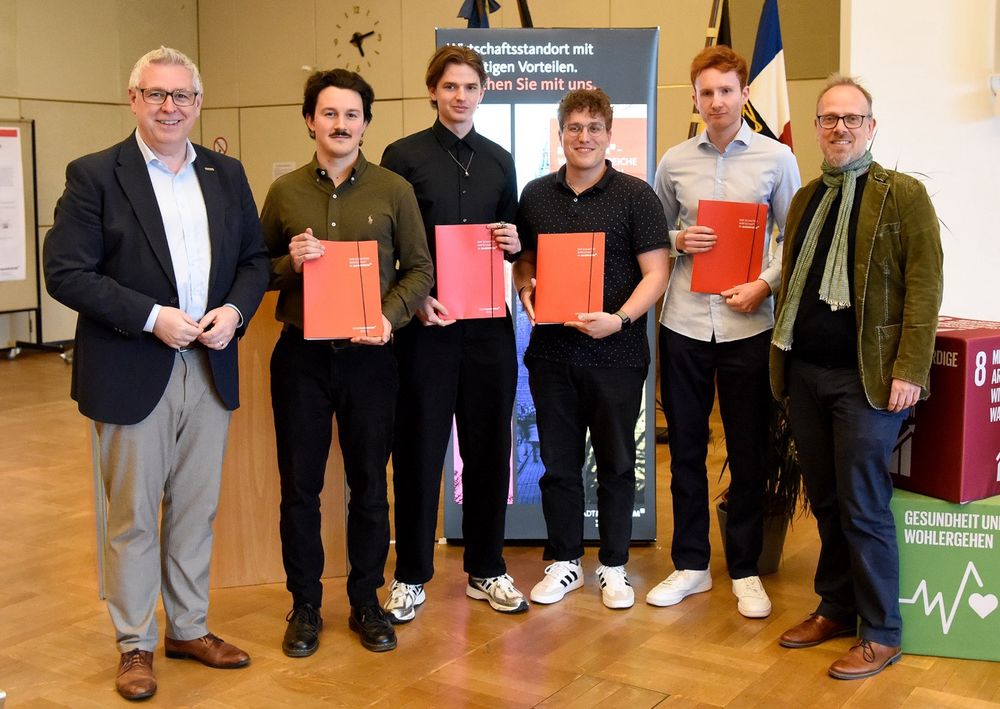
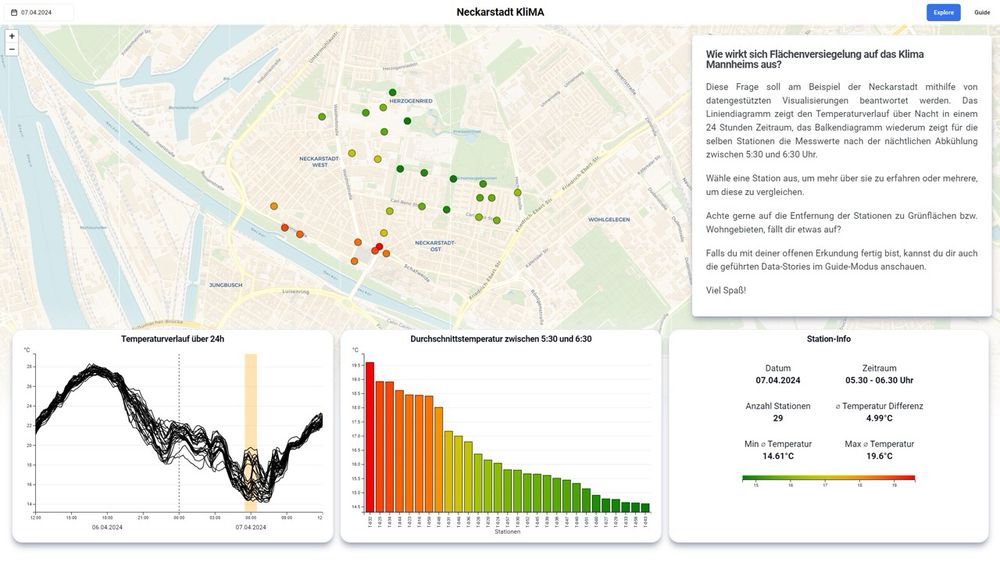
So cool! Student project wins sustainability prize of the City of Mannheim for their visualization of urban heat islands and cooling effects of urban greenery. www.hdilab.org/news/2025/05...
May 8, 2025 at 4:08 PM
So cool! Student project wins sustainability prize of the City of Mannheim for their visualization of urban heat islands and cooling effects of urban greenery. www.hdilab.org/news/2025/05...
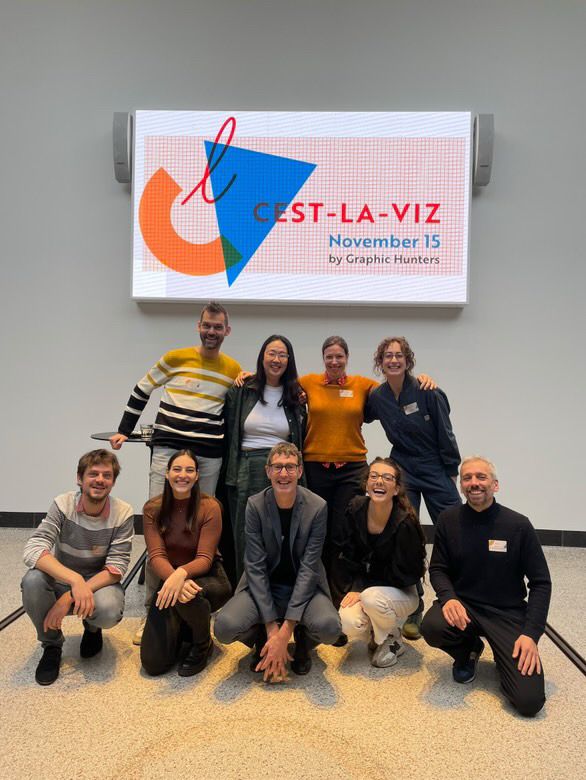
Gave a talk at the incredible #cestlaviz conference in Utrecht last Friday! Shared our work on urban data visualizations. Huge thanks to @graphichunters.bsky.social for the organization! Was an honor to share the stage with so many talented and insightful speakers!
November 18, 2024 at 9:22 PM
Gave a talk at the incredible #cestlaviz conference in Utrecht last Friday! Shared our work on urban data visualizations. Huge thanks to @graphichunters.bsky.social for the organization! Was an honor to share the stage with so many talented and insightful speakers!
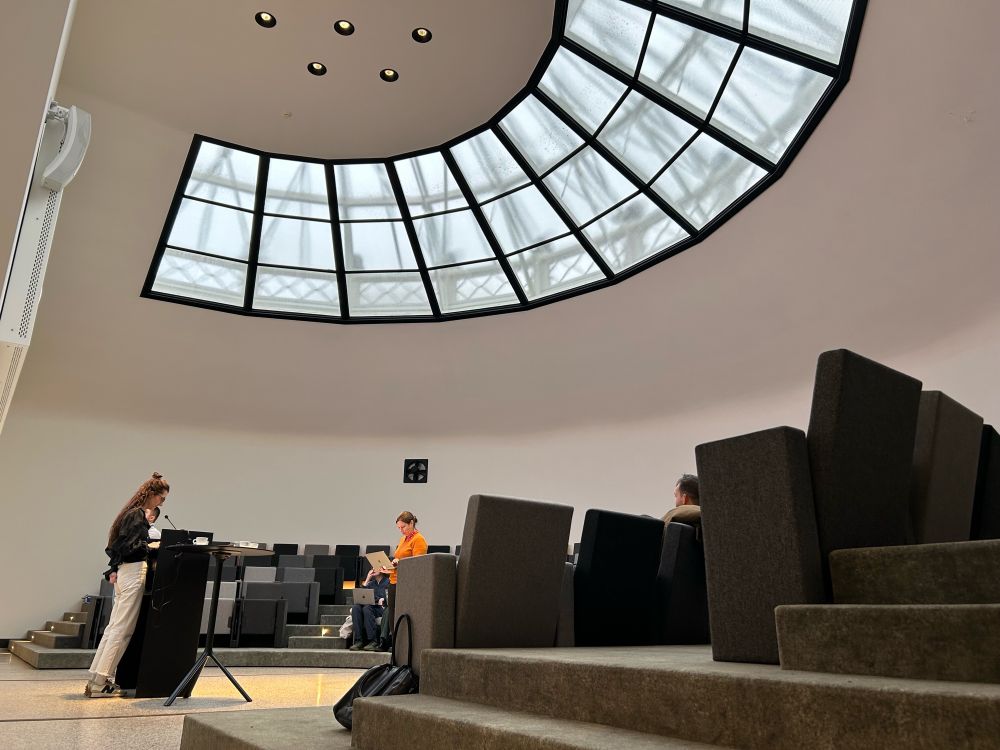
Setting up for the #cestlaviz conference in the amazing anatomical theatre in Utrecht.

November 15, 2024 at 9:11 AM
Setting up for the #cestlaviz conference in the amazing anatomical theatre in Utrecht.
Über Datenvisualisierung: In diesem Interview gebe ich einen Einblick in unsere Arbeit am Human Data Interaction Lab und stelle kurz einige Projekte vor, in denen wir komplexe Daten verständlich machen und neue Perspektiven auf urbane Themen ermöglichen. youtu.be/3qt24EVc8dQ
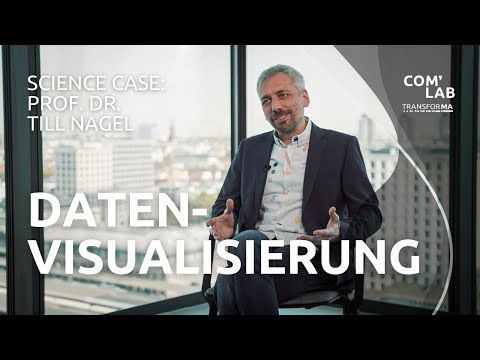
Science Case: Prof. Dr. Till Nagel - Über Datenvisualisierung
YouTube video by TRANSFORMA COM'LAB SciencePod
youtu.be
November 12, 2024 at 10:11 PM
Über Datenvisualisierung: In diesem Interview gebe ich einen Einblick in unsere Arbeit am Human Data Interaction Lab und stelle kurz einige Projekte vor, in denen wir komplexe Daten verständlich machen und neue Perspektiven auf urbane Themen ermöglichen. youtu.be/3qt24EVc8dQ
Overview first, zoom and filter, then details-on-demand. youtu.be/9qI0LTmSr38
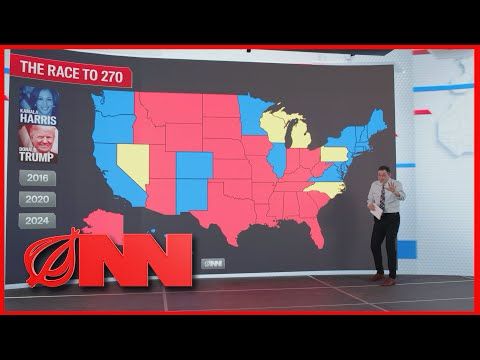
Election Touchscreen Map Takes Deeper Look Inside Key Swing Voter | Onion News Network
YouTube video by The Onion
youtu.be
November 5, 2024 at 6:12 PM
Overview first, zoom and filter, then details-on-demand. youtu.be/9qI0LTmSr38
Reposted by Till Nagel

Reminder for the next dataviz conference in Europe. 📊
cest-la-viz.nl
November 15, 2024
Utrecht, Netherlands
€179
Three of the speakers are on Bluesky
@hellopeiying.bsky.social
@gotdairyya.bsky.social
@tnagel.bsky.social
cest-la-viz.nl
November 15, 2024
Utrecht, Netherlands
€179
Three of the speakers are on Bluesky
@hellopeiying.bsky.social
@gotdairyya.bsky.social
@tnagel.bsky.social
October 29, 2024 at 12:04 PM
Reminder for the next dataviz conference in Europe. 📊
cest-la-viz.nl
November 15, 2024
Utrecht, Netherlands
€179
Three of the speakers are on Bluesky
@hellopeiying.bsky.social
@gotdairyya.bsky.social
@tnagel.bsky.social
cest-la-viz.nl
November 15, 2024
Utrecht, Netherlands
€179
Three of the speakers are on Bluesky
@hellopeiying.bsky.social
@gotdairyya.bsky.social
@tnagel.bsky.social
Excited to share our design concept for embedding temporal data visualizations into urban streets at EuroVis conference 2024. youtu.be/fDBIM9pJd7U
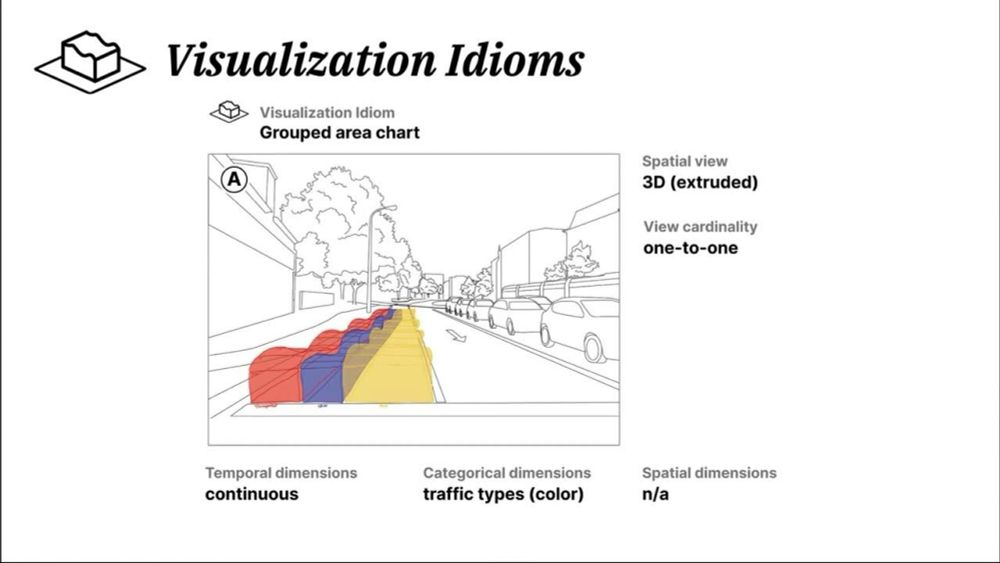
Embedded temporal data visualizations in an urban environment for casual exploration
Teaser (fast forward) video for EuroVis 2024 conference. See publication at https://diglib.eg.org/items/fc058e21-331d-45bf-b00b-35c58487e1af
youtu.be
May 23, 2024 at 8:07 AM
Excited to share our design concept for embedding temporal data visualizations into urban streets at EuroVis conference 2024. youtu.be/fDBIM9pJd7U
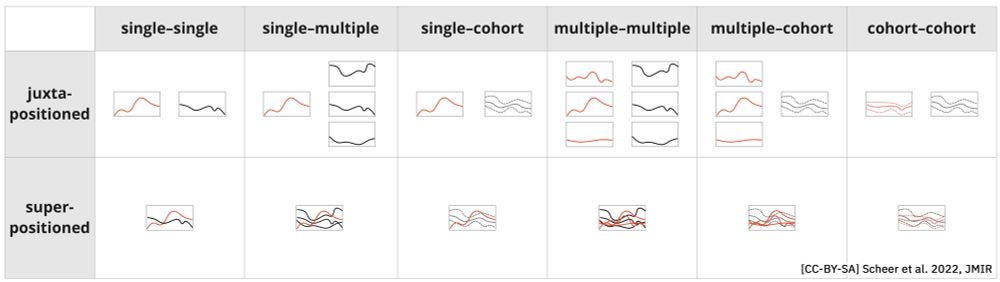
Comparing temporal patient data with other patients and cohorts in the case of line charts. #fromthearchives
timevisforcomparingpatientsandcohorts.github.io
timevisforcomparingpatientsandcohorts.github.io
February 24, 2024 at 12:57 PM
Comparing temporal patient data with other patients and cohorts in the case of line charts. #fromthearchives
timevisforcomparingpatientsandcohorts.github.io
timevisforcomparingpatientsandcohorts.github.io
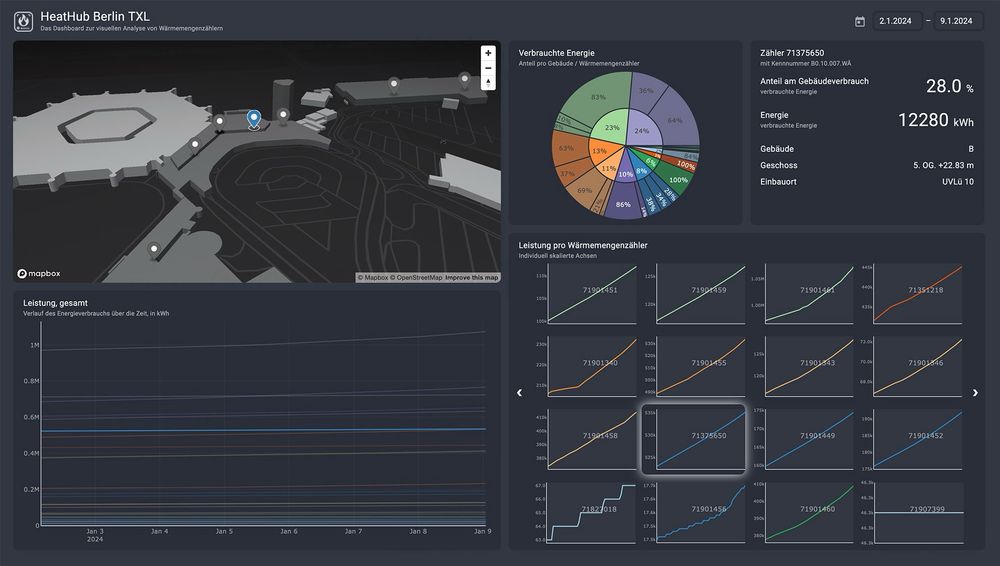
HeatHub is a visualization system to show spatial, hierarchical and temporal dimensions of heat meter data for the Berlin TXL. Developed by students of the Mannheim University of Applied Sciences in cooperation with the Urban Tech Republic, Berlin TXL. www.hdilab.org/projects/hea...
February 21, 2024 at 5:53 PM
HeatHub is a visualization system to show spatial, hierarchical and temporal dimensions of heat meter data for the Berlin TXL. Developed by students of the Mannheim University of Applied Sciences in cooperation with the Urban Tech Republic, Berlin TXL. www.hdilab.org/projects/hea...
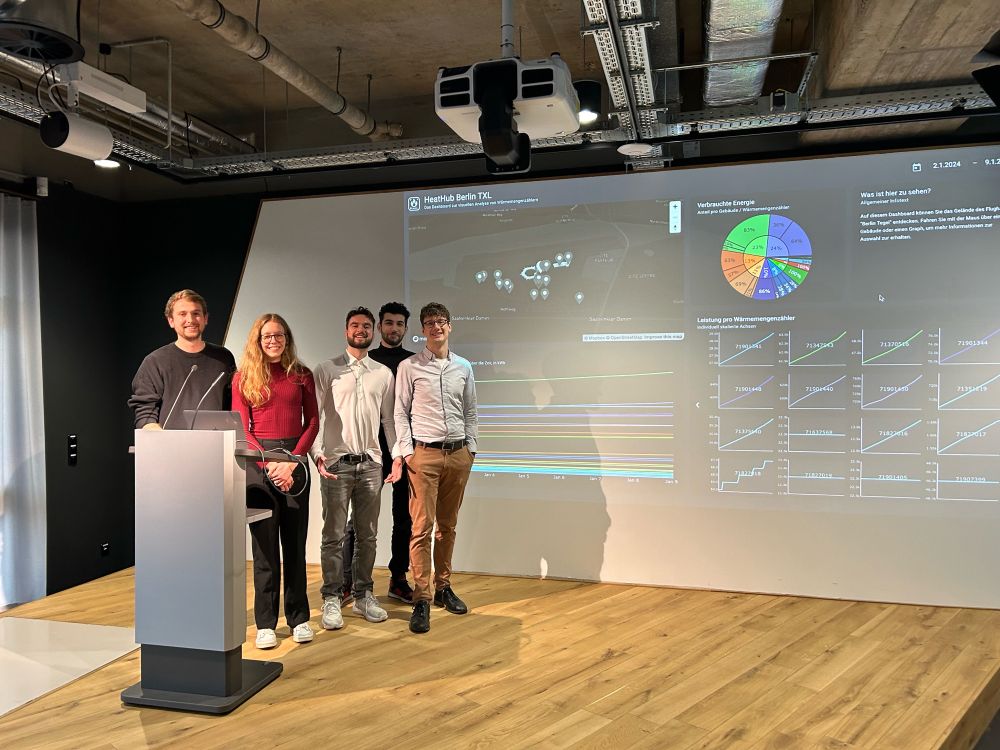
This week, students showcased their heat meter analysis dashboard at Urban Tech Republic, Berlin. After weeks of workshops and visualization design, the talented team impressed with their data-driven prototype. More info soon.
February 8, 2024 at 1:51 PM
This week, students showcased their heat meter analysis dashboard at Urban Tech Republic, Berlin. After weeks of workshops and visualization design, the talented team impressed with their data-driven prototype. More info soon.